prepared for: public service co:::pany of colorado
TRANSCRIPT

T*.
O
!
PRELIMINARY EVACUATION TIME STUDYOF THE
10-MILE RADIUS EMERGENCY PLANNING ZONEAT THE
FORT ST. VRAIN STATION
Prepared for:
Public Service Co:::pany of Colorado
k
&FEBRUARY 1980
o
eby
'
Stone & Webster Engineering Corporation fDenver, Coloradoand
Boston, Massachusetts
.
8003110'{Q;.

. . ._.-- ___ . . - . ..
.. ..
.
|TABLE OF COFTENTS
.
Section Title Pagua
1 SUMMARY.............................................
2 INTRODUCTION ........................................ .
3 RESULTS ............................................-
4 ACKNOWLEDGEMENTS ...................................
APPENDIX A BACKGROUND DOCLHEIC
; APPENDIX B SPECIAL FACILITIES-
i!
'
f.
.'
m
&
i
,
.
.}
|r s. I
e I
- - , , - _ _ .-,

*.
LIST OF TABLES
Table Title g
3-1 ESTIMATED EVACUATION TIME - GENERAL POPULATI0!i..........
3-2 SPECIAL FACILITIES WITH ESTIMATED MOBILIIATION..........
TIME OF 60 MINUTES OR GREATER,
+- A-1 SECTOR ANALYSIS.........................................
A-2 Z ONE CHA RACTE RISTI CS . . . . . . . . . . . . . . . . . . . . . . . . . . . . . . . . . . . .
- A-3 SPECIAL FACILITIES - ESTIMATED EVACUATION...............,
TRAVEL TIME,
B-1 SPE CI AL FA CILITIES . . . . . . .'. . . . . . . . . . . . . . . . . . . . . . . . . . . . . . .
*>
.
r
i
e
h
J
, . . - - .. , ,

.. . . . . . . . . .. _ _ . . - ._ . - _. . ._ _ . . _ _ . .__ - - _ _ _ . _ _ _ _ . _. - __ __ __ .
'
m
r
...
.;.....
,
;,
!.
!LIST OF FIGURES! -
i-
e
,
* Figure Title Pagg.,,,
2-1 GENERALIZED SECTOR / EVACUATION MAP AND SPECIAL.
FACILITIES..............................................1 -+
;., t
3-1 ESTIMATED SECTOR EVACUATION TIMES........................ T'-
. ; -
.
s
Y
t
t
4
u t.
t, .-
i k
+ ,-t
~
.'
d
4 {
e
1 e,4
4
a
h
!'
.- ,
b
|' .
,
4
Y t t # = 1 --w -- er-- - - + e s -- m--me + e r- *--me>+v- - w-1%--r-W-+ee*m,-- e--*--e<*-+--r-- e- -==*v-w-n - ,rv.e---

*.
SECTION 19
SUMMARY
4
Public Service Company of Colorado (PSCC), in response to a request fromthe U.S. Nuclear Regulatory Commission (NRC)* has prepared this assessmentof the time required to evacuate the area located within a 10 mile radius
of the Fort St. Vrain Station, near Platteville, Colorado. This report is
based on emergency planning data available at this time. Its findings are,.
subject to revision af ter local emergency plans have been fully developed.Findings developed in this assessment are currently under review by stateand local emergency planners.
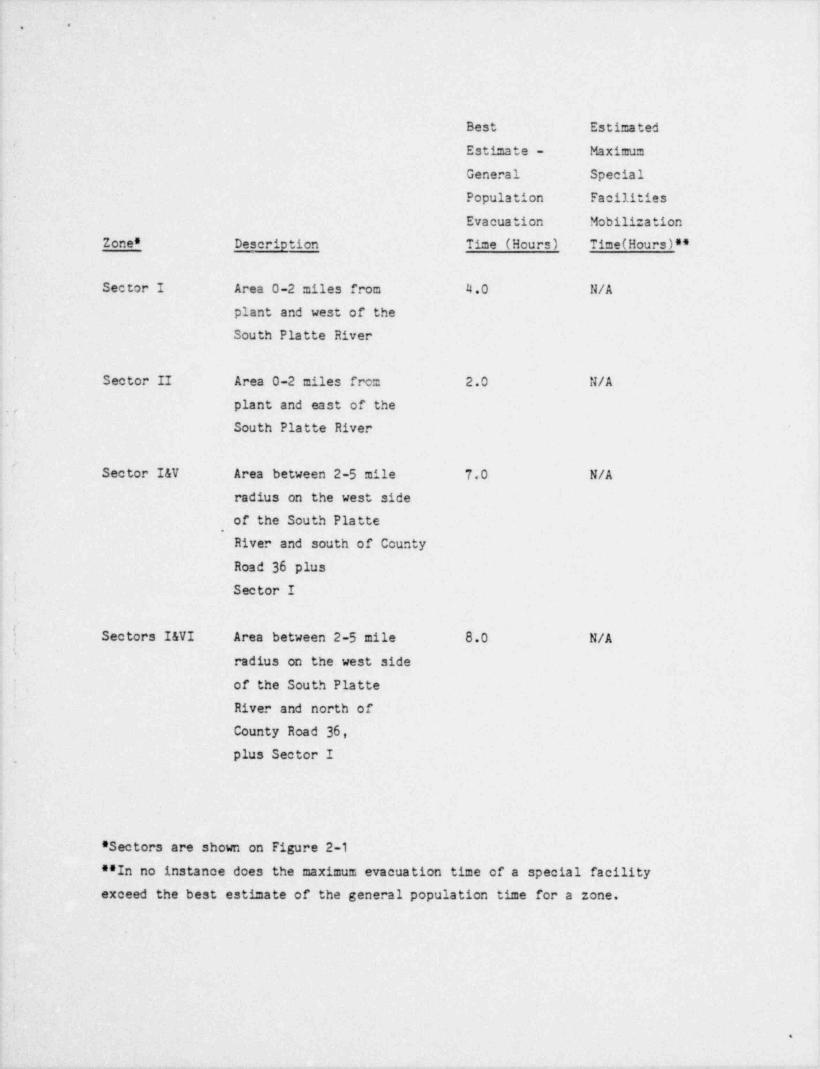
Based upon a 1979 resident population of approximately 13,000 people within10 miles of the station and an employee population of 350 the best estimateof evacuation times and maximum special facilities mobilization times byzone are as shown on the table that follows:
'I
( .
.
' Letter of November 29, 1979, from Brian K. Grimes, Director EmergencyPreparedness Task Group, Office of Nuclear Reactor Regulation, UnitedStates Nuclear Regulatory Commission, Washington, DC, to all Power ReactorLicensees
||
|"~
.
l
, -
'*_
Best Estimated
Estimate - Maximum
General Special
- Population Facilities
Evacuation Mobilization
Zone' Description Time (Hours) Time (Hours)"
Sector I Area 0-2 miles from 4.0 N/A
plant and west of the
South Platte River
Sector II Area 0-2 miles from 2.0 N/A
plant and east of the,
South Platte River
'
Sector I&V Area between 2-5 mile 7.0 N/A
radius on the west side
of the South Platte.
River and south of CountyRoad 36 plus
{ Sector I
f Sectors I&VI Area between 2-5 mile 8.0 N/A
radius on the. west sideof the South Platte
River and north of-
County Road 36,
,plus Sector I
' Sectors are shown on Figure 2-1
**In no instance does the maximum evacuation time of a special facilityexceed the best estimate of the general population time for a zone.
.
. - *~
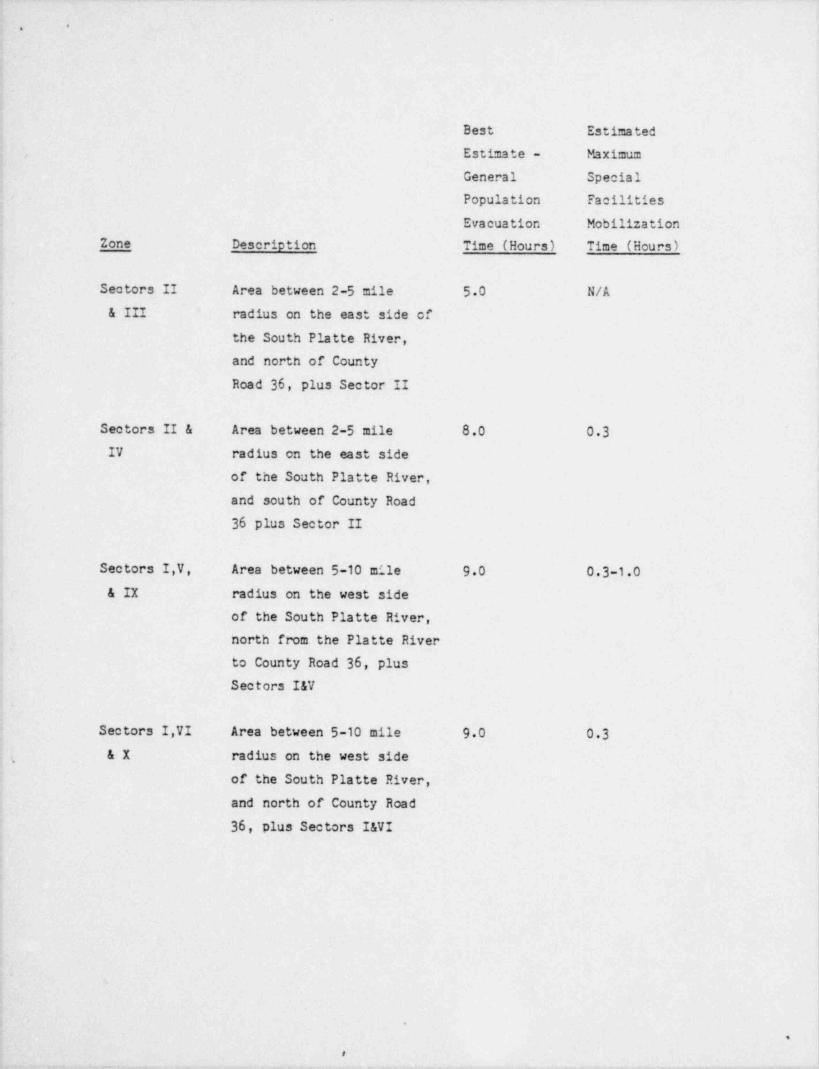
Best Estimated, Estimate - Maximum
General Special
- Population Facilities
Evacuation Mobilization
Zone Description Time (Hours) Time (Hours)
Sectors II Area between 2-5 mile 5.0 N/A
& III radius on the east side of
the South Platte River,
and north of CountyRoad 36, plus Sector II
"Sectors II & Area between 2-5 mile 8.0 0.3IV radius on the east side
of the South Platte River,
and south of County Road36 plus sector II
Sectors I,V, Area between 5-10 m'le 9.0 0 3-1.0& IX radius on the west side
of the South Platte River,
north from the Platte River '
to County Road 36, plusSectors I&V |
Sectors I,VI Area between 5-10 mile 90 0.3&X radius on the west side,
,
of the South Platte River,
and north of County Road
36, plus Sectors I&VI
i
'
.
,, ,__ r --

-.
Best Estimated
Estimate - Maximum
General Special
Population Facilities
Evacuation Mobilization
Zone Description Time (Hours) Time (Hours) *
Sectors II, Area between 5-10 mile 90 03III, & VII radtus on the east side
of the South Platte River
and north of County Road
36, plus Sectors II, III
Sectors II, Area between 5-10 mile 10.0 0.3IV & VIII radius on the east side
of the South Platte River
and south of County
Road 36, plus Sector<
II and IV,
Inclement weather conditions, particularly during the winter season, havethe potential for delaying evacuation. If evacuation routes cannot be keptopen to ensure prompt and safe evacuation, consideration will be given tothe implementation of alternate protective actions.
,
|
.

=.
SECTION 2
INTRODUCTION
This report presents an assessment, by sector, of estimated times toevacuate the general population and identified special facilities - such as
hospitals, schools, nursing homes, - located within 10 miles of the Fort
St. Vrain Station. The assessment has been prepared in compliance with theNRC's November 29, 1979, letter to all licensees authorized to operate anuclear power reactor. This preliminary report is based on emergency' -
planning data available at this time. Report contents are currently beingreviewed by local emergency planning officials.
Evacuation routes were identified from the Colorado State RadiologicalEmergency Responnse Plan (RERP) for Fort St. Vrain as revised to Nov.,1979and from information obtained in meetings with the Weld County Sheriff'sDepartment and other state and local agencies. Notification time estimateswere developed from available resources. Basic population estimates,
- distribution, and density data were obtained from the State RERP. Majoremployment centers were identified by survey. The only major employment
center in the area is the Fort St. Vrain Station. Data so collected wereused to assess estimated evacuation times on a sector basis. *
Specifically, the following three methods of analysis were utilized todevelop a range of estimated evacuation times by sector and to confirm thecapacity of the local roadway network available to handle projectedevacuation loads.
.
A more detailed discussion of these methodologies and,
their results is contained in Appendix A of this report.
.
.
|
'
!- .

*e q
W
e e e t
io u u
- ~c ,'
x.n e-
** D m v'o.., ,%.* I tN.L,
amLLmt n Ug
I WM 9e/. 1 - / / \
s uitt-
3e " / :- A \,.*
N w/ .,woe -E 2 MILE 8
/* #,
{ ( 1 ,2'r 1\ /\ :eG / !
~l
't \ Q O =} '~
we\",
. %('" ma,,
sqit
i
'
9/=
*
LittWG
h COUNTY NCAO
Q staff RCAO
@ U S EIGT417 h$*E*A PActLetT
0 * 2 3 4 3
SCALt - neiLE$
In,..
T j 'gig
FOR COMMENTS ONLY.
FIGURE 2.1,
SPECIAL FACILITIES AND EVACUATION ROUTESFORT ST. VRAIN, COLORADOPUBLIC SERVICE COMPANY OF COLORADO
.
ame-

__
-.
.
1. Calculations of evacuation time utilizing the Houston Evacuation' Model, referenced in the prepared testimony of R.W. Houston on
behalf of the NRC in the matter of Northern States Power, TyroneEnergy Park, Unit 1, Eau Claire, Wisconsin, October 7,1976, DocketNo. 50-484;
2. Estimation of evacuation times utilizing the Population Densityve.-sus Evacuation Time Curve referenced in " Evacuation Risk - An
'
Evaluation", USEPA Office of Radiation Programs, EPA-520/6-74-002;and
.
3. Estimation of a-" .able highway capacity and traffic volumes
utilizing a modification of a method referenced in the preparedtestimony of James A. Martin, Jr., on behalf of the NRC in thematter of Puget Sound Power and Light Company, Skagit Nuclear PowerPlant, Units 1 and 2, Washington.
Estimates of mobilization times for special facilities are based uponcontacts with the special facilities identified on Figure 2-1. These
estimates are contained in Appendix B. Travel time required for personnelfrom the special facilities to evacuate the 10-mile Emergency Planning Zone
,
is presented in Table A-3
'
The following assumptions have been made in analyzing the data:
i
1. That evacuation of the outer NRC designated sectors and the inneradjacent sectors occur simultaneously (i.e., within the 5-mile,
radius, evacuation of Sector V require.= the simultaneous evacuationof Sector I; and within the 10-mile radius, evacuation of Section X
requires the simultaneous evacuation of Sector VI and Sector I).The sectors are aligned to coincide with geographic and highwayboundaries familiar to the public.
.
!
.

*.
2. That automobiles will be the predominant means of transportation,with the exception of buses for school children, hanoicapped, orotherwise nonambulatory persons. An average of one automobile perdwelling unit for residential evacuation and an average of 0.9
automobiles per person for employee evacuation is also assumed.This assumption is based upon general experience for work relatedtravel vehicle occupancy.
3 That school children will be evacuated directly from the area to ,
predesignated locations where their parents will be reunited with
them. Emergency radio messages will confirm the evacuation actions
of specific schools.
4. That population data used in the analysis represents the latest and
most readily available data. Figures are based on data supplied by
The State Division of Disaster Emergency Services (D0 DES) and
include estimated total resident population, workers employed inthe sector, as well as other identifiable concentrations of
population. A conservative average of 2.2 persons per dwellingunit was assumed by D0 DES. This dwelling unit occupancy level wasadopted in this report.
5. That designated evacuation routes will remain open to evacuationtraffic through such measures as removal of snow and disabled
vehicles, sanding, and special traffic suidance control measures.
|
|
6. That sufficient manpower and resources will be available to j
i, activate and enforce evacuation routing. It is also assumed that
! at least one traffic lane on each evacuation route will beavailable for buses and other emergency vehicles. Use of a singlelane results in a conservative estimate for evacuation times.
|L
1i
*
,
4
d

*.
7. That unavoidable time delays will be incurred between the time of'
initial notification and accomplishment of evacuation, but that
these delays will be minimized by advance planning which willinclude periocic mailers to area residents identifying sector
evacuation routes, evacuation centers and other evacuation
instructions. Based upon results of similar evacuation studies, an4
average of 20 minutes for public preparation time (i.e.,
mobilization time) has been allowed for the public to react to'
evacuation notification.e
8. That inclement weather conditions, particularly during the winterseason, have the potential for delaying evacuation. In this
connection, it is assumed that the practice of plowing early and,
often in a snow storm, together with the application of sand to icyroads, will allow continued mobility during a snow storm
i evacuation. It is also assumed that existing practices dealingwith other severe storms, including the clearance of fallen trees
and wires and the provision of alternate routing around washouts,,
will be adequate to ensure mobility during severe weather. Ifa
assurances are not provided that evacuation routes can be kept openfor prompt and safe evacuation, consideration will be given to
,
implementation of alternate protective actions.
(,
' 9. That principal evacuation directions are north and south, althoughselected east and west roads will also be used. Only thoseroadways which provide a sector direct access beyond the 10-miles
radius have been considered as evacuation routes. All evacuation,
|f routes have an assumed capacity of 1000 vehicles an hour, exceptfor U.S. 85 which is assumed to have a capacity of 1500 vehicles an
j, hour. Evacuation routes and plans are discussed in more detail in
(' Appendix A..
!i 10. That in timea of immediate peril, a farm community can be mobilizedin about the same time as a urban residential community.
i!
%
|
| .,
_

-.
9
SECTION 3
|RESULTS
Ranges of estimated notification and evacuation times for the generalpublic during good weather conditions are shown, by sector, on Figure 3-1and in Table 3-1. These results are subject to change af ter finalrevisions to local emergency response plans. These estimates range from 1to 11 hours for evacuating the 2-mile radius; 3.5 to 12 hours to evacuate
.,
the O to 5 mile radius; and 5.25 to 11.0 hours to evacuate each of the O-
to 10-mile radius.
It was found that of the three methodologies applied in this study, thegraph method number 2 usually produced the highest evacuation times whilethe method based on modification of the James A. Martin Jr. approach,consistently produced the lowest evacuation times. The middle value of the
three evacuation-time estimates, rounded to the nearest hour, is shown inTable 3-1 as the best estimate.
i
No specific quantification of the impact of inclement weather conditions onevacuation-time estimates is indicated because current emergency practicesshould allow sufficient continued mobility on the area's highways duringadverse weather conditions. If evacuation routes cannot be kept open,
; consideration will be given to the implementation of alternate protectiveactions.
t
k
$
4
d
|
I,

.. . . .
e,-
I.
e e e
bto uitt-
e 3e i-
3'
a %: %*
*e 1
L... m-.
.. .
'Nd 96 *5 witt
/- .1 / .! /\gg/ .? A \ _o
'
gN w' ....oos/ee <
E t untt f n~
/74 '
| |l [ I (''' r h s~/ ds
g'' ~
V'( f*,
%| ig)-i s y
i\~\ r-- g<
\ %( y! ,_
/ ,x
; 3e
.
9-~
,
!.- *h /._*'
gn,A $f uG
e _ . ....s ..... .. i Is . . ... . g e0;;"?,.'n:2.,
. .,,,
. ....,
scat met.s*
ESTD'.ATD Ev101!!:NZONE TDE(EU.2)
02 m 1 2.5 - 9.0H 1.0 -n.0t
0-5 1C".I.3 Iav 6.0 -10. 5I a VI 35-9.5 - - -.Jnan: 3.: -ic.5n a IV 3.o - 2.o FIGURE 3.1
j j5 ,j;b' ESTIMATED SECTORc ie x:2.xs z. v. a nI. 5:75:c.c EVACUATION TIMES5'Ih6,2,g.,B''a n 5 25-u.o FORT ST. VRAIN. COLOR ADO .-
PUBLIC SERVICE COMPANY OF COLORADO,
j. , 4

.
-.
-
The time required for confirmation of evacuation is not specified becausemethods to accomplish confirmation have not yet been determined. Further,'
the consequences of the use of visible verification methods (i.e. occupantstying readily visible tags to doors as they leave, have not, to this point,
been evaluated by local officials. Discussion of appropriate verficationmethods will be recommended fcr inclusion in State and local RadiologicalEmergency Response Plans.
Estimated mobilization times, as well as the names, addresses, and'
capacities of those special facilities identified on Figure 2-1 which have
estimated mobilization times of 60 minutes or greater, are shown in Table3-2. Evacuation of special facilities located inside the 10-mile area can
be accomplished within a maximum of 0.5 hours, once the facility is,,
mobilized sif sufficient vehicles are available and priority egress is4
allowed to minimize conflict with other vehicular traffic.
1
-y
,
m
>
I
l

, y _. , ._ ... , , , . ,
.
6
TABLE 3-1
FORT ST. VRAIN STATION
ESTINATED EVACUATION TIME OF Tile CENERAL POPULATION WITHIN10 HILES OF Tile STATION
Estimated Good Weather Evacuation Time
Range ofEstimatedEstimated Total
1979 Estimated Estimated Evacuation BestResident Not t f! cation Hobillzation Time EstimateJone Population (Hours ) Time (Hinutess e) (Hours ***) (Hours ****)e
_
0-2 Hiles
I 490 2.1 20 2.0-9.0 4.0II 76 0.6 20 1.0-11.0 2.0
0-5 H11es
I&V 904 6.0 20 6.0-10.25 7.01 & VI 1094 30 20 3 5-9.75 8.0II & III 374 25 20 3.00-10.50 5.0II & IV 1802 2.4 ,3 3.00-12.00 8.0*
E10 Hines
I,V.IX 4449 5.6 20 5.2-9.5 9.0I.VI.11 5471 4.1 20 5.5-10.25 9.0II,III,8VII 1703 4.7 20 5.75-9.75 9.0II,IV,VIII 2244 4.1 20 5.25-11.0 10
* Based on " Testimony of R.W. Houston, Matter of Northern States Power, Tyrone Energy Park, Unit I, EAUclaire, Wisconstn*,3 October 7,1976; Docket No. 50-484.
seEstimated 20 minutes mobilization time based on " Evacuation Analysis: Indian Point Site," New YorkState Office of Disaster Preparedness, New York State Department of Health Hay 1978.
eseRange determined from lowest and highest of the three evacuation time estimates.****This represents the olddle value of the three evacuation time estimates recorded to the nearest hour.

. - -. . _ . - - - -- - - - . . .
, , e ~ ~ . ,, ..., , . ,
.
.
4
TADt.E 3-2FORT St. VRAIN STATION
SPECIAL FACILit!ES WITH ESTIMATED HOBILIZATION TIMEOF 60 MINUTES OR GREATER
HapTotal Estisunted
Identification capacity Facility N bilizationSector Comununity Number Name/ Address (Persons) Time (liours)eII Frederick 19 Frederick Elem School 735 0 3-1.0
I
e Time required to clear facility and have transportation available, but not to move out of the 10 mile area.

. . . . ..-. ..
-.
. . ..
i
.
t ,
,
d
,.
1
SECTION 4i
ACKNOWLEDGEMENT,
i;
Public Service Company of Colorado wishes to thank state, city, county,-
school officials, representatives and management of special facilities ande
state and local government emergency planners for their assistance in the,
preparation and review of this report.4 ;
, . ,
4
4
f
(
<
t
f
,
'1
$
9
J
- ,e- ,. - -,--,-,n- w -

*,e
f
Y"
,
rAppendix A.;
BACKGROUND DOCUME!C
,
t
4
i
*
f,
. .
_ _ - _ - _ _ _ _ _ _ _ _
*. .
?
.
APPENDIX A
,
a
BACKGROUND DOCUMENT
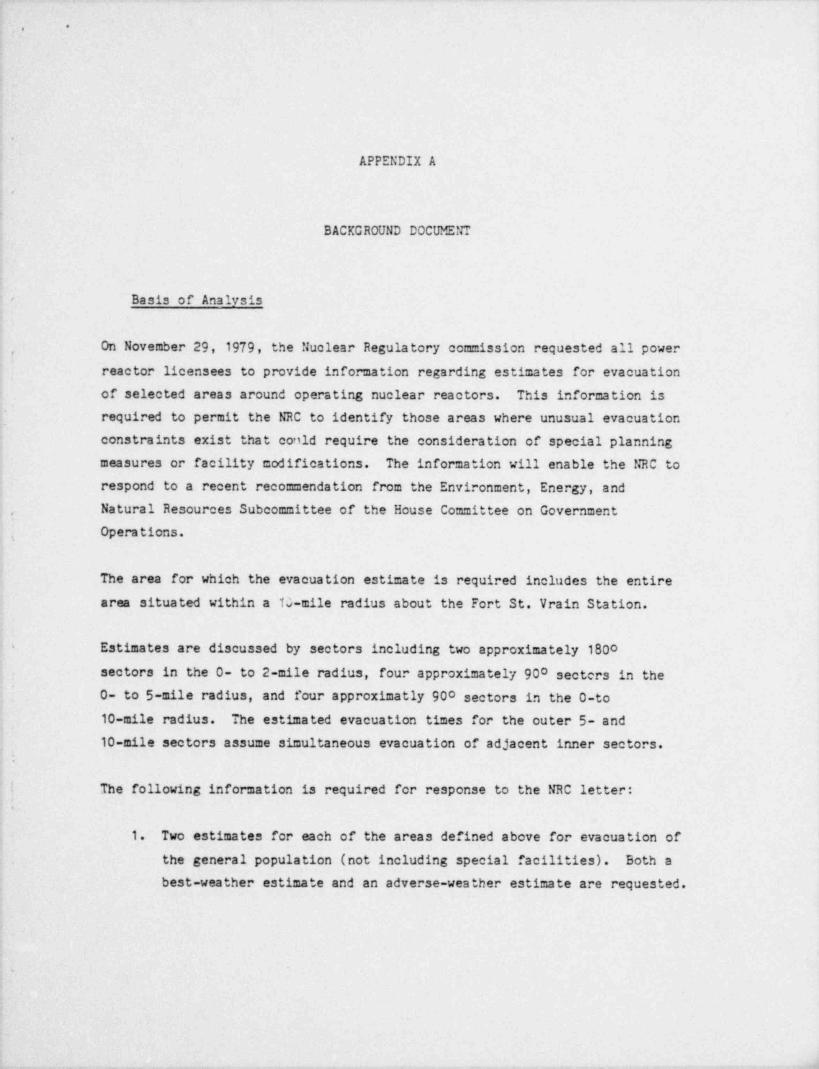
Basis of Analysis-
On November 29, 1979, the Nuclear Regulatory commission requested all power
reactor licensees to provide information regarding estimates for evacuation
of selected areas around operating nuclear reactors. This information is
required to permit the NRC to identify those areas where unusual evacuation
constraints exist that could require the consideration of special planningmeasures or facility modifications. The information will enable the NRC to
respond to a recent recommendation from the Environment, Energy, and
Natural Resources Subcommittee of the House Committee on Governmenty
Operations.
The area for which the evacuation estimate is required includes the entirearea situated within a 10-mile radius about the Fort St. Vrain Station.
Estimates are discussed by sectors including two approximately 180o> '
sectors in the O- to 2-mile radius, four approximately 900 sectors in theO- to 5-mile radius, and four approximatly 900 sectors in the 0-to
10-mile radius. The estimated evacuation times for the outer 5- and10-mile sectors assume simultaneous evacuation of adjacent inner sectors. |
.
|
| The following information is required for response to the NRC letter: .||
1. Two estimates for each of the areas defined above for evacuation ofthe general population (not including special facilities). Both a
best-weather estimate and an adverse-weather estimate are requested.
$
w --ir v
*,.
,
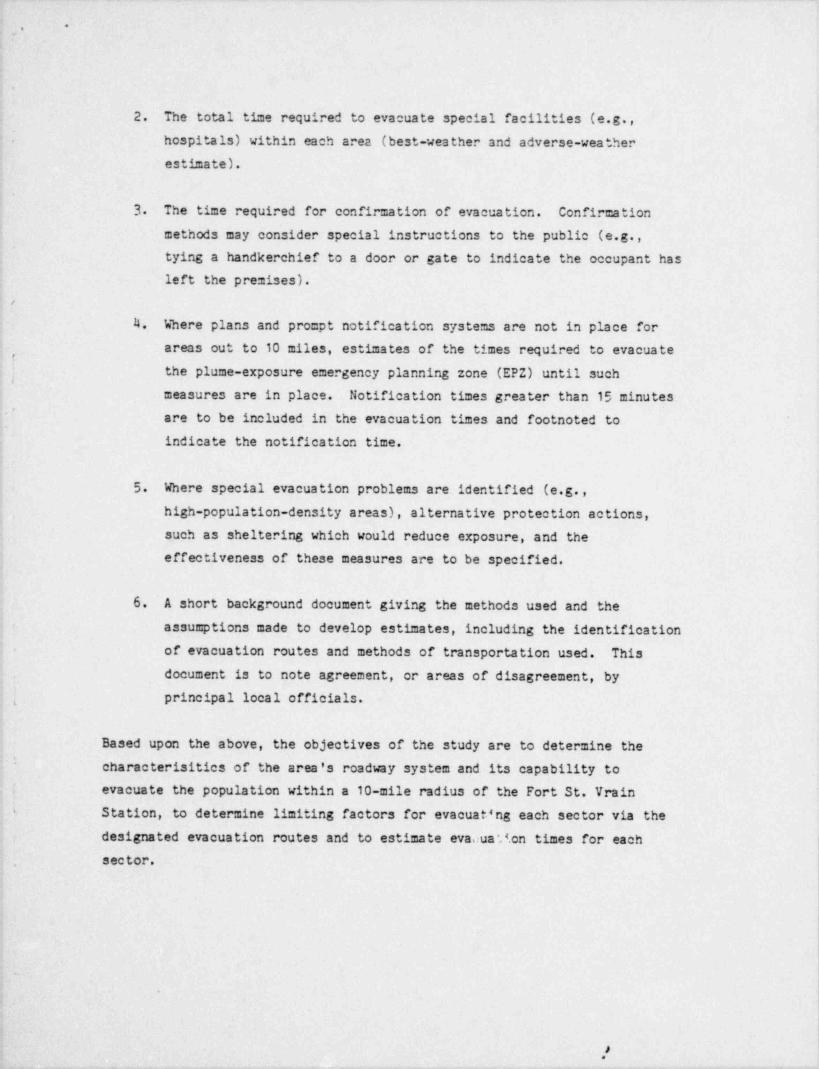
2. The total time required to evacuate special facilities (e.g.,hospitals) within each area (best-weather and adverse-weather,
estimate).
3 The time required for confirmation of evacuation. Confirmation
methods may consider special instructions to the public (e.g.,
tying a handkerchief to a door or gate to indicate the occupant hasleft the premises).
<
4 Where plans and prompt notification systems are not in place forareas out to 10 miles, estimates of the times required to evacuate
j the plume-exposure emergency planning zone (EPZ) until suchmeasures are in place. Notification times greater than 15 minutes
' 'are to be included in the evacuation times and footnoted toindicate the notification time.4
5. Where special evacuation problems are identified (e.g.,high-population-density areas), alternative protection actions,,
such as sheltering which would reduce exposure, and theeffectiveness of these measures are to be specified.
6. A short background document giving the methods used and the
assumptions made to develop estimates, including the identification-
|* of evacuation routes and methods of transportation used. Thisdocument is to note agreement, or areas of disagreement, by
i principal local officials.1
Based upon the above, the objectives of the study are to determine the'
characterisitics of the area's roadway system and its capability to( evacuate the population within a 10-mile radius of the Fort St. Vrain
i - Station, to determine limiting factors for evacuating each sector via thedesignated evacuation routes and to estimate evacuation times for each,
sector.
m
W
.'

*..
The study does not address the means to notify the populace to evacuate.State and local Radiological Emergency Respose Plans will designatepredetermined evacuation procedures and responsibilities, including meansof public notification and identification of evacuation centers. State and
.
local emergency plans will also include the basis for notification,responsible agencies, methods of 24-hour communication and a generaldescription of the information to be communicated.
In addition, state and local plans will give consideration to methods ofverifying public sector notification. Methods to be considered may includethe use of readily visible evacuation tags previously distributed to a
f
household, and the use of identifying tags or notices on a street or areas
basis. In this connection, State and local plans should give consideration
'{ to the consequences of visible verification methods (i.e., identification' of empty homes susceptive to looting).
Evacuation of General Population
There is no single recognized methodology to assess an area's evacuation
capability. Three approaches have been used to establish a range ofevacuation-time estimates.
,
! The basic information which must be collected to assess an area's,,
evacuability using these methodologies, includes:
a. The capacity of principal evacuation routes,
! b. Population and its density and distribution on a town, township orsector basis,
i c. Estimated notification times for the general population (includingemployees), as well as mobilization times for special facilities,
such as schools, hospitals and nursing homes.i|
!!
.
d
. ._
''.,
,
Most of the information in this report was gathered from the State of
Colorado RERP for the Fort St. Vrain Station and by contacting local.
officials. In addition, special facilities were contacted to determine the
maximum number of persons who would have to be evacuated during any given,
; period and to obtain estimates of the time required to evacuate the
individual site.
Numerous streets and highways within the 10-mile radius were identifed inthe existing State Emergency Plan as evacuation routes. For the purposes<
of this analysis, only those routes which provide direct sector access
beyond tha 10-mile radius are considered for evacution routes. This,
assumption allows the designation of consistent routes of evacuation for,
any emergency regardless of the number, or location, of the sectors
~{'
involved. Taking these considerations into account, the street and highway'
facilities shown in Table A-1 are designated as evacuation routes.
Population distribution for the area surrounding the Fort St. Vrain Stationis based upon data provided by D0 DES. Population data collected from these
sources was then distributed within the sectors identified in the November29, 1979, NRC letter.;
,The major employment center in the area is the Fort St. Vrain Station where
a maximum of 350 people are employed. There are no other major employers' within 10 miles of the plant. No deductions were taken for residents who
leave the area for their jobs, schools, or for other reasons. Use of this
methodology will result in conservative traffic volumes and evacuation
times.
i
ill

.-,
Data were then evaluated using each of the following methodologies:
1. An evacuation model developed by Dr. R.W. Houston (1) designed to
estimate vehicular evacuation times as a function of azimuth and.
distance about a potential source and based, in part, eninformation contained in " Evacuation Risks - An Evaluation".(2) The
model relates evacuation time in hours (t ) to the populatione
initially in the impact area (N ), the area of impact in squareomiles ( A), and the number of roads leaving the area (L). The
formula developed for this model is te = 1.05 Ao.27No.23/Lo.5
I1
For the purposes of the analysis, time is measured from the initial'{ warning to the population at large since activities to this point
are subject to a substantial measure of control and because it is
consistent with historical evacuation-time information. Sincehistorical evacuation-time information includes warning times aswell as evacuation times, initial warning is defined as the,
f beginning of the notification process and, by definition, coincideswith the implementation of evacuation. Thus, the results of thisanalysis include the time to notify the genera public as well asthe time to evacuate the general population from the impacted
[ area. Parameters are inserted into the model to represent the-
i effect of time-delay factors which act to prevent instantaneousrealization of full evacuation route capacities. These parametersreflect delays due to the spread of warnings, preparation forevacuation, waiting times vacate parking lots and side streets,distances between vehicles, vehicle speeds, variations in speed and
.
driving habits, etc.
! U
'- The time-delay parameter used in the model is based upon an
analysis which shows a correlation between road miles per squaremile of land area (r) and population density (p). This analysisresulted in a formula (r=0.281 po.403) which, given thepopulation density of an area, yields an estimate of the number ofroad miles per square mile of land area.
| |'
i
i e

.,.
Given the area of the evacuation sone, the number of road miles in
the area can be estimated..
A second formula (Lg37=r /2) can then be used to determine theonumber of evacuation routes in the area if they are not known.'
This second formula assumes that the average length of a roadwithin the Area A is on the order of the square root of A; so the
average number of roads within the area is approximately rA /A,and one-half of the average nu=ber of roads is available for use as
,
evacuation routes. It should be noted that roads counted asleaving an area do not return to an area and roads internal to an
area are not counted as evacuation routes.'
i
,
A plot of the resuts of this analysis for selected historical
events (Evacuation Risks - An Elevation, USEPA, Office of RadiationPrograms, EPA-500/6-74-002) shows that, in high population densityregions of about 15,000 persons per square mile or greater, delaysappear to be relatively brief and evacuation times are more
controlled by roadway capacities. For areas of lower populationdensity, such as around the Fort St. Vrain Nuclear Power Station,evacuation times depend more on parameters other than roadway4
! capacities. Taking these considerations into account yields theformula intiailly identifed and used in this analysis.
t
(t =1.05A .27N o 23fto,5)0e o
(1) Houston Evacuation Model referenced in the prepared testimony of Mr.R.W. Houston on behalf of the Nuclear Regulatory Commission (NRC) in the
matter of Northern States Power, Tyrone Energy Park, Unit 1, Eau Claire,! Wisconsin, October 7,1976, Docket No. 50-484.
!,
i
>

..
2. Method No. 2 (2) utilizes Figure 2, Population Density versusEvacuation Time, contained in " EPA-500/6-74-002 as the basis of.
calculations. This graph is based upon questionnaires completedfollowing actual evacuation incidents. It shows a correlation
a
between population density and the time required to evacuate theimpacted area using predominantly private vehicles. Populationdensities surveyed by EPA during development of the graph rangedfrom approximately 15 persons /per square mile to 20,000persons / square mile. Evacuation times ranged from 2 hours to 18hours and include warning times as well as the time required toevacuate the population. It is theorized that the greaterevacuation times required to evacuate less densely populated areaswere largely due to the longer warning times required because of
|[ increased distances between persons and the need for the more'
individual contact; to the longer times required to prepare farmsfor a " shutdown" than theose required for urban residences, and tolimited choice and direction of roads in less dense areas.
.
{ This second methed requires that the population density by squaremile be determined. These data are then entered in the graph andthe estimated time and hours to evacuate the area are read directlyfrom the graph.
(2)" Evacuation Risk - An Evaluation, "USEPA Office Radiation Programs,EPA-520/6-74-002; and)
4
3 The third method (3) estimates the ability to evacuate impacted, areas based on the capacity of local evacuation routes, distancet-
between vehicles, flow rates of vehicles, and vehicle occupancy.! This method determines whether the roads can accommodate the'l* evacuating population.
. 4
m

-,
The number of egress routes in each area is first determined. The
average capacity for each highway (one lane or more if available)
is then derived to define the total average capacity for eacharea. One lane of each road is maintained open for emergencyvehicle traffic. The results represent the number of vehicles
which can be accommodated. The maximum time required to accomplishevacuation of each area is then estimated by assigning trafficflows to the various highway links and estimating the times.
In determining capacities, a value of 1,000 vehicles per lane peri
hour was assumed.(4) At least one lane of each roadway was assumed,-
| to be kept open for special and emergency vehicles. U.S. Route 85was assigned a capacity of 1,500 vehicles per lane per hour.
,
!
(3)(Modification of a method referenced in the prepared testimony of JameaA. Martin, Jr., on behalf of the NRC in the matter of Puget Sound Power andLight Company, Skagit Nuclear Power Plant, Units 1 and 2 Washington.)
(4) Transportation and Traffic Engineering Handbook, The Institute ofTraffic Engineers,1976
e
f
These three methods of analysis provide a range of estimated evacuation
times by sector. The middle value of the three evacuation-time estimates,rounded to the nearest hour, is assume to represent the best estimate.
!Special Facilities
| .
i
The evacuation times for special facilities are based upon direct contacts-
with the facilities, rather than any of the above methodologies. Thespecial facilities identified included:
1. Nursing homes;
2. Schools (including voaational, technical, training, andhandicapped),
3 Senior citizen activity centers;
4. Recreation areas;
5. Day care centers

.
O*
The following questions were asked of special facilities located within 10miles of the Fort St. Vrain Station. The information is forweekday / daytime occurence.
,
Nursing Homes,
'
1. Number of in-patients?'
2. Percent of in-patients that would be moved short of imminent
disaster to facility?
3 Percent of in-patients identified in Question 2 requiring specialtransportation (e.g. , ambulance, wheelchair)?,
I
; 4. Previous experience or time estimates for in-patient evacuation ofbuilding (e.g., firedrills)?
t5. Available transportation (quantified) to take patiencs away from
facility (e.g., staff autos, ambulances)?6. Where would patients be taken?
Schools
i
1. Number of students?!
2. Number of staff and student autos and buses available?3 Special transportation needs of students?4. Availability of special transportation?
'
5. Previous evacuations or planning (e.g., fire drills, time to laodbuses after school)?
Senior Citizen Centers,
i
1. Number of members present at a particular time?2. Available transportation?
3 Special transportation nesds?

.
I
Recreation Areas.
1. Number of persons at peak use periods?
2. Estimated time for evacuation (based on estimated or weatherrelated conditions)?
Day Care
!
i See Schools
,
| Individual Sector Analysis
'I The evacuation analysis of the sectors identified in the November 29, 1979,NRC letter is discussed below on the basis of the O to 2 mile radius, the Oto 5 mile radius, and the o to 10 mile radius. The characteristics of the
individual sectors are contained in Table A-2.t
j The range of results using the three methodologies previously descirbedwere in Table A-1 and are described below.
.
Analysis of the O to 2 Mile Radius
!
The O to 2 mile radius includes the two approximately 1800 sectors east |; and west of the South Platte River. The approximately 9 square mile
Sector I area is west of the South Platte River and contains about 140residents and about 350 workers employed at the Fort St. Vrain Station. It I
is estimated that approximatley 380 privately-owned vehicles are available'
to evacuate the total resident and employed population of 490 persons. i
li
i |
I- The designated north / south evacuation routes from Sector I are County Road(CR) 17, CR 21, and CR 19 The designated west evacuation routes are CR 34-
and CR 36. All routes are two lane roadways. During an emergency, onelane will be maintained free from all but cmergency vehicle traffic andevacuation buses. It is estimated that a-Jh road will carry an average of '

. ._ - __ _- _ - - - _ _ _ _ _ _ _ _ _ _ _ _ _ _
.
1,000 vehicles per hour. As a result, evacuation of Sector I is estimated
to require 2.5 to 9 hours. This estimate includes the time necessary tonotify and mobilize the population. The best estimate of time is 4 hours.
The approximately 3 5 sq mile Sector II area contains 76 residents and no,
employees. It is estimated that 35 privately owned vehicles are available'
to evacuate the population.
The designated evacuaton routes from Sector II are CR 36, 38, and 23 All
are two lane roadways with an estimated capacity of 1,000 vehicles per
hour. It is estimated that Sector II can be evacuated in 1.0 to 11.0hours, including notification and mobilization time. The best estimate of
evacuation time if 2 hours....
There were no special facilities identified in either Sector I or Section
II.
Anlavsis of the O to 5 Mile Radius
The O to 5 mile radius contains four sectors, Sectors III, IV, V and VI, ,
plus the 0-2 mile radius sectors. See?';s 'TI and IV are east of the South
Platte River, while Sectors V and VI r>.re west of tne River. Sector III
consists of that area within the 2 to 5 mile radius, southeast of the South
Platte River and porth of CR 36 and is 11.0 square miles in area.'
.
The analysis assumes that Sector III will be evacuated with Sector II via
CR 40, CR 27 .tnd U.S. Bt. The esticited capacity of U.S. 85 is 1,500
vehicles per lane per hour and the tio County Roads are 1,000 vehicles perlane per hour. The 374 residents within this approximately 14.5 sq mile
'zone can be evacuated in 3 0 to 10.5 hours, including the time to notify
and mobilize residents. The best eptimate of time is 5.0 hours.
Sector IV includes that area within the 2 to 5 mile radius that is south ofCR 36 and east of the South Platte River. The approximately 10.5 sq milesector includes the town of Platteville.
,
I*
,
,_
*,
The analysis assumes that Sector IV will be evacuated with Sector II by wayof U.S. 85. The evacution of the 1,000 residents within the conecontaining Sectors II and IV via this facility would require 3.0 to 12.0hours. including notification and mebilization time. The best estimate of
time is 8.0 hours.
The greatest concentration of resident population in Sector IV is near thetown of Plattevi'le with a popluation of about 1,500 residents. Specialconsiderations include two schools in Platteville with an enrollment of 635
'
students.
Sector V encompasses the almost 23 sq mile area witnin the 2 to 5 mile
-radius situated west of the South Platte River and south of CR 36.
The 904 residents in Sectors I and V will be evacuated by way of CR 19,13,30, and 34. Evacuation of the approximately 32 sq mile area of Sectors Iand V would require 6.0 to 10.25 hours, including time to notify andmobilize the population. The best estimate of time is 7.0 hours.
Sector VI is that portion of the 2 to 5 mile radius located west of theSouth Platte River and north of CR 36. It encompasses approximately 21square miles of area. This analysis assumes that Sector VI will beevacuated with Sector I.
i
: Sectors I and VI will be evacuated by way of four two-lane roadways, CR 36,[. 13, 17, and 21. About 3 5 to 9 75 hours would be required to notify,
mobilize and evacuate the 29 sq mile area of Sectors I and VI in whichabout 1,094 people reside and work. The best estimate of time for theprocess is 8.0 hours.
',
.-
1 4

-- .. ._ - - - - - - - -. - --. - - - . ..
*,
r
Analysis of the O to 10 Mile Radius4
The 0 to 10 mile radius contains four sectors, i.e., Sectors VII, VIII, IX
and X, in addition to the sectors within the 0-5 mile radius. Sectors VII
and VIII are east of the South Platte River. Sectors IX and X are west ofthe South Platte River.
Sector VII is located east of the South Platte River and north of CR 36.; The approximately 34 square mile area includes the town of Gilerest. The
;
' analysis assumes that Sector VII will be evacuated in conjunction withSectors II and III. U.S. 85, CR 44, and CR 42 will be used in theevacuation. Approximately 1,703 persons live within the 48 square milearea of Sectors II, III and VII and can be evacuated in 5 75 to 9 75 hours
(including notification and mobilization time). The best estimate ofrequired time is 9 0 hours.
Special concerns for evacuation in the Sectors II, III and VII area includethe two schools in Gilcrest with approximately 675 students.
,
Sector VIII which will be evacuated in conjunction with Sectors II and IV,encompasses approximately 48 square miles of area situated south of CR 36and east of the South Platte River. Population density in the sector is
i low. U.S. 85 will be used to evacuate the majority of the 2,244 residentsfrom the zone CR 32 and CR 39 will also be used to evacuate people near theperimeter of. the zone. About 5.25 to 11.0 hours will be required tonotify, mobilize and evacuate the total population. The best estimate of,
time is 10 hours. There are no special facilities for evacuation other,
; i than those in.Platteville., e-f
I The 73 square mile Sector IX situated west of 'the South Platte River and CRj" 36 will be evacuated in conjunction with Sectors I and V by way of CR 7,
13, 19,18, 24, 28, 30, and 34. The notification, mobilization, and. evacuation of the 4,449 residents and 350 employees in the zone could occur'
.
in 5.25 to 9.5 hours. The best estimate of time is 9 hours. Specialconcerns for evacuation in the area are schools in Mead and Firestone andthe Barbour Ponds State Recreation Area.
|
I |

_. -- - __ - ____ _
*.
Sector X is located west of the South Platte River and north of CR 36.Populstion within the sector's 80 square mile area is concentrated in the-
communities of Milliken and Johnstown. Sector X will be evacuted inconjunction with Sectors I and VI. The estimated 5,471 residents and
,
employees from these sectors will utilize the two lane CR 36, CR 44, CR 46,CR 50, CR 17, CR 21 and CR 54 during the evacuation. Notification,mobilization and evacuation time is estimated to be 5.5 to 10.25 hours.The best estimate of time is 9 hours. Special concerns during the
j evacuation include four public schools and a senior citizen's center.
Traffic Control
For the most part the evacuation estimates were based on the following
[{ assumptions:i
1. That the most direst route will be used to evacuate the area,
2. That traffic will travel in only one direction on evacuation routes,,1
,
3 That traffic will not cross at intersections, and.
4. That traffic will not be sent from one evacuation zone throu6h-
another, i.e. traffic from the zone made up of Sector IV & II
should not be sent north along U.S. Route 85 into the zoneconsisting of Sector III, & II during an evacuation.
.-
These traffic patterns will require traffic control points along evacuationroutes. The number and location of these control points will be determined
by local available resources and by the emergency. The following general
|- recommendations are made.
Employees leaving the Fort St. Vrain Station should be sent north along CR19. People leaving Johnstown should be sent west on CR 50. Sending,
Johnstown residents north along CR 17 could result in delays at the bridgeover the Big Thompson River. People leaving Milliken should be sent northalong CR 21. This is the most direct route even though there is a river
crossing. Platteville should be evacuated south along U.S. Route 85.
.

* *. .
|
Beyond these general recommendations the only traffic control needed ismaintenance of one way tra ffic and the elimination of traffic crossings. '
This plan does not address radiological monitoring of evacuees or theirvehicles.
Evacuation of Special Facilities
Special facilities identified within 10 miles of the Fort St. Vrain Stationare shown on Figure 2-1. An effort was made to identify and contact all
special facilities within the 10-mile area.
.
I
The facilities' names, addresses, type of facility, maximum number of,
residents /studets, number of staff / student automobiles available, and,
'; esttmated mobilization time are contained in Appendix B. Estimatedevacuation-travel times for special facilities are shown in Table A-3 for agiven type of facility. Generally, personnel from school facilities would
be evacuated by high capacity vehicles which would receive prioritytreatment during evacuation. The emergency lane provided on each
evacuation route would be used by vehicles transporting special facilitypersonnel. Thus, relatively high, speeds (assumed at 20 mph) could beattained. As a result, maximum travel time for evacuating personnel fromspecial facilities beyond the 10-mile area should not exceed one-half hour.
Alternative Actions
!! Evacuation of the population to minimize public exposure to a passing
radioactive material cloud is the protective action most discussed. Thereare, however, other protective measures available which may be more
-
appropriate*,
L
,
9

, .,
Generally, the type of accident is the first consideration.' If a low
probability, " core degredation" accident occurs, a relatively long release-
duration would generally result in a recommendation for evacuation.However, if weather and roadway conditions could hamper the evacuation,
process sheltering people within their own homes or public safety, couldsubstantially reduce whole body exposures. To maximize the benefits ofsheltering, windows and doors of homes should be closed and sealed, andventilation systems turned off to minize the turnover rate of air within
the building.
Calculations have shown that sheltering individuals can reduce the dosefrom inhaled radionuclides by up to 35 percent.' Larger reductions can bej
achieved by the emergency sealing of openings in the structure such as,[ taping windows or placing wet paper over cracks.[
.
In the event of an atmospheric release of radioactive materials, doses tothe public could occur by external radiation, by exposure to externalradiation from radionuclides deposited on the ground and other surfaces, orby internal exposure due to inhalation of radienuclides. Levels in excessof accepted protective action quidelines would generally occur closer tothe souroe so that the protective actions could be recommended on atwo-phase approach. The first phase would be to evacuate indivduals close
' to the source (i.e., within 1-5 mile radius), while the second phase couldbe a recommendation to take shelter and institute food, water, and milk
~ control. Beyond 10 miles there is little distinction between the
effectiveness of evacuation and sheltering in terms of minimizing projectedhealth effects.'
.
Other actions which may be used include removal of grazing animals from'. pasture; div raion of raw milk to milk products such as cheese and butter;
-i' closing wate intake valves from a contaminated water source; importation
of uncontaminated food and water supplies; decontamination of contaminated,
. materials and foodstuffs; and, use of potassium iodide as a prophlylaxis toreduce the dose to the thyroid.<
.
$
--

_ _ _ _ _ _ _ - .
. .,
These represent o.117 a few of the alternate courses which could be taken in- a radiological emergency. The particular actions chosen will, of course,
depend upon the type and severity of the accident as well as such other
parameters as meteorological conditions, time of day and so forth.
f
-}
,
eExamination of Offsite Emergency Protective Measures for Core Melt
Accidents. Aldrich, D.C. , McGrath, P.E. , Ericson, D.M. , Jr. , and Jones,R.B., of Sandia Laboratories, Alburquerque, New Mexico, and Rasmussen,
' N.C., Department of Nuclear Engineering, M.I.T., Cambridge, Massachusetts,
; as presented at the American Nuclear Society Topical Meeting ofProbabalistic Analysis of Nuclear Reactor Safety, May 8-10, 1978.4
1
1
l.
4
4
|
i1
4
.

__
, . _ , ,__. , . . - -- -
! .
.
e
TABt.E A-1FORT ST. VRAIK JTATION
SECTOR ANALTSIS
Fraeuation Routes Estimated Good Weather Evacuation fleeRange of
Notification EstteatedEstteated Estimated Average Time in Mobiliza- Total?otal Popu. Ilo. of Facility Excess or tion Evacuationlation To be Vehicles llo. of Capacity 15 Min' timeesZone Evacuated Available Facility Lanes (Veh/hr) (Minutes) (Minutes) (Hours)eseTimes
0-2 Miles
I 490 180 CR17 2 1000 110 20 2.5-9.0CR19 2 1000CR21 2 1000CR34 2 1000CR36 2 1000
II 16 35 CR23 2 1000 20 20 1.0-11.0CR36 2 1000CR 1R 2 10000-5 Miles
! e' 904 567 Cat) 2 1000 345 20 6-10.25CRI9 2 1000CR30 2 1000CR34 2 1000
I & VI 1994 653 Cal 3 2 1000 16 5 20 3.5-9.75CR17 2 1000CR21 2 1000CR36 2 1000
II & III 374 170 CR77 2 1000 135 20 3.0-10.5CR40 2 1000U.S. 85 4 1000
II & IV 1802 slg U.S. 85 4 1500 130 20 3.0 12.000-10 MilesI.Y II 4449 217R CR 7 2 1000 320 20 5.25-9.5CR 13 2 1000
CR19 2 1000Cal 8 2 1000CR24 2 1000CR28 2 1000CR30 2 1000CR34
_ _ _ _ _ _ _ _ _ _ _ _ _ - _ _ - _ - - - - . _ _ _

_ _ _ - --- .-
, ,, . . . . . - , ^~ -' ' '
.
.
ei
TADLE A-1FORT ST. TRAIN STAfl0N
SECTOR ANALYSIS
Evacuation Routes Estiested Good Weather Evacuation TleeRange of
Nott rication EstimatedEstimated Estimated Average flee in Mobilita. TotalTotta Popu No. of Facility Excess of tion Evacuationla tion To be Vehtolas No. of Capaatty 15 Min' time'' Times. Zone Evacuated Available Facility lanes (Veh/hr) (Minutes) (Minutes) (flours)' "I VI , & I 5471 2643 CR 17 2 1000 230 20 5.5-9.5CR 21 2 1000
CR 36 2 1000CR 44 2 1000CR 46 2 1000CR So 2 1000CR 54 2 1000
II,III EVII 1703 774 U.S. 85 4 1500 265 20 5.15-9 15CR 42 2 1000CR 44 2 1000
II,IV,VIII 2244 in20 CR 32 2 1000 230 20 5.25-11.0-
CR 39 2 1000U.S. 85 4 1500
* Based on "Testtaony of R.W. Houston, Matter of Northern States Power, Tyrone Energy Park, Unit 1 . EAU Clair, Wisconsin:3 October 7,1976;Docket No. 50-484
** Estimated 20 minutes unbilization time based on * Evacuation Analysist Indian Point Site, "New Yort State Orrice of DisasterPreparedness, New York State Department of Health, May 1978.
8888arge deterstned from lowest and hiahest of the three evacuation time estimates.

il.- . _, - . _ _ , - ..-
.
.
.
TABLE A-2
FORT ST. VRAIN STATION
ZONE CHARACTERISTICS.
Population Evacuation VehiclesArea Total To Be Resident Employee
Zone' (So M1) Residents Employees Evacuated Owned Owned Total
0-2 MilesI 9.2 140 350 490 64 315 379II 3.4 76 76 35 35- -
0-5 MilesI&V 33.8 554 350 904 252 315 567I & VI 29.2 744 350 1094 338 315 653II & III 14.7 374 - 374 170 170-
II & IV 14.9 1802 1802 819 - 819-
0-10 MilesI,V, IX 106.8 4099 350 4449 1863 315 2178I, VI, x 109.6 5121 350 5471 2328 315 2643II,III,VII 47.7 1736 - 1736 774 - 774II,IV,VIII 62.8 2244 2244 1020 1020- -
- _ _ _ _ _ _ _ _ _ _ _ _ _ - _ _ - _ _ _ - _ __ -__.- ___ _ ____

,
i o.
,
e rm ei n vo dT
i dt ean e
n t tnaD u0 ?o a ad p2i e m m tt r nno oy ra c roor cl ouc te oiif n Fa
I - - - - - ftt - - - eiaad mm f,, v gzce
__ s i!fii u oE n!i r t s
d s sE e s rbt q e i
_ nt iu t a u- t t ni a oe ve dT a re Wmnrn oz at ara ri 1 iLs t ut nt eE 8 8 c ei V a ei nE SC - - - - - o 0 0 - nv id a lA
RT ae m
,o 0le et 1O mIil e01 T t e d0 A
1 U v i
l a sT C t er tA A u3 S E
r vt uT Vt a os ro- tt dN D r 0 7, eA I E u es tA T N - - - - 1 o - - - t a aE R A
B V M uh cL
n oIA imt. T y lT T S i eS E 0l r
T - 2i aR e cO S r .a sF E a ef r
I C m eT ia t
t nI y 0 s esL a s nd CI D - - - - O - - - oa1
C i o nA t r eF a zL cf i
i o tA f iIi s CC
E s t eP l ol rS o ni. o
o m i
e d nh 0 7 8 8 tf e ec uoe SS - - - - 1 0 0 0 - n pirs dme n
bl an5me o1 uv ei
I na rtI I n r aaV, I oet Ct.
) V I V, h. Ss 1 e 4, I dt . yr I V 4, c I V eI, I, sm H. anu e I I i Io n V I S V. f Di
- V, aoP ah o I 6 & I f I I B r * rfE *V( Z I I 1 I I I O I I I "
-
..
-_-
-
-
_
_
-
_
--
_
_
__
__
___
___

, se ~
.
4
,
Appendix B
SPECIAL FACILITIES
(Later)
.
4
$
t
e

_ _ _
.. , _ . . _ . , , . __ . . . - - ' - ' '
.'
~
o
9
TABLE B-1FORT ST. VRAIN STATION
SPECIAL FACILITIESWITHIN 10 MILES OF TIIE STATION
Est.No. of Fao1111ty
Map Haalaus Starr/ Student Mob 111:stionID Des 1 dents Vehicles Time Greater ThanCosaun it y No.e Sector Name of Facility Address Students Available 20 Min.**Gilcrest 1 VII C11 crest Sr. High School 504 40 Buses
125 Students2 VII C11 crest Eles. School 167 40 Starr3 VII C11erest Sr. Citizens Center 35
Platteville 4 IV Platteville Eles. School 293 6 Buses25 Starr
5 IV Platteville Middle School 3426 IV Snoopy's Day Care 13 47 IV Platteville Nursing Home 3
Fredertok 8 II Frederick Elee. School 735 to Buses 4580 Staff100 Student
9 II Frederick Sr. High School 512Mead 10 II Head Eles. School 336 7 Buses
36 Starr11 II Mead Jr. H!sh School 197 1 Bus, 1 Van,
12 Cars12 II Countef View Carte Nursing 85
HomeMilliken 13 I Milliken Eless. School 256
14 I Milliken Middle School 24215 I Milliken Sr. Citizens Center 20
Johnstom 16 I Johnsto m Eles. School 321 For Milliken &Johnstown Schools,'
6 Buses each17 I Johnstown High School 299 65 Start
60 Students18 I Johnstom Sr. Cittsens Center 3519 II Barbour Ponds State 575 No Transportation
Recreation Area Ave 11able

- _ _ - . _ _ _ _ _ _ _ _ _ _ . _ _ _ _ _ _ _ _ _ . _ .
~ '~ ' ' ' - - ~- , _._._ _.. , ,
!=
.
.
f:=,
,
Firestone 20 II Tri City Sr. Citizen Center 30 20 CarsDracono 21 II Carbon Yalley Day Cam Center 40 -
* Refers *o Figure 2-1seMobilisation of 20 minutes is based on " Evacuation Analysis Indian Point Site": New York State Office of DiasterPreparedness, New York State Department of Health, May 1976. The time to mobilise also assumes buses or automobiles arereadily available for evaluation.
.I
,
e
e
|
-

,..o
.
Table B-2
SPECIAL FACILITIES
Names and Locations,
(later)
?
l
t !
1!
l!
i
|
|I
I
|
|
|