prepared for the world bank -waves by the centre for ... · prepared for the world bank -waves ....
TRANSCRIPT
The Global Partnership for Wealth Accounting and Valuation of Ecosystem Services (WAVES)
Report of the Botswana Preparation Phase
May 2012
Prepared for the World Bank -WAVES
by the
Centre for Applied Research and Econsult

Final Report WAVES Botswana Preparation Phase
2 | P a g e
Contents List of Tables ........................................................................................................................................................... 3 List of Figures .......................................................................................................................................................... 3
Abbreviations .......................................................................................................................................................... 4
Executive summary ................................................................................................................................................. 5
1 Introduction ................................................................................................................................................ 11
1.1 The WAVES programme in Botswana and study objectives ............................................................... 11
1.2 Macroeconomic background .............................................................................................................. 12
1.2.1 Economic structure and growth ................................................................................................. 12
1.2.2 Impact of the global financial and economic crisis..................................................................... 13
1.2.3 Major macroeconomic issues ..................................................................................................... 14
1.3 Brief environmental and natural resource assessment ...................................................................... 16
1.4 Vision 2016 and Development Planning process ................................................................................ 18
1.4.1 National development planning ................................................................................................. 18
1.4.2 Millennium Development Goals (MDGs).................................................................................... 20
2 Main policy issues to be addressed by WAVES ........................................................................................... 22
3 Resource data and issues for resource accounting/WAVES ....................................................................... 24
3.1 Ecosystems .......................................................................................................................................... 24
3.1.1 The economic value of the Okavango ........................................................................................ 25
3.1.2 The economic value of the Makgadikgadi Pans ......................................................................... 26
3.2 Water resources .................................................................................................................................. 28
3.3 Land resources .................................................................................................................................... 29
3.4 Energy resources ................................................................................................................................. 31
3.5 Mineral resources ............................................................................................................................... 32
3.6 Tourism ............................................................................................................................................... 33
4 Review of existing Natural Resource Accounting in Botswana ................................................................... 33
4.1 Past NRA activities in Botswana .......................................................................................................... 34
4.1.1 Water accounts .......................................................................................................................... 34
4.1.2 Livestock accounts ...................................................................................................................... 35
4.1.3 Mineral accounts ........................................................................................................................ 36
4.2 Macroeconomic data availability for Natural Resource Accounting ................................................... 37
5 Opportunities for WAVES activities ............................................................................................................ 41
5.1 Introduction ........................................................................................................................................ 42
5.2 Water resources activities ................................................................................................................... 43
5.3 Mineral resources activities ................................................................................................................ 44
5.3 Ecosystems, livelihoods, tourism and other land -related activities .................................................. 45
5.4 Energy resources ................................................................................................................................. 47
References ............................................................................................................................................................ 48
Appendix A: Land resources and sector assessment ............................................................................................ 49
Appendix B: Water resources & sector review ..................................................................................................... 53

Final Report WAVES Botswana Preparation Phase
3 | P a g e
Appendix C: Energy resources .............................................................................................................................. 61
Appendix D: Mineral resources sector ................................................................................................................. 70
Appendix E: Tourism resources and sector .......................................................................................................... 77
List of Tables Table 1: Key environmental issues in Botswana ................................................................................... 17 Table 2: Goals of and progress with NDP 10 implementation .............................................................. 19 Table 3: Botswana’s progress with the Millennium Development Goals ............................................. 20 Table 4: Direct use values associated with agricultural activities in the Okavango Ramsar site ......... 25 Table 5: Indirect use values of the Okavango Ramsar site and the Delta (2005) ................................. 26 Table 6: Indirect use value of the Makgadikgadi wetland area (2010)................................................. 27 Table 7: Structure and status of Botswana’s water accounts ............................................................... 34 Table 8: National Accounts sector categories ....................................................................................... 38 Table 9: Summary of macroeconomic data quality .............................................................................. 41 Table 11: Size of the two major ecosystems in Botswana (km2) .......................................................... 49 Table 12: Land uses and zones .............................................................................................................. 50 Table 13: Botswana's major dams ........................................................................................................ 54 Table 14: Water consumption by sector (1990-2003; Mm3 )................................................................ 55 Table 15: Details of the existing water laws in Botswana..................................................................... 56 Table 16: Total Primary energy supply in kilo tons of oil equivalent (2007 and 2008) ........................ 62 Table 17: Estimated Botswana Coal Inventory (million tons) ............................................................... 62 Table 18: Proportion of households in urban and rural areas by energy source for lighting ............... 64 Table 19: Proportion of households by primary energy source for cooking ........................................ 64 Table 20: Estimates of Tourism Contribution to GDP ........................................................................... 81
List of Figures Figure 1: Comparison of diamond output growth rates ....................................................................... 39 Figure 2: Wastewater supply to WWTWs (1990-2003; Mm3 ) .............................................................. 55 Figure 3: Primary energy supply by source; % (2007 and 2008) ........................................................... 63 Figure 4: Net energy supply by source; % (2007 and 2008) ................................................................. 63 Figure 5: Final energy consumption by sector; 1981, 1991, 2001 and 2008 (%) .................................. 65 Figure 6: Projected diamond output to 2031 ....................................................................................... 70 Figure 7: Sustainable Budget Index ....................................................................................................... 74 Figure 8: Accumulated mineral revenues & public investment ............................................................ 75 Figure 9: Tourism arrivals ...................................................................................................................... 77 Figure 10: International tourist arrivals by purpose, 2005 ................................................................... 78 Figure 11: Comparison of Tourism Expenditure with Travel Services Exports ..................................... 78 Figure 12: Breakdown of Tourism Expenditure .................................................................................... 79 Figure 13: Botswana Tourism Employment (‘000 jobs) ........................................................................ 81
Final Report WAVES Botswana Preparation Phase
4 | P a g e
Abbreviations BNWMP Botswana National Water Master Plan BPC Botswana Power Corporation BoB Bank of Botswana BOTASH Botswana Ash BURS Botswana Unified Revenue Service CAR Centre for Applied Research CBNRM Community Based Natural Resources Management CBO Community Based Organisation CSO Central Statistics Office (now Statistics-Botswana) CPA Cattle Post Area DAP Department of Animal Production DEA Department of Environmental Affairs DENA Department of Energy Affairs DoM Department of Mines DWA Department of Water Affairs EA Energy Accounts E&O Errors & Omissions FDI Foreign Direct Investment GFS Government Finance Statistics GDP Gross Domestic Product GFS Government Finance Statistics GHG Green House Gasses GoB Government of Botswana HDI Human Development Index IMF International Monetary Fund LA Land Accounts MA Mineral Accounts MAD Mineral Affairs Division MDG Millennium Development Goals MEWT Ministry of Environment, Wildlife & Tourism MFDP Ministry of Finance & Development Planning MoA Ministry of Agriculture MTR Mid Term Review NDP/DDP National/District Development Plan NGO Non-Government Organisation NWMP National Water Master Plan PA Protected Area PEI Poverty & Environment Initiative PPP Purchase Power Parity SADC Southern African Development Community SB Statistics Botswana SDR Special Drawing Rights TA Tourism Accounts TFP Total Factor Production TSA Tourism Satellite Account UNSO United Nations Statistical Office VGA Village Grazing Area WA Water Accounts WAB Water Apportionment Board WAVES Wealth Accounting and Valuation of Ecosystem Services WMA Wildlife Management Area WTTC World Travel & Tourism Council WUC Water Utilities Corporation WWTW Wastewater Treatment Works
Final Report WAVES Botswana Preparation Phase
5 | P a g e
Executive summary The process of developing wealth accounting and the valuation of natural resources and ecosystems is particularly important in Botswana, given the specific characteristics of the economy and the country more generally. The economy is heavily dependent upon mining; has a shortage of water; faces some crucial decisions regarding the choice of energy mix, including the potential exploitation of large-scale coal resources; has to manage competing demands for land, often involving fragile ecosystems; and sees the development of new mining activities, new agricultural activities and tourism as important components of economic diversification. All of these issues require a wide range of information, both to ensure that decisions are taken that are in the overall national interest – especially where public and private costs and benefits may diverge – and to ensure that changes in national wealth and income are properly accounted for. Sustained development (a major development planning objective) cannot be measured by traditional economic measures such as per capita income. Maintaining resource stocks (quality and quantity), wise use of mineral revenues and increasing the efficiency of natural resource use are needed to sustain economic growth and diversification and therefore need to be measured too. Wealth accounting and valuation of ecosystem services are important tools to support the policy direction of sustainable development and a green economy. This has been recognised in the Gaborone Declaration, resulting from the Summit for Sustainability in Africa, which was signed by ten African countries1 and twenty support institutions, including leading international enterprise as well as UNEP, Government of Norway and IUCN. Accounting for natural (and social) capital was prioritised in this declaration. Consequently, the Botswana WAVES project phase 2 is timely and should support on-going policy initiatives, nationally and internationally. The WAVES scoping study aimed to identify the most important resources, the interest in and the data base for the development of resources accounts, and in the process four main policy messages emerged that are outlined below:
a. Is Botswana’s economic growth path sustainable on the long term? How can this be measured and what adjustments may be needed in the economy?
b. Which energy mix is needed to support economic growth and diversification, given the domestic coal reserves and the significant potential of renewable resources such as solar power?
c. How should the limited water resources be used to sustain economic growth and diversification as well as poverty eradication? Is there a risk that water resources will curb future growth? Which adjustments in water allocation and use efficiency are needed to avoid shortages and facilitate growth?
d. How can proper use and management of ecosystems and land contribute to long term growth, diversification and poverty alleviation? For example, how is tourism be best developed to diversify the economy and eradicate poverty?
While resource accounting is becoming an international commitment, Botswana is advised (like other countries) to implement the System of Environment-Economic Accounting (SEEA) incrementally, starting with the most relevant resources and accounts in terms of policy priorities and data availability. 1 Botswana, Liberia, Namibia, Tanzania, Kenya, Mozambique, Gabon, South Africa, Rwanda and Ghana

Final Report WAVES Botswana Preparation Phase
6 | P a g e
Water resources management
Botswana’s domestic water resources are limited and the country will increasingly rely on the use of shared water resources and increasing water use efficiency. While shared river basin organisations are working on strategic action plans, access to and use of shared water remain uncertain. Water efficiency has not received the attention that it deserves in the past, but efforts to promote integrated water resources management are now actively pursued. Government needs to avoid at all costs a future with insufficient water for economic growth and improved living standards. This requires tough decisions regarding water allocations to different economic sectors (e.g. agriculture, manufacturing, mining and/ or service industry). Given its new resource management mandate, DWA appears the appropriate host institution, but the new institutional structure is yet to be finalised. Botswana has constructed water accounts in the past, showing trends in use (groundwater, surface water and wastewater) as well as the efficiency of use of different economic sectors. However, the accounts are not regularly up-dated and did not sufficiently penetrate water resources management and planning. Construction and regular updating of water accounts and rigorous analysis of the results and their policy implications (e.g. for the MTR and NDP11) are essential and WAVES phase 2 seek to deliver insights in water efficiency, water stocks and trends in water use. The following is recommended for WAVES phase 2:
1. Given its mandate of resource management, it is recommended that DWA hosts the water accounts; the responsible division and staff need to be identified.
2. DWA IWRM needs and priorities will be assessed and reviewed (WA were not covered in the BNWMP2 as should have happened). It is recommended that the BNWMP2, the new (draft) water policy and the country’s IWRM-WE plan (due by the end of 2012), will be used to identify WA needs and priority areas;
3. Review data base and gaps of DWA, WUC and other stakeholders (e.g. mines). The planned DWA data base would assist the construction of WA and vice versa WA could assist the development of a comprehensive water management data base. The institutional reforms should lead to greater data homogeneity and improved data access;
4. Design the required structure for WA (Water Accounts) and identification of priorities for WA development. This activity needs to comprise the review of international WA requirements and best practices (UNSO and SADC), blended with national needs and priorities based on the country’s ‘environment’ and data availability;
5. Training of DWA staff in WA development, including data collection and entry. Once DWA has identified dedicated staff, training needs to be offered in understanding WA and their construction and use;
6. Compilation of the WA by DWA staff with technical assistance and support from WAVES; 7. Policy analysis of the BWA results. It is recommended that DWA will constitute a policy
analysis committee that analyses the WA results in terms of their implications for IWRM (in terms of MTR and IWRM-WE plan) and BNWMP2 implementation; and
8. Incorporation of policy findings in development planning cycle and decision making. The targets will be MTR and the NDP11. This requires that DWA staff involved in the development planning cycle is kept fully informed about WA and its results.
Macroeconomics, minerals and sustainability
On the macroeconomic front, WAVES can help to resolve some key issues relating to savings, investment, growth and incomes that are particularly important in a mineral economy. Mining is by far the largest economic activity in Botswana, accounting for around one-third of GDP and a large proportion of government revenues and exports. One of the most important issues to be addressed
Final Report WAVES Botswana Preparation Phase
7 | P a g e
in a mining economy is to ensure that the apparent “income” that is derived from mineral rents is used to accumulate other assets, whether human capital, economic and social infrastructure, or financial assets. This requires appropriate information to be available within a well-designed structure of public finances relating to both taxation and spending. A second challenge is to maintain adequate mineral resource accounts relating to available reserves, depletion and discoveries. With such information, mineral accounting makes an important contribution to the calculation of appropriate measures of investment and savings (such as adjusted net savings), which take account of the depletion of natural capital. The Botswana economy is characterised by both high levels of inward foreign direct investment and high levels of national investment outside of the country. Both of these need to be taken account of in appropriate measures of macroeconomic activity and growth. Hence WAVES will have as key objectives the calculation of an improved set of macroeconomic indicators, including measures of adjusted net savings, net investment, and net national income. Such calculations involve both macroeconomic data and inputs from sectoral activities – in fact all of the sectoral activities under WAVES will provide important inputs to these indicators. . Another important component of the WAVES project is to establish the infrastructure for accurate mineral accounting. This will involve identifying the extent of existing data availability, developing data collection where new data are required, establishing the capacity to collect, process and analyse data within official structures, including relevant staff training; and the publication of updated and expanded mineral accounts. It is intended that this will provide inputs into official policy making processes in the mid-term review of National Development Plan 10 (NDP 10) and the formulation of NDP 11. Botswana’s diamond resources have been the key driver of economic growth over the past four decades but are being depleted and, on the basis of current reserve estimates, are expected to be depleted by 2030. This reinforces the importance of properly valuing and accounting for a diminishing, non-renewable resource. But it also raises other issues, including the need for economic diversification, which is an essential component of creating employment and poverty alleviation. It is anticipated that the development of new or expanded mining operations in respect of other minerals – notably copper, nickel, and coal and coal-bed methane – will play an increasingly important role in the economy. Hence the winding down of diamond mining will not mean that mineral accounting issues become less important, but the nature of that analysis and the data requirements will change.
The following activities are recommended with respect to Sustainable Development (SD) for WAVES Phase 2
a. Rapid assessment of international SD indicators and best practices; b. Recommendations for a limited number of Botswana-SD indicators, which will be reviewed
at a stakeholder workshop; c. Construction of SD indicators: d. Indicator analysis for follow ups of Rio+20 and for the Botswana Mid-Term Review
(2012/3); e. Regular up-dating of the SD indicators to be included in the State of Nation analysis and
budget speech; and f. Engage with Vision 2016 performance review process with a view to including SD
indicators. A further set of (related) activities is recommended for the mineral sector:

Final Report WAVES Botswana Preparation Phase
8 | P a g e
a. Surveying existing data availability and identifying data gaps. b. Updating economic rent calculations, as far as possible, on the basis of existing data c. Building institutional support for the development of mineral resource accounting d. Assessing priorities and developing a framework for mineral resource accounting e. Identifying the resources needed to fill the data gaps, and helping to mobilise for the
provision of those resources. This may include identifying and extracting unused data from existing data sources and surveys, identifying how to upgrade existing data collection exercises, and identifying the resources needed to meaningfully analyse data and publish the results.
f. Training staff in the Mineral Affairs Department (MAD) and Statistics Botswana (SB) to compile mineral resource accounts.
g. Compile first set of mineral resource accounts. h. Publishing expanded and updated mineral resource accounts i. Analysing the accounts, developing policy implications and providing feedback to relevant
ministries j. Extending the analysis and policy implications to provide inputs to NDP11.
Land and ecosystems management
Ecosystems and land resources underpin economic development together with water resources. Therefore, productive and efficient ecosystems and land resource use and management must underpin future economic growth and diversification. Communal land resources are important to eradicate poverty and lack of investment and productivity in communal areas has been a major cause of poverty. It is timely that ecosystems and land resources should be revisited to boost economic growth and diversification. The growth of the tourism sector is a good example of successful ecosystem and land-based diversification and growth (albeit the impacts on rural livelihoods and poverty are less evident). Ecosystem and land accounts provide a framework for integration of other resource accounts such as water, mineral, wildlife, livestock and energy accounts). Recently, valuations have been carried out in the past for the Okavango Delta and the Makgadikgadi wetland. These studies showed the high value of direct and indirect land and ecosystem uses. They also showed the importance of multiple direct uses, including crop and livestock production but also tourism, mining and harvesting of veld products. The loss of ecosystem services would adversely affect the potential for economic growth and diversification as well as poverty eradication efforts. It is therefore important that the values of the most important ecosystems are estimated and understood. LAs are important as optimal land use is essential for future economic growth, development and increased welfare. The past decades have shown that agricultural land productivity is low and stagnant and that other sectors and land uses have a higher productivity and growth potential. Multi land use and more diverse land uses (in addition to traditional agriculture) are therefore vital to the country’s future. Land Boards and the Departments of Lands and Town and Regional Planning are key institutions in land use planning and management. To-date they have however shown little interest in the construction of land accounts (as shown during the first WAVES stakeholder workshop). Therefore, the development of land accounts cannot take place immediately. The first steps would be to review experiences from other countries with land accounts and to review the proposed UNSO method.

Final Report WAVES Botswana Preparation Phase
9 | P a g e
The following activities are recommended for WAVES phase 2: 1. Review previous ecosystem valuation studies (Okavango, Makgadikgadi and Protected Areas); 2. Liaise with BioChobe preparation study (2012) to determine ecosystem valuation needs to be
carried out by WAVES in additional to the BioChobe project; 3. Review of existing tourism data, surveys and satellite accounts; 4. Valuation of Chobe area (in consultation with and depending on the needs of the BioChobe
project) 5. Design of land account framework; 6. Collect data for the land accounts; 7. Collect additional data through tourism expenditures and enterprise surveys; 8. Enter data for land accounts; 9. Policy analysis and implementation recommendations for accounts for NDP11; and 10. Training and awareness raising workshop
Energy resources management
Given available domestic resources (coal and solar power), Botswana’s energy mix is likely to change substantially. In the past, most of Botswana’s electricity demand has been met by imports from South Africa, but in future more supply will come from domestic resources, in the short-term from coal-fired power stations. It is also possible that there will be substantial coal-fired power generated for export to the region, and/or that coal will be exported to other parts of the world for energy generation. At the same time, large-scale generation of solar power may become economically viable. All of these energy sources have substantial environmental impacts, whether positive or negative, from a national, regional and global perspective. Because of these environmental impacts, public and private costs and benefits may differ substantially. Hence a proper accounting for these wider costs and benefits is important from the perspective of public policy decision-making. Although coal and solar power are likely to become more important as energy sources, other forms of energy are widely used. WAVES will therefore include the compilation of energy accounts. This will involve assessing the types of energy resources to be considered, identifying gaps in the data, and designing a structure for the accounts. Once capacity building needs have been identified, training will be conducted on the framework adopted, data collection, entry and analysis, presentation of the findings and how they can be utilized. Over time, the accounts will be extended, published and analysed from a policy perspective, with a view to providing inputs into NDP 11. The following activities are recommended for WAVES Phase II:
a. Development of interest among the Department of Energy Affairs (DENA) and relevant stakeholders such as Botswana Power Corporation (BPC) and Department of Transport. This would establish the activity needs of the sector, identify the role they could play in the process of developing energy accounts and commitment to the process beyond 2015;
b. Baseline assessment of energy resources data from the DENA and identifying gaps. This would also include assessing the type of energy resources to be considered;
c. Assessment of priorities for the sector and develop a framework to be adopted for the energy accounts. This process should also be a collaboration of WAVES and DENA;
d. Design the structure for energy accounts e. Assessment of capacity needs and identifying relevant dedicated staff within the DENA that
require training. These would be trained on the framework adopted, data collection, entry, analysis, presentation of the findings and how they can be utilized.
f. Identification of energy pricing issues and long-term economic costs and benefits

Final Report WAVES Botswana Preparation Phase
10 | P a g e
g. Data collection of data by each energy resource. This would lead to development of energy accounts for the available energy resources. This process will be driven by the department with technical support from WAVES.
h. Publishing the accounts and analysis for policy implications. This should result in the preparation of a policy brief.
i. Update and further analysis of the accounts for input into NDP 11.

Final Report WAVES Botswana Preparation Phase
11 | P a g e
1 Introduction
1.1 The WAVES programme in Botswana and study objectives
The overall objective of the Partnership on Wealth Accounting and Valuation of Ecosystem Services (WAVES) is to promote sustainable development worldwide through the implementation of environmental accounting that focuses on integrating the value of natural capital into development strategies, policies and investment decisions (World Bank, 2011). Botswana is one of several pilot countries to participate in WAVES. The WAVES project is carried out in two phases. Phase 1 (February to December 2011) is the preparation phase during when introductory workshops and a scoping study take place in each country. For Botswana, the result should be an agreed WAVES-Botswana work plan for the second project phase (implementation). Phase 2 (2012 – 2015) is the implementation phase during which environmental accounting and related activities will be implemented.
The overall objective of phase 1 is to assess the feasibility for environmental accounting in pilot countries and lay the groundwork for implementation, including a detailed work plan. This involves establishing appropriate institutions to lead the work (in the case of Botswana, the PEI National Steering Committee and the Ministry of Finance and Development Planning have been chosen as the the lead agency); identifying links to key management and policy decisions (e.g. Mid Term Review of NDP10 and preparation for NDP11); and assessing the data availability and data gaps for ecosystem services. Critical parts of the scoping study are:
a. A comprehensive review of all available data in order to identify where progress can be made most rapidly, where the most serious data gaps are, and how they can be overcome;
b. Identification of the ways in which environmental accounting can contribute to policy and management decisions.
During the scoping phase, consultations were held with key resource persons and through two workshops to assess the needs for various resource accounts, the capacity to develop and maintain the accounts, and the key entry points for the results into policy development and management decisions. The macro-economic and environmental context of Botswana is provided in the remainder of chapter 1 together with a brief review of Vision 2016 and the Millennium Development Goals. The assessment of data and data issues is summarised in chapter 2, which also includes a brief presentation of two economic valuation studies of precious ecosystems (Okavango and the Makgadikgadi). Past NRA activities in Botswana are presented and analysed in chapter 3 together with an assessment of the macro-economic data availability. Chapter 4 contains the proposed work plan for the WAVES phase 2: implementation. Detailed assessment of different resources and sectors are contained in the appendices. The WAVES scoping study aimed to identify the most important resources, the interest in and the data base for the development of resources accounts, and in the process four main policy messages emerged that are outlined below:
Final Report WAVES Botswana Preparation Phase
12 | P a g e
a. Is Botswana’s economic growth path sustainable on the long term? How can this be measured and what adjustments may be needed in the economy?
b. Which energy mix is needed to support economic growth and diversification, given the domestic coal reserves and the significant potential of renewable resources such as solar power?
c. How should the limited water resources be used to sustain economic growth and diversification as well as poverty eradication? Is there a risk that water resources will curb future growth? Which adjustments in water allocation and use efficiency are needed to avoid shortages and facilitate growth?
d. How can proper use and management of ecosystems and land contribute to long term growth, diversification and poverty alleviation? For example, how can tourism be developed to diversify the economy and eradicate poverty?
These main policy messages features throughout the report but are (again) explicitly discussed in chapter 4, where the planned activities are discussed. While resource accounting is becoming an international commitment, Botswana is advised (like other countries) to implement the System of Environment-Economic Accounting (SEEA) incrementally, starting with the most relevant resources and accounts in terms of policy priorities and data availability.
1.2 Macroeconomic background
1.2.1 Economic structure and growth Botswana has an excellent reputation for its economic performance. Between Independence in 1966 and the mid-1990s, Botswana was the fastest-growing economy in the world, with average annual GDP growth rates of over 10%, faster than the better-known “tiger” economies of South East Asia. This prolonged growth took Botswana from being one of the poorest countries in the world in 1966 to middle-income status by the 1990s. Per capita income is now around US$7,600, the fourth highest in sub-Saharan Africa after the Seychelles, Equatorial Guinea and Gabon. This rapid growth has been built upon the foundation of the diamond mining industry, which since its commencement in the early 1970s, took Botswana to being the largest producer of diamonds, by value, in the world. Most of Botswana’s diamond mines are operated by Debswana in a 50-50 joint venture between the Botswana Government and De Beers (most recently Anglo American). Diamond mining has been highly profitable, and revenues have provided the basis for rapidly growing exports, balance of payments surpluses, and government revenues that have been used to finance broad-based development expenditures. The allocation of revenues and profits between the Government and De Beers is determined on the basis of long-term agreements that run in parallel with the 25-year mining leases for the Debswana mines. Following the most recent negotiations for the renewal of the Jwaneng mining licence, the Government secured a significant increase in its share of the profits from Debswana’s diamond mines and the right to market a share of its diamonds directly. Diamond mining is the largest single contributor to gross domestic product (GDP), and the mining sector as a whole accounts for 31% of economic output. The government is the second largest sector of the economy, after mining, and is the largest single employer. Government spending is, however, largely dependent upon mineral revenues. Other important (large or fast-growing) sectors include trade & tourism, transport & communications, and finance & business services.

Final Report WAVES Botswana Preparation Phase
13 | P a g e
Although Botswana has had a fast growing economy, the period of rapid diamond-led growth is over, and since the mid-1990s economic growth rates have been lower, although still respectable by international standards, with trend growth around 5-6% p.a. The International Monetary Fund (IMF) forecasts growth rates of 6%-7% for 2011 and 2012 and slower growth of 4 to 5% for 2014-2016, while Government forecasts around 7% growth in 2011-12, driven by continued mining sector recovery and power sector investments. The main objectives of fiscal policy have been to i. maintain a sustainable, balanced budget; ii. ensure that revenues from diamonds are invested in improving social and economic infrastructure that will provide the basis for diversified sources of future economic growth; and iii. accumulate surplus mineral revenues as financial assets. For long periods of time this has been achieved, and government ran budget surpluses and accumulated substantial savings. In the late 1990s and early 2000s the budget came under pressure, however, and there were several deficit budgets, resulting from the strength of the Pula against the US dollar in 2002-4 and additional expenditure demands, notably those related to HIV/AIDS. The budget situation improved in 2007 and 2008 as a result of higher mineral revenues following the 2004 and 2005 devaluations, and the 2006 budget saw the introduction of a new “fiscal rule”, whereby government committed to maintain expenditure within a ceiling of 40% of GDP, in an attempt to contain spending pressures. However, the sharp reduction in earnings from diamonds in 2009 pushed the budget into substantial deficit, which is expected to persist until 2012. The impact of the dramatic turnaround in the fiscal situation was to deplete much of the financial surpluses that government had accumulated over the years and, for the first time, to take on substantial external debt. Exports are dominated by diamonds and other minerals, which account for around 85% of the total. Imports are more diversified. Over the years, Botswana has run balance of payments surpluses and accumulated significant foreign exchange reserves. This has enabled the maintenance of a managed exchange rate, whereby its currency the Pula is pegged to a currency basket (comprising the South African Rand and the special drawing rights SDR) and adjusted according to a crawling peg regime. The managed exchange rate has enabled Botswana to avoid some of the worst “Dutch Disease” effects that often afflict mineral producing economies through exchange rate overvaluation. Despite the good macroeconomic growth record, Botswana has been less successful at creating jobs. As at 2010 there were around 330 000 formal sector jobs, and a further 250 000 people employed in the informal sector and traditional agriculture, out of a labour force estimated at 710 000, giving an unemployment rate of 18%2. The rate of job creation, especially in the formal sector, has generally lagged behind the economic growth rate and new entries into the labour market. The poverty rate, while high for a middle-income country, shows signs of improvement. In 2002/3 the headcount poverty rate was 31%, while by 2009/10 this had fallen to 21%.
1.2.2 Impact of the global financial and economic crisis
Like all countries, Botswana was negatively affected by the global financial and economic crisis of 2007-9. The main impact was through the international trade effects, with Botswana’s major exports (diamonds, copper/nickel and tourism) badly affected by the recession in developed economies.
2 Results of the Botswana Core Welfare indicators Survey, 2009/10 (Statistics Botswana, 2011). Other official surveys,
however, give higher unemployment rates of between 25% and 30%.

Final Report WAVES Botswana Preparation Phase
14 | P a g e
However, Botswana escaped any major financial sector problems as the banking sector remained profitable and well-capitalised. In addition, Botswana is not dependent upon inflows of foreign capital to finance the budget or the balance of payments, and was therefore less affected by reduced cross-border capital flows. As a result of the global economic crisis, mining of diamonds was cut back in 2009, which pushed the economy into recession in 2009 (with a decline in GDP of 5%). Reduced export earnings caused the balance of payments to deteriorate and required a drawdown of the foreign exchange reserves in order to finance imports. Reduced government revenues from the mineral sector led to large budget deficits, financed by a combination of borrowing and drawdown of savings. The savings and foreign exchange reserves accumulated from years of reasonably prudent policies enabled Botswana to withstand these challenges quite well. Continued government spending during the crisis provided a fiscal stimulus that boosted domestic demand, and provided the non-mining sector with some cushion against international developments. The recovery in commodity prices (for diamonds, copper and nickel) in 2010 along with increased diamond production boosted the mining sector, and GDP growth showed a healthy recovery to 7%. Nevertheless, the crisis highlighted some of the challenges facing policymakers. Diamond exports are not expected to return to the peak levels of 2007 until 2012, and substantial investments are required to extend the life of the main diamond mines. The long-term fiscal impact on Botswana will be reduced government spending and a renewed focus on policy reform in order to boost economic growth. Many years of successful development have been slowed by the economic crises.
1.2.3. Major macroeconomic issues Botswana faces two major macroeconomic issues: diversifying the economy, in order to reduce unemployment and develop new sources of growth for when diamonds run out, and sustainable public finances. A third important concern of poverty and unemployment is closely related to economic diversification. Diversification
Over the past two decades there has been much emphasis on diversifying the economy “beyond and away from dependence upon diamonds”, through stimulating new sources of economic activity and growth that can take the economy forward in the coming decades. There are several reasons for the emphasis on diversification: a. Diamond production has peaked, and is unlikely to contribute significantly to future economic
growth3; b. A high level of dependence upon a single commodity increases vulnerability to volatile
commodity prices and markets; c. The diamond mining industry is capital intensive, and creates limited employment opportunities.
With stubbornly high unemployment in Botswana, job creation is a major priority; d. New sources of government revenues and exports have to be found to reduce mineral
dependency. It was initially anticipated that export-led manufacturing would be the main driver of diversification, and the manufacturing sector was supported with special incentives in the form of tax concessions and subsidies. However, this has not proven to be particularly successful, and although 3 Current levels of diamond production can be maintained for another 15 years or so on the basis of known deposits, but thereafter
production will begin to decline rapidly. Although new diamond deposits have been discovered and new mines are likely to open, they are relatively small compared to the existing mines
Final Report WAVES Botswana Preparation Phase
15 | P a g e
manufacturing has enjoyed periods of steady growth, there have also been reversals and its share of GDP has remained below 5%. Many of the enterprises set up as a result of targeted incentives proved to be unsustainable. The broad idea of export-led diversification remains important. Botswana has no choice but to diversify if income and employment growth are to be sustained in the face of slowing growth of diamond revenues. Diversification has to be export-led; while it is the case that any dynamic and growing economy has to be increasingly integrated with the global economy, it is particularly important for those, like Botswana, with small domestic markets. Diversification is now seen as resulting from the growth of a range of economic activities that can take the economy beyond diamond dependency, rather than from one single sector that can alone take over from diamonds as the engine of growth. Activities that are now seen as potential candidates for such growth include financial and business services, tourism, as well as some manufacturing (e.g. solar power and water conservation technologies) and agricultural activities. It is also recognised that diversification within the mining sector is an important part of the broader diversification process, as new and expanded mining activities help to supplement diamond mining. The policy framework therefore focuses on establishing conditions that support investment across a broad range of economic activities (although specific tax incentives for manufacturing and certain financial services remain). This involves enhancing the overall investment climate, improving competitiveness and productivity, and boosting institutional efficiency. The policy framework also envisages a central role for Foreign Direct Investment (FDI), at the same time as strengthening the ability of citizens to participate fully in the economy.
Sustainable public finances
Government has made substantial efforts to maintain a sustainable budget, through controlling expenditure and diversifying revenue sources. However, Government is heavily dependent on external revenue sources (diamond exports and customs) and is attempting to diversify and build up the domestic tax base, notably by strengthening tax collections. Mining’s contribution to government revenue has declined over the years, while others such as value added tax and income tax have substantially grown. Although the global crisis caused a fiscal problem, the biggest fiscal challenge stems from adverse medium-term revenue trends. As the economy diversifies away from the highly-taxed (and profitable) diamond sector towards other less highly-taxed (and less profitable) activities, the average tax take will inevitably decline. In the long term, resources from diamonds will decline and government expenditure will need to be reduced significantly as a proportion of GDP and the private sector will need to reduce its current dependence on government spending. This implies reducing the relative size of the public sector wage bill, and rationalisation of public spending to focus on areas with identifiable economic benefits and greater efficiency in social spending. As a result, difficult expenditure choices and trade-offs need to be made in the coming years, if budget stability is to be maintained. Poverty and unemployment Unemployment, poverty and inequality are important socio-economic issues in Botswana. Like many mineral producing economies, a capital-intensive mining-led growth model has lagged on employment creation. Between 1994 and 2010, formal employment increased at only 2.4% a year, while real GDP grew by 5.7% a year on average. This is particularly problematic given the age

Final Report WAVES Botswana Preparation Phase
16 | P a g e
structure of the population, which is heavily biased towards young adults and those of secondary school age. In recent years, job creation has averaged around 9 000 jobs a year, compared with an estimated 30 000 net new entrants to the labour force each year. The employment problem is compounded by a weak and slow growing and often stagnant agricultural sector. Although considerable numbers of people are engaged in traditional agriculture, productivity is very poor and as a result incomes are low. As a result of high unemployment and the weak rural economy, Botswana has had persistently high poverty rates for an upper-middle income economy, along with one of the highest levels of income inequality in the world. There are clear contrasts between urban and rural areas, with relatively low poverty and unemployment in the urban areas, much higher in the rural areas, and hence inequality between the two. However, recent poverty data indicate that the overall poverty rate has declined between 2002/3 and 2009/10, with much steeper reductions in rural poverty. It is not clear what is driving this, as only preliminary figures have been released, but if confirmed this is likely to indicate a lessening of inequality at the national level. Nevertheless, unemployment and poverty remain pressing issues, and addressing the challenge of economic diversification and higher, sustainable economic growth rates is integrally tied up with addressing employment creation. Employment creation is, in turn, the main way to further reduce poverty, along with well-designed social safety nets and measures to encourage sustainable economic growth in the rural areas.
1.3 Brief environmental and natural resource assessment The country’s environment has previously been described in 1986 (Profile of Environment and Development; Arntzen and Veenendaal, 1986) and 2002 (State of the Environment report; MEWT, 2002). The National Development Plans also contain brief environmental descriptions. The forthcoming Human Development Report Botswana also provides an environmental assessment and most recently the World Bank (2010a) produced a policy note on environmental mainstreaming in development planning. The brief assessment below is based on the above sources. Botswana is a landlocked country situated in the centre of southern Africa, sharing borders with South Africa (to the south and east), Namibia (west), Zimbabwe and Zambia (north). Botswana has large land, mineral and wildlife resources. Surface and ground water resources are scarce. The climate is largely arid to semi-arid characterised by hot and dry conditions. Rainfall is highly erratic and unevenly distributed and varies between 250mm in the extreme south-west to 650mm in the north. Daily temperatures range from 320C to 420C in extreme cases while the mean temperature is 180C. Sunshine is abundant, offering excellent opportunities for solar power applications. The country is prone to drought and is likely to be adversely affected by climate change (e.g. more droughts and floods). Climate change will add to existing stresses on water resources, primary land productivity, and sectors such as crop and livestock production as well as tourism (World Bank, 2010b). Health and food security are also likely to be adversely affected without timely adaptations. Botswana has a land area is 581 730km2 and a human population of just over 2million (2011 Population Census). Consequently, population density is low (3.5person/km2). The primary productivity of land resources is low due to semi-arid conditions and low soil fertility. Agricultural land, particularly in communal areas, is generally underutilised due to lack of investments and low input production strategies. More than half of the country is covered by the Kalahari Desert sands (so-called sandveld), and is not suitable for crop production. Large areas of land have been subject to

Final Report WAVES Botswana Preparation Phase
17 | P a g e
environmental degradation, particularly those located on the periphery of settlements and around boreholes and cattle posts. Botswana has rich wildlife and wilderness resources, particularly in western and northern Botswana. Wildlife resources are the back bone of the rapidly growing tourism industry, particularly around the Okavango Delta, Chobe and Makgadikgadi. A large part of the land resources is protected area PAs designated for wildlife and biodiversity conservation (19%) and wildlife management areas or WMAs (sustainable use and conservation (17%). While elephant numbers have rapidly expanded over the last decades, numbers of other species are stable or have recently declined. Management of the wildlife resources is critical for biodiversity conservation, tourism development and economic growth. The country possesses rich mineral deposits, which have long provided the basis of economic growth. Currently, exploration is on-going for other minerals, including uranium. Abstraction of a wider range of mineral in future is likely. Until now, only a fraction of the country’s abundant coal resources is used for domestic electricity generation. However, a number of plans have recently been mooted to mine coal for export of coal and electricity. Such plans raise pollution and GHG emission concerns. Water resources are very limited and are expected to constrain future economic growth if the limited resources are not efficiently used. Several dams are currently under construction but further new large supply schemes are linked to international rivers such as the Limpopo, Okavango, Orange, and Zambezi Rivers; utilisation of water from these rivers is subject to SADC rules and agreements with other riparian countries. Water constraints make integrated water resource management and allocative efficiency critical for future economic development. Botswana has unique ecosystems such as the Okavango Delta, the Makgadikgadi salt pans, the Chobe River front and the wilderness of the Kalahari ‘desert’. These are important assets for tourism and economic diversification. Environmental management and sustainability are central to many key development issues such as the exploitation of mineral resources, the use and re-use of scarce water resources, and the development of the cattle industry and arable agriculture. Environmental sustainability is particularly important in ensuring the future viability of various economic activities which could increase access to income especially in the rural areas hence improving livelihoods and contributing to poverty eradication. Key environmental and resource issues are summarised in Table 1.
Table 1: Key environmental issues in Botswana
Resource component Key issues Water • Water scarcity due to limited ground and surface water resources;
• Groundwater is the major source but largely under growing pressure hence its protection and management is essential;
• Surface water sources are mostly shared with other countries; • Contamination of aquifers and boreholes, high salinity and presence of
aquatic weeds thus affecting water quality; Land • Unproductive use of the land resource;
• Encroachment, degradation and depletion of woodland resources; • Restrictions on land use (zones)-laws and policies reduce optimal use
of land; • Lack of a land policy;
Biodiversity • Declining wildlife numbers mostly due to illegal hunting, drought and

Final Report WAVES Botswana Preparation Phase
18 | P a g e
habitat fragmentation and destruction; • Biodiversity threat and losses due to natural and human induced
activities such as climate change, population pressure, veld fires and land tenure;
Energy • Limited use of renewable energy sources; • Inadequate security and reliability of power supply to all end users; • Overharvesting of fuel wood.
Pollution and waste • indiscriminate and illegal waste disposal; • GHG emissions and pollution by coal consumption; • lack of facilities for disposal of toxic waste; • Limited waste recycling ;
1.4 Vision 2016 and Development Planning process
1.4.1 National development planning Botswana has a long-standing tradition of economic planning for development. National Development Plans (NDPs) and related District Development Plans (DDPs) provide the overall framework for the development of Botswana’s economy. NDPs (the current being NDP10) guide the programmes of public expenditure on recurrent and development projects, based on macroeconomic projections and estimated government revenue. Sustained development, rapid economic growth, economic independence and social justice are the planning objectives which have been pursued throughout the NDPs 1-10. The preparation of the NDP is guided by a multi-sectoral reference group, comprising of representatives from government ministries, NGOs and the private sector. After being approved by Cabinet, the NDP is presented to Parliament. Once approved by Parliament, the NDP provides the legal framework for public spending, and projects can only be financed if they have been included in the NDP. Annual Budgets authorise the actual spending on both recurrent and development programmes. Each NDP is subject to a mid-term review (MTR), which can lead to changes in projects and budgets in response to changing circumstances or prioritisation. Historically, NDPs have been organised on a ministerial basis. However, the approach was changed in NDP10, which was organised around the Vision 2016 Pillars (Table 2). Although the NDP process has served the country well, it is showing its age. A detailed review of the Public Expenditure framework, which has the NDPs at its core, carried out by the World Bank (2010c) concluded that the system needed fundamental overhaul4.
4 World Bank (2010) Botswana Public Expenditure Review, Report No. 53959-BW (May)
Final Report WAVES Botswana Preparation Phase
19 | P a g e
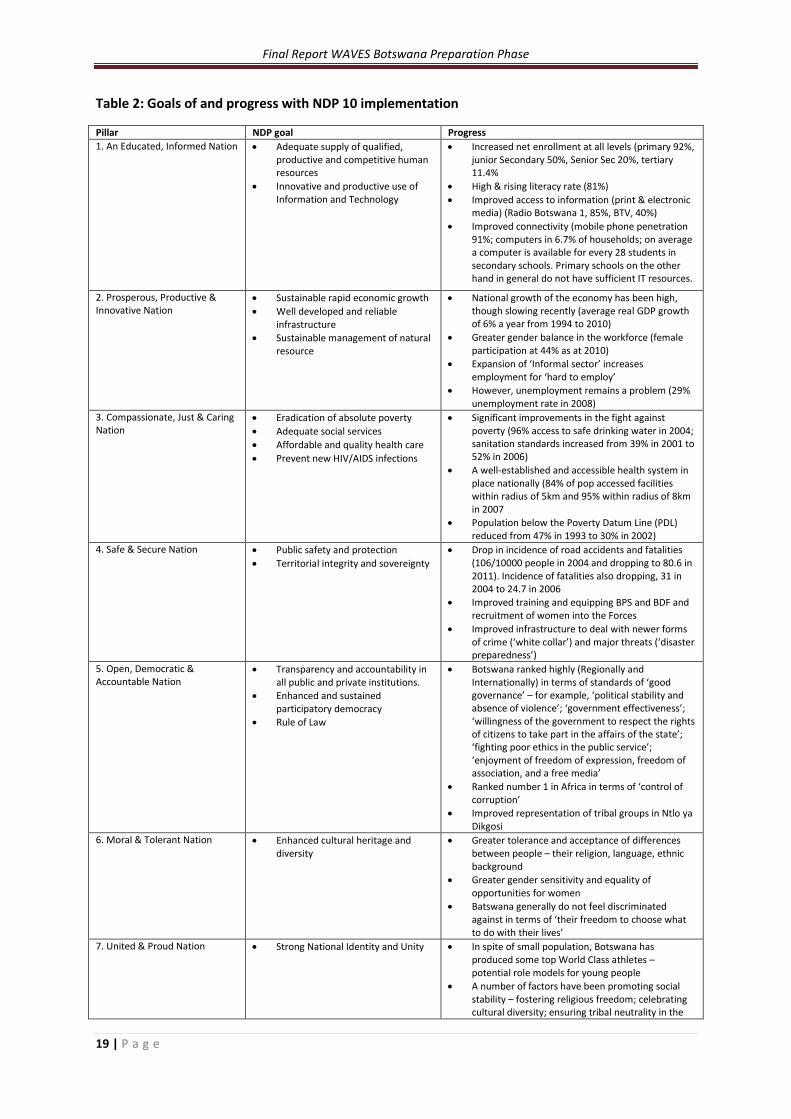
Table 2: Goals of and progress with NDP 10 implementation
Pillar NDP goal Progress 1. An Educated, Informed Nation
• Adequate supply of qualified, productive and competitive human resources
• Innovative and productive use of Information and Technology
• Increased net enrollment at all levels (primary 92%, junior Secondary 50%, Senior Sec 20%, tertiary 11.4%
• High & rising literacy rate (81%) • Improved access to information (print & electronic
media) (Radio Botswana 1, 85%, BTV, 40%) • Improved connectivity (mobile phone penetration
91%; computers in 6.7% of households; on average a computer is available for every 28 students in secondary schools. Primary schools on the other hand in general do not have sufficient IT resources.
2. Prosperous, Productive & Innovative Nation
• Sustainable rapid economic growth • Well developed and reliable
infrastructure • Sustainable management of natural
resource
• National growth of the economy has been high, though slowing recently (average real GDP growth of 6% a year from 1994 to 2010)
• Greater gender balance in the workforce (female participation at 44% as at 2010)
• Expansion of ‘Informal sector’ increases employment for ‘hard to employ’
• However, unemployment remains a problem (29% unemployment rate in 2008)
3. Compassionate, Just & Caring Nation
• Eradication of absolute poverty • Adequate social services • Affordable and quality health care • Prevent new HIV/AIDS infections
• Significant improvements in the fight against poverty (96% access to safe drinking water in 2004; sanitation standards increased from 39% in 2001 to 52% in 2006)
• A well-established and accessible health system in place nationally (84% of pop accessed facilities within radius of 5km and 95% within radius of 8km in 2007
• Population below the Poverty Datum Line (PDL) reduced from 47% in 1993 to 30% in 2002)
4. Safe & Secure Nation
• Public safety and protection • Territorial integrity and sovereignty
• Drop in incidence of road accidents and fatalities (106/10000 people in 2004 and dropping to 80.6 in 2011). Incidence of fatalities also dropping, 31 in 2004 to 24.7 in 2006
• Improved training and equipping BPS and BDF and recruitment of women into the Forces
• Improved infrastructure to deal with newer forms of crime (‘white collar’) and major threats (‘disaster preparedness’)
5. Open, Democratic & Accountable Nation
• Transparency and accountability in all public and private institutions.
• Enhanced and sustained participatory democracy
• Rule of Law
• Botswana ranked highly (Regionally and Internationally) in terms of standards of ‘good governance’ – for example, ‘political stability and absence of violence’; ‘government effectiveness’; ‘willingness of the government to respect the rights of citizens to take part in the affairs of the state’; ‘fighting poor ethics in the public service’; ‘enjoyment of freedom of expression, freedom of association, and a free media’
• Ranked number 1 in Africa in terms of ‘control of corruption’
• Improved representation of tribal groups in Ntlo ya Dikgosi
6. Moral & Tolerant Nation
• Enhanced cultural heritage and diversity
• Greater tolerance and acceptance of differences between people – their religion, language, ethnic background
• Greater gender sensitivity and equality of opportunities for women
• Batswana generally do not feel discriminated against in terms of ‘their freedom to choose what to do with their lives’
7. United & Proud Nation
• Strong National Identity and Unity • In spite of small population, Botswana has produced some top World Class athletes – potential role models for young people
• A number of factors have been promoting social stability – fostering religious freedom; celebrating cultural diversity; ensuring tribal neutrality in the
Final Report WAVES Botswana Preparation Phase
20 | P a g e
Constitution; etc. • Incidence of teenage childbearing steadily dropping
(though factors in addition to ‘responsible parenting’ could also be a factor)
Source: adapted from Vision Council 2009 Performance report.
Vision 2016 represents Botswana’s strategy to achieve socio-economic and political development that will transform the country into a competitive, winning and prosperous nation. The Vision encompasses eight pillars (Table 2). NDP10 represents the blueprint of the National Vision, outlining the policies and key programmes aimed at achieving the Vision 2016 objectives during 2009-2016. Table 2 also shows progress towards achieving these goals; however most data is from 2006-2011. Overall, there has been considerable progress with respect to many of the Vision objectives. However, the core economic objectives have not been achieved with respect to sustainable, rapid economic growth, and there remain many challenges with regard to economic diversification and employment creation. The economy remains highly dependent upon minerals and government, and with the likelihood that mineral revenues will drop off sharply between 2025 and 2030, it will be necessary to generate new sources of growth and to downsize government and make it consistent with lower revenue levels.
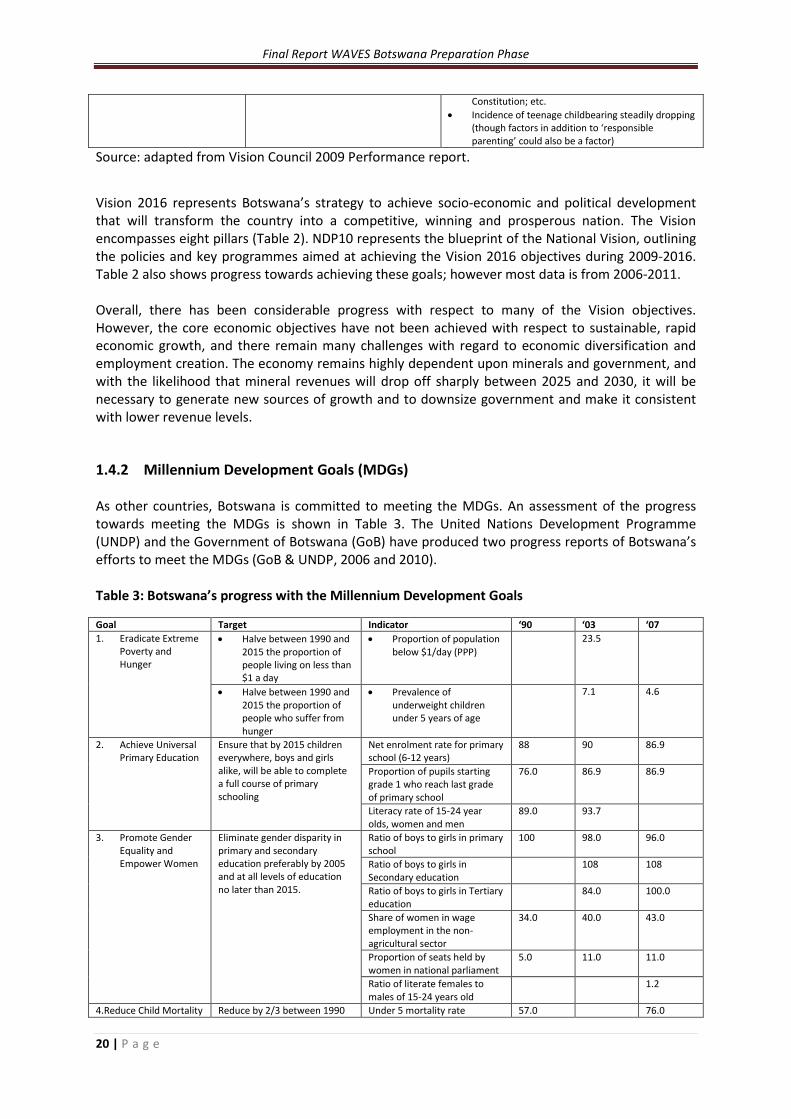
1.4.2 Millennium Development Goals (MDGs) As other countries, Botswana is committed to meeting the MDGs. An assessment of the progress towards meeting the MDGs is shown in Table 3. The United Nations Development Programme (UNDP) and the Government of Botswana (GoB) have produced two progress reports of Botswana’s efforts to meet the MDGs (GoB & UNDP, 2006 and 2010). Table 3: Botswana’s progress with the Millennium Development Goals
Goal Target Indicator ‘90 ‘03 ‘07 1. Eradicate Extreme
Poverty and Hunger
• Halve between 1990 and 2015 the proportion of people living on less than $1 a day
• Proportion of population below $1/day (PPP)
23.5
• Halve between 1990 and 2015 the proportion of people who suffer from hunger
• Prevalence of underweight children under 5 years of age
7.1 4.6
2. Achieve Universal Primary Education
Ensure that by 2015 children everywhere, boys and girls alike, will be able to complete a full course of primary schooling
Net enrolment rate for primary school (6-12 years)
88 90 86.9
Proportion of pupils starting grade 1 who reach last grade of primary school
76.0 86.9 86.9
Literacy rate of 15-24 year olds, women and men
89.0 93.7
3. Promote Gender Equality and Empower Women
Eliminate gender disparity in primary and secondary education preferably by 2005 and at all levels of education no later than 2015.
Ratio of boys to girls in primary school
100 98.0 96.0
Ratio of boys to girls in Secondary education
108 108
Ratio of boys to girls in Tertiary education
84.0 100.0
Share of women in wage employment in the non-agricultural sector
34.0 40.0 43.0
Proportion of seats held by women in national parliament
5.0 11.0 11.0
Ratio of literate females to males of 15-24 years old
1.2
4.Reduce Child Mortality Reduce by 2/3 between 1990 Under 5 mortality rate 57.0 76.0

Final Report WAVES Botswana Preparation Phase
21 | P a g e
and 2015 the under 5 mortality Infant mortality rate (1000 births)
48.0 57.0
Proportion of 1 year old children immunized against measles
45.0 90.0
5. Improve Maternal health
Reduce by ¾ the maternal mortality ratio
Proportion of births attended by skilled health personnel
77 96.1 94.6
6. Combat HIV and AIDS, Malaria and other disease
Have halted by 2015 and begun to reverse the spread of HIV/AIDS
HIV prevalence among among 15-19 year old pregnant women
22.8 17.2
HIV prevalence among 20-24 year old pregnant women
36.8 31.2
Contraceptive prevalence rate of all women aged 14-49 years
40.0 52.8
Have halted by 2015 and begun to reverse the incidence of malaria and other major diseases
Prevalence rate associated with tuberculosis
0.6
Proportion of TB cases detected and cured under Directly Observed Treatment Short Course
35.0 50.0
7.Ensure Environmental Sustainability
Halve the proportion of people without access to safe drinking water and basic sanitation
Access to improved water source (% of population)
93.0 95.8
Access to improved sanitation (% of population)
38.0 79.8
Integrate the principles of sustainable development into country policies and programmes and reverse the loss of environmental resources
Forest area (% of total land area)
24.0 21.0 21.0
National protected area (% of total land area)
30.9
CO2 emissions (metric tons per capita)
2.0 2.0 2.4
GDP/unit of energy use (constant 2005 PPP $per kg of Oil equivalent)
7.3 11.7
8. Develop a Global Partnership for Development
Develop further an environment conducive for beneficial trade and foreign direct investment
Net ODA received (% GNI) 4.0 0.0 1.0
Debt service as a percentage of export of goods and services
4.0 1.0 1.0
Telephones line (per 100 people
2.0 7.0 7.0
Mobile cellular subscribers (100 people)
0.0 25.0 77.0
Internet use (per 100 people) 0.0 3.0 5.0
Sources: GoB & UNDP, 2010. There has been progress with respect to the objective of “halving poverty between 1990 and 2015”, although the measure used in the MDG assessment (% of the population under the $-a-day poverty line at purchasing power parity or PPP) is not well tracked in Botswana, which uses a domestic Poverty Datum Line (PDL) measure. There is a danger, however, that progress will be disrupted by global economic developments. The global recession of 2008-9 caused major problems for diamond exports, leading to job cuts and squeezed real incomes, and any repetition would affect the affordability of social safety nets that make an important contribution to poverty alleviation. Primary education enrolment is high but has fallen slightly between 1990 and 2007 after a peak in 2003. This is surprising given that government expenditure in education on all levels has been going up since 1990. Contrary to declining enrolment rates, students who complete primary education have gone up. There has been a strong movement for empowering the ‘girl child’ in schools and women’s empowerment in work places. While enrolment of girls in different levels of education has gone up there are still some concerns with lower graduating levels with are often associated with pregnancy drop outs and society expectations. Female participation in the labour force continues to rise steadily

Final Report WAVES Botswana Preparation Phase
22 | P a g e
There has been substantial investment in the health system of Botswana. Much of the increased budget has been directed towards combating HIV/AIDS. However, there are some discrepancies in data on prevalence rates, for instance between government and UN figures; this in turn makes gauging success on three of the indicators dealing with child mortality & maternal health and HIV/Aids & other diseases quite difficult. Nevertheless, it is evident that there remain major problems with regard to high level of child and maternal mortality. Environmental sustainability has always been on the agenda of the Government of Botswana. Since 1990 there has been an improvement in access to clean and safe water. The Review of the National Water Master Plan (or NWMP2; SMEC et. al., 2006)) recommended a major restructuring of the water sector which includes, amongst others, the separation of water resources management from water service delivery. The process is underway and should lead to better and efficient delivery of water around the country. While Botswana is very active in climate change negotiations and the fight against climate change, Botswana’s position could be severely affected by the numerous coal mines that are the pipeline. Lastly, Botswana is doing well in improving and making new partnerships. Though in the MDG report Botswana is doing well in providing a conducive environment for businesses, other international organizations such as the World Bank would argue this given the Doing Business report where Botswana’s rank has been going down showing that Botswana is becoming less attractive to international investors when compared to other countries.
2 Main policy issues to be addressed by WAVES Future population and economic growth will pose more pressure on Botswana’s natural resources and ecosystems. Optimal and efficient use of the limited natural resources is therefore critical for future development and economic diversification, particularly with respect of land resources, energy and minerals and water resources. Inefficient and sub-optimal resource use will constrain economic growth, livelihood improvements and poverty eradication. Botswana has an opportunity to develop a niche for a green economy by emphasising eco-friendly livestock production, ecotourism, water saving technologies/ industry, and renewable energy sources such as solar power. Water resources management Water resources will become increasingly scarce in future due to increasing demands and resource limits. The use and proper management of shared water resources such as the Chobe and Limpopo will become vital in future. It is imperative that water resources are used sustainably in support of future economic growth and diversification as well as further poverty eradication. Questions need to be posed and answered such as how much water can be earmarked for each sector, should diversification towards water intensive sectors such as irrigation and some mining be encouraged or instead should diversification promote water extensive sectors (e.g. the service sector). If Botswana obtains abstraction rights from shared waters such as the Chobe, how can this water be best utilised to support economic growth and diversification? How can water efficiency of each sector be increased and how can wastewater re-use be accelerated? How should the burden of rising supply and treatment costs be divided over government, the private sector and households? Can government afford to pay most costs? These strategic questions are currently rarely asked and WAVES should contribute towards answers.

Final Report WAVES Botswana Preparation Phase
23 | P a g e
Macro economic performance and mining Botswana’s period of diamond-led growth is coming to an end and diversification of the economy away is (and has been) a key economic objective for some time. On the basis of current information, existing diamond deposits are likely to be largely exhausted between 2025 and 2030, and as a result a major source of current national income and fiscal revenues will be substantially reduced. The development of new economic activities is therefore essential in order to promote future economic growth and increased real incomes, the generation of jobs and the reduction of unemployment, and hence in achieving a meaningful reduction in poverty. Ensuring the proper accounting and valuation of economic activities is crucial from a policy perspective, perhaps more so in Botswana than in some other economies. The fact that a high proportion of national income has historically been derived from a non-renewable mineral resource means that proper wealth accounting should be an important input into macroeconomic planning decisions, and that the depletion of diamond and other mineral resources is properly accounted for. This need will remain even as diamond deposits are exhausted, because it is likely that the diversification of the minerals sector will play an important role in the broader process of economic diversification. The exploitation of known deposits of copper, nickel and other base metals, along with coal and coal-bed methane is already being planned. Hence properly accounting for mining activities will remain an important planning tool. Energy Mix A second dimension is that Botswana’s energy mix is likely to change substantially. In the past, most of Botswana’s electricity demand has been met by imports from South Africa, but in future more supply will come from domestic resources, in the short-term from coal-fired power stations. It is also possible that there will be substantial coal-fired power generated for export to the region, and/or that coal will be exported to other parts of the world for energy generation. At the same time, large-scale generation of solar power may become economically viable. All of these energy sources have substantial environmental impacts, whether positive or negative, from a national, regional and global perspective. Because of these environmental impacts, public and private costs and benefits may differ substantially. Hence a proper accounting for these wider costs and benefits is important from the perspective of public policy decision-making. Many of these activities also have substantial implications for the sustainable use of water resources, which also need to be properly accounted for from a public policy perspective and also to create appropriate incentives for private sector investment decisions. Tourism is already playing an important role in economic diversification, employment creation and poverty reduction, and it is important to have a proper understanding of these impacts as well as future potential, and again to ensure that both public and private sector decision making is undertaken on the basis of appropriate information and valuations. The Botswana economy is characterised by both high levels of inward foreign direct investment and high levels of national investment outside of the country. Both of these need to be taken account of in appropriate measures of macroeconomic activity and growth Ecosystems and land resources Botswana is endowed with unique and diverse ecosystems such as the Okavango, the Chobe area and the Kalahari ‘desert’. However, large parts of its land resources are (semi-)arid and characterised by low primary productivity. This is enhanced by the fact that capital investments in large tracts of communal areas are low due to the dominance of subsistence land users, land degradation and administrative inefficiencies (e.g. Land Boards). Agricultural stagnation (both arable and livestock production) has further contributed to low land productivity. Climate change may increase aridity

Final Report WAVES Botswana Preparation Phase
24 | P a g e
through higher temperatures and evaporation and make productivity more variable due to increased droughts and floods. It has been traditionally assumed that livestock production has a comparative advantage throughout the country. The emergence of the tourism sector has shown that tourist returns may be higher in western and northern Botswana and in specific area (e.g. Tswapong hills). The problem is however that tourism benefits do not sufficiently trickle down to the rural population and their livelihoods. Consequently, rural households often perceive agriculture to be more beneficial than tourism. It is in Botswana’s interest to recognise the value of special ecosystems and to encourage the best land use(s) in each part of the country. How can land productivity (value added/ha) be increased (e.g. through tourism, livestock or veld products or through multiple, non-conflicting, land uses)? How can land use benefits for the rural population be increased (e.g. CBNRM)? What is the value of ecosystem services (biodiversity, groundwater recharge, carbon sequestration, water purification, etc.) and which values are threatened by land degradation? These strategic issues and questions need to be explored by WAVES in support of economic growth, diversification and poverty eradication.
3 Resource data and issues for resource accounting/WAVES This chapter reviews the available data and data issues for a variety of natural resources and economic activities, including water, energy, land, tourism and minerals. During a preliminary scoping exercise, it was agreed that WAVES should focus on these resources5 during phase 1 (and 2). First however, economic valuations of two important ecosystems are reviewed.
3.1 Ecosystems Country wide general data are available for different vegetation systems or zones. Specific ecosystems data are only available for the Okavango Delta (mostly through the Okavango Delta Management Plan and BiOkavango) and for the Makgadikgadi Wetlands (through the Makgadikgadi Framework Management Plan). The reports and data can be downloaded from www.mewt.gov.bw and www.car.org.bw). The Revised Biodiversity Strategy and Action Plan (MEWT, 2007) distinguishes seven eco-regions6 and provides general information about species richness index sets for the country and eco-regions. Valuation studies have been carried out for the Okavango Delta and RAMSAR site (Turpie et. al., 2006) and for the Makgadikgadi Wetland (Arntzen et. al., 2010). Because of the restricted scope and means of the projects, both studies were restricted to measuring use values (direct and indirect). The option and existence values were only qualitatively explored. The indirect use values covered some regulatory and support services but did not measure ecosystem services separately. Cultural, aesthetic and general biodiversity services were not covered. Therefore, the obtained values must be considered under estimates and do not systematically and explicitly cover ecosystem services (World Bank, 2011). Given the nature of the past valuation studies, it is recommended that WAVES Phase 2 will make an attempt to more comprehensively value an important ecosystem, including most ecosystem services. Valuation of the Chobe area is recommended as this high value ecosystem lacks integrated
5 Botswana’s natural resource base is wider and includes fish and forests but these resources were considered less
important for WAVES at this moment. They will, however, feature in the ecosystem assessment. 6 Southwest Botswana, central and western sandveld, north east hardveld, Makgadikgadi, Okavango Delta, the Delta
surroundings and Chobe

Final Report WAVES Botswana Preparation Phase
25 | P a g e
planning (e.g. there is no integrated land use plan) and competition for water and land resources is mounting. Policy decisions regarding the Chobe area need to be informed by valuation data to ensure that vital ecosystem services are not put at risk. It must be realised that it is often hard to value all ecosystem services due to data limitations (World Bank, 2011). WAVES phase 2 would closely collaborate with the BioChobe project that is currently being formulated.
3.1.1 The economic value of the Okavango For the Okavango wetland, the economic value was assessed of the delta and surrounding areas, i.e. RAMSAR site (Turpie et. al., 2006)). The economic valuation included a quantitative assessment of the direct and indirect use values and a qualitative assessment of the option value. The Ramsar site was divided into five zones taking into consideration the natural resources and land use characteristics as well as settlement patterns. These zones include the Panhandle, the west, the southwest, southeast and the central (Turpie, et. al. 2006; DEA, 2008). A variety of methods were used to determine use values, including enterprise models, focus group discussions, data transfer methods and a direct use survey (430 households in 12 villages). The choice of method was, among others, determined by the time requirements and financial means. The total net private values of agricultural activities amount to BWP68 million while only 3% of these are attributable to the wetland. Their contribution to GDP was about BWP43 million and BWP1.5 million of this accrues to the wetland. The value of agricultural activities are summarised in Table 4.
Table 4: Private and economic direct use values associated with agricultural activities in the Okavango Ramsar site (2005)
Gross private value
Net private value
Cash income Gross output Gross value added
Ramsar site Crops ,629,992 6,389,500 10,161,293 9,030,989 2,768,553
Livestock 79,246,782 61,165,831 43,606,492 83,209,121 39,757,628 Total Ramsar 87,876,774 67,555,331 53,767,785 92,240,110 42,526,181 Wetland Crops 1,132,456 942,410 96,983 1,189,173 588,568 Livestock ,604,947 ,205,482 91,050 1,685,195 869,980 Total Wetland 2,737,403 ,147,892 488,033 2,874,368 1,458,548 Source: Turpie et al., 2006
Interestingly, non-agricultural use of natural resources (firewood, vegetables, grasses etc.) generates a direct net value of BWP27 million and a gross value added of BWP29 million. About 37% of the value derived by households accrues to direct wetland use. However, tourism generates the highest direct use value to the national economy. Of all the direct use values of the Ramsar site, tourism fares high generating a direct gross income of about BWP 1 115 million and a substantial direct value added to the GNP (BWP 401 million). Photographic tourism operators account for 81% of the total value while 15.5 and 3.5% accrues to hunting safari companies and CBOs respectively. The study demonstrates the importance of indirect use value of the Okavango (Table 5). The indirect use value, which was estimated at BWP230million for the Ramsar site, exceeds all direct use values except for tourism.

Final Report WAVES Botswana Preparation Phase
26 | P a g e
Table 5: Estimated indirect use values (BWP million) of the Okavango Ramsar site and the delta (2005)
Service Wetland Rest of Ramsar Entire Ramsar site
Groundwater recharge 16 0 16 Carbon sequestration 86 72 158 Wildlife Refuge 77 0 77 Water Purification 2.2 0 2.2 Scientific and educational value 18 6 24 Total 199.2 31 230.2 Area 28 782km2 26 765km2 55 547km2
Average per ha BWP 69 BWP 29 BWP 41 Source: Turpie et al., 2006
3.1.2 The economic value of the Makgadikgadi Pans
The Makgadikgadi Framework Management Plan (MFMP) (DEA and CAR, 2010) was developed so as to enhance the sustainable utilisation, conservation and the coordinated management of the Okavango Makgadikgadi wetland and associated areas. As part of the plan, an economic valuation of the Makgadikgadi was considered to be a vital component for planners and decision-makers to demonstrate the value of the wetland’s goods and services. The assessment was confined to use, non-use and option values. The latter was however only explored qualitatively. The study area was divided into two zones (north and south) for the estimation of direct use values. Direct uses were confined to agriculture, harvesting of natural resources, tourism and mining. Livestock production is most important to the communities living in and around the wetland area. It generates a net private value of BWP 15.4 million per annum and gross value added of BWP 10.7 million. The value per household is significant and is just under BWP 2 000. In terms of crop production, dry land farming is commonly practiced but households along the Boteti River and in areas that are seasonally flooded undertake molapo farming. Crop farming generates a net private value of BWP 19 million directly to farmers, while it contributes a gross value added of BWP 14.7 million to GNP. There is a wide range of ‘veld products’7 in the area and these include grasses, mophane worms, firewood, wild foods, medicinal plants, salt, palm leaves, wild birds, timber and poles. Availability of the products and their harvesting differs spatially, for instance, fishing is mostly practiced in the northern part of the Makgadikgadi while harvesting of grass is common in all the zones. The latter is commonly used for thatching, fencing and making traditional brooms. Grasses are harvested mainly for utilisation in the household while some 45% is mainly sold to outsiders. Harvesting of grasses accrues a net private value of BWP 32 million and gross value added of BWP 34 million to national income. Wild fruits and vegetables generate an estimated net private value of BWP 29 million while firewood resources are worth an estimated net private value of BWP2.7 million and contribute BWP 3.6 million to national income. Furthermore, mophane worms which are utilised both for subsistence and commercial purposes generate a net private value of BWP10 million while their contribution to GNP is significant (BWP11 million per annum). Therefore, overall harvesting and use
7 The term ‘veld products’ refers to harvested components of vegetation, often referred to in other parts of
the world as minor forest or rangeland products.

Final Report WAVES Botswana Preparation Phase
27 | P a g e
of natural resources in the Makgadikgadi are is worth BWP141 million in terms of net private income while contribution to national economy is slightly lower at BWP107 million in gross value added. Tourism in the Makgadikgadi is reliant upon nature-based activities such as wildlife viewing, wilderness experiences and safari hunting. It directly contributes some BWP55 million to GNP and a large portion of this is accounted for by game lodges and camps while safari hunting and serviced hotels contribute 22 and 13% respectively. When effects of lateral and backward linkages from tourism activities are taken into consideration, tourism contribute BWP 227 million to the national economy. A total of eight Community-Based Natural Resources Management (CBNRM) projects exist in the area, of which only three are fully operational. CBNRM projects have the potential to be financially and economically viable in the area but they need further development to achieve that. A community based organisation (CBO) in the Makgadikgadi area can generate a ten year financial internal rate of return of 10% on overall investment. However, currently communities benefit greatly from subsidies by government and donors. The net income for communities is on average BWP 227 000 per CBO while the direct value added to national economy is BWP 990 000. When considering backward linkages, CBNRM generates an added value of BWP 1.8 million to the economy. Soda ash mining is carried out in Sua town, generating a direct value of BWP 190 million to GNP with a wage bill of some BWP 99 million. The company Botash employed around 440 people and with a multiplier factor of 2.46 and backward linkages, the value of mining activities on the GNP was estimated at BWP 467 million. The values of five indirect uses of the Makgadikgadi wetland were estimated as part of the study (carbon sequestration, wildlife refuge, groundwater recharge, water purification and scientific & educational value). The estimated values are indicated in Table 6. The overall indirect use value of the Makgadikgadi is estimated at BWP155.4 million ranging between BWP73.6 million and BWP253.4 million per annum. Carbon sequestration accounts for the largest portion of the indirect use value of the Makgadikgadi (more than 80%). Table 6: Estimated indirect use value of the Makgadikgadi wetland area (BWP; 2010) Category Best estimate Low estimate High estimate 1. Wildlife refuge 1a. hunting 3 070 200 1 541 600 4 598 800 1b. ecotourism 2 849 000 712 300 6 410 300 2. Carbon sequestration 136 451 100 60 000 600 229 351 500 3. Groundwater recharge 10 800 000 9 100 000 10 800 000 4. Science and education 2 256 900 2 256 900 2 256 900 5. Water purification 0 0 0 Total indirect use value (BWP) 155 427 200 73 611 400 253 417 441 Source: DEA and CAR, 2010 It appears mining and harvesting of natural resources is most important for livelihoods followed by crop and livestock production. Assuming that the Makgadikgadi area has around 7 000 households, the monthly household value is estimated to be around BWP 2 347, including cash and in kind livelihood sources. At the national economy level, mining and tourism generate the highest value. Tourism becomes more important when backward linkages are considered. The indirect use value is significant at 43% of the direct economic use value and 78% of the livelihood value. This calls for enhanced sustainable resource use and management in-order to sustain the resource base and improve livelihoods.

Final Report WAVES Botswana Preparation Phase
28 | P a g e
3.2 Water resources
Botswana is part of several, mostly transboundary river basins: Limpopo in the east, Orange in the extreme south, Okavango and Chobe (north) and the Nata/ Makgadikgadi (north-east). Information on surface water storage is only available for WUC dams. No records are kept for other dams (e.g. private and agricultural dams). WUC dam data are limited. While dam levels are recorded, direct inflows, evaporation and sedimentation are not monitored. Data on groundwater resources are available from the 2006 Review of the NWMP (SMEC et. al., 2006) and from well field monitoring (WELLMON) data base, a DWA operated groundwater monitoring system recording groundwater levels. Recharge is not exactly measured and the abstractable amount of groundwater stored in operational well fields is not known. The amount of wastewater has rapidly grown but the outflows of wastewater treatment plants are not recorded and has to-date been estimated. There is urgent need to monitor the inflow and outflow of wastewater treatment works (WWTW). Data on water consumption by economic sector is available from WUC and DWA. District Councils did not keep records of water consumption in rural villages. The new country mandate of WUC for water supply should improve data availability in future. The new mandate could also overcome data collection differences between DWA and WUC (e.g. use of different sector classifications). Significant amounts of water are lost between production and consumption. Therefore, three types of data are needed to estimate water use: water productions or abstraction by WUC, water losses/ unaccounted for water and water consumption (billed amounts). Data on revenues and costs are partly available. DWA and WUC revenues are annually recorded together with the operational and maintenance costs. Investment/ capital costs are not systematically kept, particularly by DWA. These are mostly estimated from design studies of well fields and new dams. In brief, the data gaps include:
a. Operation and maintenance costs; capital costs, revenues, water consumption by other villages; However, through the 2006 NWMP, demand forecasts for most villages in the country are available;
b. Capital costs of water supply and reticulation systems for major villages. c. Data on groundwater stocks and abstractions is also limited. There is no comprehensive
information about the total volume of groundwater, e.g. water stored in aquifers and well fields is insufficient. There are no records of village water consumption. The water accounts used the method of per capita water consumption based on population figures and projections (CSO) as well as average per capita daily water use. Data is also available from the Village Water Monitoring project. There is no information about how much water is used for domestic consumption, schools & clinics, offices, local government, livestock water, and other uses. Data on costs and revenues is also not available.
d. Livestock: data on actual water use is not available. However, water use has been estimated (Water Accounts) based on livestock numbers and daily water requirements by livestock species. National livestock numbers are available from the agricultural statistics (1980-2006). There are gaps in some years (1991, 1992, 1994, 2000, 2001 and 2005). Data is also weak on the sources of water for livestock farming. Data is not available for dams constructed by the Ministry of Agriculture.
e. Irrigation: Actual irrigation water use is unknown. Data is needed on the irrigated area, water sources, crops under irrigation and irrigation water use.

Final Report WAVES Botswana Preparation Phase
29 | P a g e
f. Mining: Reported water use from each mine (source: mines and WUC). Water costs can be attained from the mines.
g. Wildlife: National head is known, water requirements by species (literature and CORBWA study) can be attained.
h. Environmental water use is not known. i. Wastewater: gaps in inflows and outflows from the WWTWs, no data on capital costs
and the available operation and maintenance costs are not complete. The Botswana Water Accounting programme was established through the Department of Environmental Affairs (formerly National Conservation Strategy Agency and recently Department of Water Affairs have been involved in the programme. The accounts are available for the period 1990 to 2003 with an inclusion of wastewater resources. Despite this commendable effort, several challenges and data inadequacies were encountered and through WAVES, this could be addressed. The following activities are proposed for WAVES:
1. Update the water accounts Stock and supply accounts:
• Reservoir Inflow and outflows – natural inflows, inflows from other dams and recycled treated wastewater water flows;
• Water losses from the water supply systems; • Dams developed and operated by Ministry of Agriculture should be included in the
accounts; • Surface water stocks. The available stock accounts need to be strengthened. In
addition, accounts for rivers/lakes should be developed and should be separated into domestic and international rivers;
• Groundwater stocks to be expanded to include volumes stored in aquifers and recharge rates should be estimated;
• Wastewater supply accounts (inflows and outflows as well as uses) need to be monitored and updated;
Monetary aspects:
• Capital costs ( reservoirs, groundwater sources, WWTWs) • Recurrent (operations and maintenance)costs and well as wastewater treatment
costs; • Revenues (DWA and WUC)
2. Other accounts
Accounts for Okavango, Chobe or Limpopo rivers. Studies on the Okavango have been conducted (e.g. EPSMO) and some are on-going (Water Audit study). This would produce essential information necessary for development of the accounts.
Given its new mandate of the country’s overall water resource manager, DWA is the natural host of water accounts. The priority for WAVES would be to assist DWA to 1. Annually collect data so as to update and improve the current accounts. 2; build capacity within DWA to a. construct and annually up-date the water accounts; b. Analyse the results and provide inputs into the national development planning process (e.g. MTR). Data for the monetary accounts is crucial.
3.3 Land resources
Data on land characteristics are generally available at the national and district level. This includes aspects such as:
Final Report WAVES Botswana Preparation Phase
30 | P a g e
a. Land tenure and use & zones (agro-climatic, eco regions, veterinary zones); b. Fences; c. Land suitability (e.g. crops and livestock, soils, vegetation, drainage, groundwater potential) d. Land-based assets (e.g. wildlife and borehole distribution)
However, actual land use and rights are often poorly documented. Even though land rights have to be granted by Land Boards (Tribal land) or Department of Lands (State Land), there is no comprehensive data base with land rights for mining, crop production, residential use, tourism and livestock use. Similarly, there are no statistics on value added by sector per unit of land (several research projects have provided some figures for specific areas such as Ngamiland). Several studies have been conducted that show that the returns of livestock vary by management strategy and that in wildlife rich, remote areas returns from tourism are higher than those of livestock production. The market for freehold land is small and transactions are not systematically recorded. Land prices, for example for freehold and leasehold ranches, are high and they usually do not reflect current productivity and economic returns. Market forces operate with tourism concessions, where tendering is required. This has pushed up the price and revenues of tourism concessions, reflecting good returns in tourism and low land rentals previously charged by government. Several data problems occur with land resources. Firstly, the absence of a land registry/ data base makes it difficult to assess land ownership and actual land use. For example, a lot of arable land is allocated but only a small part is annually used. Land repossession on the grounds of non-use of land resources, provided for under the Tribal Land Act, becomes difficult. Secondly, the prevailing implicit assumption is that agriculture is the most suitable form of land use countrywide. This perception is refuted by various land use studies (e.g. Barnes et al., 2001) but the perception is persistent as sectoral value added figures by sector are not regularly calculated. This could be done through land accounts. Thirdly, the land quality and land-based assets are not systematically inventorised. Consequently, loss of productive land potential and sub-optimal land use is prevalent. Land accounts would be instrumental in increasing land productivity as well as in monitoring land quality and addressing land degradation issues. The following issues for WAVES and land resources arise. The key issue is optimising land use by improving land use and allocation. Land needs to be used by the most productive sector and allocated only to those who intend to actually use it productively. Communal land should be re-allocated if owners do not use it. Increasing the land costs through a land charge or by market forces would provide an incentive for productive use. Optimal land use requires close integration of land and water management and planning. Land resources without water cannot be optimally used (and vice versa). Another major land issue is the use of different sectoral district classifications and inadequate integration. This makes it difficult to develop a comprehensive and consistent land data base. There is an urgent need to establish a land rights data base. Finally, changes in land use and land qualities (including land based assets) are not regularly recorded and yet this is vital to assess the productive potential of land and changes in land productivity. Given these data problems, meaningful land accounts cannot be developed immediately. It is recommended that the WAVES implementation starts with the preparation of the grounds for land accounts (LA), and that actual accounts will only be prepared when sufficient land data are collected and computerised to form a solid basis for LAs.
Final Report WAVES Botswana Preparation Phase
31 | P a g e
3.4 Energy resources
The main immediate energy issue at present is electricity shortage due to inadequate domestic capacity and declining imports from South Africa. This is being addressed by the expansion of power plants using coal and diesel and the shortages should become less severe from 2013 onwards. The energy resource has not been adequately assessed, and have not been fully characterised. This has hampered full exploitation of the resources especially with regards to coal. In terms of the energy balances, CSO has compiled energy statistics for the year 1981 to 2003 and 2007-08. Information relates to final and net energy demand and supply in terms of energy source and user sector. Information is comprehensive for electricity. However, the availability and uptake of solar energy are not adequately documented. Moreover, biomass data are lacking. For instance, activities to enhance the availability of fuel wood are not documented hence this hampers information on the resource base. In addition, information on the rate of depletion of fuel wood in Botswana is lacking. There is data on the production of green house gasses (GHG) and related emissions as well as the sources of these emissions. Data is also available on fuel prices and are up to date. It is not known as to whether the information is available in a computerised format. The data referred to above is captured in the statistical reports (SB, Department of Energy Affairs and BPC). Generally, however data for the construction of energy accounts are incomplete.
The World Bank WAVES project can benefit Botswana’s energy sector through the following:
a. Design of and data collection towards energy accounts; b. Development of energy resources accounts;
i. Collection, update and analysis of available data on stocks and flows; ii. Analysis of data on resource availability by source/supply;
iii. Analysis of resource use by sector and the intended purpose; c. The value of energy resources as capital or development assets; d. Assess economic contributions of the sector to the national economy; e. Assessing the sector’s impacts on environmental sustainability. For instance, information on
the GHG emissions could be updated and further assessed in economic terms; f. Impacts of depletion of the resource and costs of abatement. There is therefore need collect
information from various stakeholders involved in mitigation, rehabilitation, and afforestation activities).
However, given the current state of data, preparation of energy accounts will requires through preparation and can at best take place towards the end of WAVES phase 2.
It is important for Botswana to not entirely rely on coal in future as it has a high carbon footprint. The country further needs to develop the potential of renewable energy sources, in particular solar power. Energy accounting could assist with predicting future electricity shortages, optimising energy use mixes and encouraging energy efficiency and fuller exploitation of under-utilised energy resources.

Final Report WAVES Botswana Preparation Phase
32 | P a g e
3.5 Mineral resources
There are insufficient resources available to produce comprehensive mineral accounts in Botswana. These are particularly important due to the prominent role that mineral production plays in the economy, the fact that the mining sector involves the depletion of a non-renewable resource, and the complexities surrounding the taxation of mining activities to ensure an equitable distribution of value between the nation and private investors. Mineral beneficiation and abstraction of a larger variety of minerals make the construction of full mineral accounts more challenging than in the past (when all diamond and copper/nickel produce were exported or in the case of coal domestically used for power generation). The production of full mineral accounts requires data on the stock of mineral assets in the ground, depletion rates and the identification of new resources. The stock of any mineral at the end of a given year depends on the opening stock, depletion of the stock through mining, and additions to the stock through reserve discoveries or identification. Unfortunately only one of these three variables is readily available: annual physical production levels (in carats, tonnes, kilogrammes or cubic metres), which are published for all key minerals in the Annual Reports of the Department of Mines. However, no comprehensive data are published for the stock of mineral reserves or for annual additions, and in general only historical or infrequent data points are available. The situation is particularly important for diamonds, which is by far the most important mineral currently mined in Botswana. The last known public data on the stock of diamonds was in 1999, when the figure was 788 million carats (mcts). Since that time production (to 2010) has amounted to 312mcts, leaving a stock of 455mcts. Although there have been subsequent new discoveries, the value of additional reserves/resources established since that time is unknown. But with production in the region of 30mcts a year, the known stock figures are consistent with a projected end-of-life for Botswana’s existing diamonds mines around 2030. Annual production is therefore consuming a significant proportion of the known reserves. For other minerals, notably copper-nickel, soda ash and salt, and gold, no information is available regarding the size of the reserves, although it is believed that gold reserves are close to depletion, as are some currently mined copper-nickel deposits. For coal, comprehensive reserves data are also missing, but it is understood that current production levels are insignificant relative to reserves, so coal is effectively a non-depleting resource. Moving beyond physical data to economic data regarding minerals, it is important to be able to calculate the economic rent derived from mineral resources. This represents the economic return that is earned from the extraction and sale of a resource over and above the economic cost of production. Although it is a simple concept, calculating it in practice – and hence determining how the rent is shared between the government and mining companies – is not a straightforward task. Essentially it requires data on the gross operating surplus (equivalent to value added, less wage) and capital stock. Neither are published in Botswana. Resource rent calculations were carried out up to 2001, but are not available since. The publication of comprehensive stock data by the Department of Mines, as well as annual adjustments due to new discoveries etc., would be essential in order to produce comprehensive mineral stock accounts. In addition, data would need to be provided on economic values in different mineral sub-sectors (capital stock, operating surplus) to facilitate rent calculations. Data on the uses of mineral revenues through government spending are already reasonably comprehensive, although measures of sustainability in the use of mineral revenues appear to have fallen in to disuse.

Final Report WAVES Botswana Preparation Phase
33 | P a g e
Opportunities for World Bank Waves project lie in the following activities:
a. Developing data templates for the mining sectors to serve as a guideline for data needs for WAVES.
b. Motivating for the production of regularly updated data on stocks of minerals and making them publicly available
c. Motivating for the reintroduction of the Sustainable Budget Index (SBI) or similar indicators and other measures to influence public spending from mineral revenues in a sustainable direction
3.6 Tourism
The tourism sector has been the best example of economic diversification and employment creation. It also has significant environmental and resource implications, with a large of the tourism sector based on natural resources and operating in ecologically fragile rural areas. Tourism may already be making significant contributions to GDP, employment and export earnings. However, there are numerous concerns with tourism data, mostly related to inconsistency and infrequency:
i. The contribution of the tourism sector to GDP is conventionally measured through the Tourism Satellite Account (TSA), following a methodology developed by the World Travel & Tourism Council (WTTC). This divides productive activities in an economy into those producing tourism-specific products (including accommodation services, restaurants, road and air transport services, travel agencies etc.) and non-specific products (all other activities). It then estimates the tourism component of these activities, and derives the total contribution of tourism-related supply and consumption to GDP. However, TSAs are constructed infrequently. There were two separate TSA exercises for Botswana in 2008, and each gave different results.
ii. Data showing that the contribution of tourism to Botswana’s exports has been growing steadily remain poor. Travel exports grew on average by 21% a year over the period from 1992 to 2007, and the balance of payments (BoP) data showed that “travel services” was Botswana’s third largest export in 2007, after diamonds and copper-nickel. However, it has subsequently become clear that there are major problems in the BoP data, which need to be verified.
iii. There is a need to improve the compilation of data on tourism from available data sources, including financial sector transactions, visitor surveys, and information from hotels etc.
There is a potential for World Bank WAVES activity in;
1. Develop indicators for land and tourism in partnership with Botswana Tourism Organisation (BTO), Department of Lands and Department of Tourism;
2. Improving the quality of tourism survey data 3. Improving the links between economic data on the tourism sector and ecological data.
TSAs should be analysed and linked with the national accounts and should be regularly updated. This activity should also be a collaborative effort with Botswana Tourism Organisation (BTO) and Department of Tourism.
4 Review of existing Natural Resource Accounting in Botswana

Final Report WAVES Botswana Preparation Phase
34 | P a g e
4.1 Past NRA activities in Botswana
Botswana’s natural resources accounting (NRA) programme was established more than a decade ago (1998) as a recommendation of the economic review of the National Conservation Strategy Action Plan. The DEA was the lead institution for the Environmental Economics programme which has led to the development of accounts for water, livestock and minerals. This environmental economics programme also involved training, development of case studies and preparations of policy briefs for decision makers. Briefly the NRA programme is discussed below under three sections: Water, Minerals and Livestock accounts. The DEA’s intention was to transfer the responsibilities for the resource accounts at the port folio departments of DWA (water), DoM (minerals) and DAP (livestock). Despite the fact that meetings were held with host ministries/ departments and extensive documentation was prepared (technical notes, policy brief and the account reports), this has not been achieved. As a result, the available accounts are insufficiently used in development planning and resource management and they are not routinely up-dated. Proper institutionalization and capacity building in the host institutions should therefore be important components of WAVES, right from the start of phase 2. An important lesson from the earlier NRA programme is that resource accounts need to be properly institutionalized. The DEA can successfully work as a catalyst for resource accounting, but that this in itself is insufficient to ensure regular up-dating and use in development planning and natural resource management. Another lesson is that projects aimed at development of policy support tools need to be implemented in close partnership with government to ensure sustainability after the projects come to an end.
4.1.1 Water accounts Water accounts have been developed for freshwater resources and wastewater that is treated in WWTWs and cover 1990 to 2003. The accounts include stocks and flows of water resources but monetary accounts have not been developed. Rather, work has been done regarding water use efficiency by economic sectors and this includes employment generated by the use of water, value added per cubic metre of water in different sectors and economic benefits of wastewater re-use and recycling. Table 7 gives details of the scope of the Botswana water accounts. Table 7: Structure and status of Botswana’s water accounts
Account Sub-account State Stock accounts Dams Available for 2001-2003 for WUC dams Groundwater Existing incomplete accounts for operational
well fields Rivers-lakes No accounts; few perennial rivers and lakes Wastewater Developed, but not important given the small
amount of wastewater stored. Flow or use accounts
Institution (DWA, WUC, DC and self providers)
Covers period 1990-2003
Source (ground, dams and rivers) Covers period 1990-2003
Economic sector Covers period 1993-2003 Wastewater accounts
Wastewater supply (by city, town and large village)
Covers period 1990-2003
Wastewater use by economic sector and the environment
Covers period 1990-2003
Source: DEA and CAR, 2006.

Final Report WAVES Botswana Preparation Phase
35 | P a g e
In terms of the methods, the stock accounts for surface water is estimated as: closing volume+ abstraction+ evaporation – opening volume; while for groundwater, the stocks are estimated as opening volumes-abstraction + recharge in well fields and boreholes. Freshwater use account considers water use for different economic activities and for domestic purposes and this has been estimated on the basis of natural and institutional source. For the agricultural sector, water use is estimated by multiplying the number of livestock by the daily water use of cattle, goats and sheep (45, 4.5 and 4.5 litres per day respectively). Water use for the irrigation sector is based on the 1991 water consumption for irrigation provided by the National Water Master Plan of 1991. Regarding domestic use, industry, the service sector and government water consumption, data was attained from WUC and DWA reports and files. The water consumption in other rural villages has been estimated by multiplying the population estimates by village with the average district water consumption in small villages (District Councils do not keep consumption records). With regard to wastewater, the supply account is restricted to wastewater that is returned to WWTW as these flows can be re-used or recycled and can be transferred between economic sectors. This has been developed for individual WWTW and then for the whole country by aggregating the individual WWTWs. In terms of wastewater use, the data from the National Asset Register (NAR) was used and also relied on fieldwork that was carried out for the study covering five major towns of Selebi Phikwe, Lobatse, Francistown, Jwaneng and Gaborone. Therefore, four main uses were distinguished: re-use, recycling, losses in the production process and discharges into the environment. Unfortunately, inflows and outflows of WWTW have not been recorded after 2001 and therefore had to be estimated.
The water accounts indicate that water consumption increased to 170Mm3 in 2003 and self providers produce over half of the water consumption. Agriculture and domestic water use account for the largest water consumption (63 and 57Mm3 respectively). Groundwater is still the most important water source but its share is increasingly declining primarily due to construction of more dams. Furthermore, wastewater is abundant but not being fully utilised. The bulk of the resource is discharged into rivers and lost during processing in the systems. The accounts also indicate that the largest water consumer (agriculture) creates the lowest value added per cubic meter of water but still remains important for job creation. There is need for efficient water allocation among the user sectors and re-use should be enhanced.
The accounts need to be further developed and expanded to include other water source and monetary accounts should also be developed. This requires collection of costs and revenues’ data by water suppliers.
4.1.2 Livestock accounts
Livestock accounts cover the major types of livestock including cattle, goats, sheep and donkeys. Moreover, the accounts distinguish traditional and commercial sectors. The later covers the agricultural districts which were later converted to administrative districts while for the commercial sector the accounts are prepared at the national level. Agricultural Statistics and land use data formed the main data sources. The accounts have been developed for 1980 to 2002. The accounts cover physical and monetary aspects. The physical livestock accounts comprise of stocks, natural increase, destination of sales and the land resources account. These are summarised as follows:
Final Report WAVES Botswana Preparation Phase
36 | P a g e
i. Stock accounts: these show the number and composition of different types of livestock. ii. Natural increase accounts record the births minus deaths, while off-take records home
slaughter minus purchases. iii. Destination of sales account shows the different sectors which purchase livestock from
the farmers. iv. Land accounts show stock of land resources for livestock (rangelands) and the potential
carrying capacity of that land. v. The accounts distinguish between village areas and cattle posts and this is shown in an
auxiliary account indicating herd sizes. vi. The monetary accounts record the economic rent per livestock unit.
For the physical account, livestock numbers are converted into livestock unit (LSU) which is a unit of measurement applied so as to estimate the overall performance of the livestock sector and the pressure it exerts on the land resource. In addition, since livestock numbers are often given as per agricultural district, this had to be converted into administrative districts for the purposes of planning and this was done using conversion factors provided by the Ministry of Agriculture. The accounts also make distinction between village grazing areas (VGA) and cattle post areas (CPA) as to how many animals are found in each area. The land accounts provide qualitative and quantitative aspects of the grazing resource. Total grazing area was therefore estimated based on the following categories: fenced grazing areas or ranches, VGAs, CPAs and communal grazing area (including VGA and CPA) at both district and national levels. The accounts indicate that the livestock sector is declining. Interestingly, the commercial sector does not appear to perform much better than the traditional sector and commercial ranches appear underutilised (based on Agricultural Statistics figures8). While off-take is higher in commercial areas, the stocking rates are very low. There is more grazing pressure in the VGA, which have a social importance for rural communities. There has been an increase in the numbers of other livestock such as donkeys and goats. In terms of value, livestock value has not increased over the years. The sector is characterised by high subsidies; they constitute about three quarters of the total economic rent (DEA & CAR, 2006). Livestock accounts need to be further developed. Although Botswana has abundant, if irregular, agricultural statistics, these appear to be underutilized and there are limitations (e.g. commercial sector data, regional data inconsistencies).
4.1.3 Mineral accounts Mineral accounts intend to quantify the stocks of available minerals in the country in physical and monetary terms and also aim to determine how Botswana is using its mineral resources. These accounts have been developed for diamonds, coal and copper/nickel under the above mentioned categories for the period 1990 to 2004, but there is nothing more recent. Flow accounts do not exist as most of Botswana’s minerals are exported to foreign countries. The stocks are estimated as: start of year stock + new discoveries- mineral extraction In terms of the monetary value, this constitutes physical amount *mineral value. The latter is calculated using the economic rent and discount rate. For diamonds, new discoveries are not included in the physical stock account. The existing account indicates that diamond stocks have declined by 43.5% since 1990. The data are consistent with an 8 Agricultural Statistics are poor for the commercial sector and show huge inexplicable differences between years. For
further work, more detailed review and analysis of the commercial livestock sector is needed.

Final Report WAVES Botswana Preparation Phase
37 | P a g e
anticipated exhaustion of Botswana’s known diamond reserves around 2030. Coal reserves are only measured for two coal field (Mmamabula and Morupule) despite the fact that Botswana has about eleven coal fields. The estimates for the two facilities indicate that coal stocks stood at 7.19 billion tons in 1980 while the closing stock in 2005 was 7.17 billion tons. More recent estimates indicate total coal reserves of over 200 billion tonnes. This shows that there are abundant coal resources in the country hence there are opportunities for the expansion of coal-fired power generation for Batswana. If adequately exploited, the country would not have to rely so much on imported power from South Africa as is the case currently. The physical account for copper/nickel shows: final production and losses of the resources during processing. Therefore new discoveries are not incorporated into the accounts. It is indicated that copper/nickel declined by 36% between 1980 and 1998, although there have since been substantial new discoveries that are not included. The monetary accounts show that the diamond resource has been growing at a steady rate (resource rent) while the rent for coal is low. In terms of the mineral value, the accounts show that Botswana’s mineral wealth has increased as indicated for instance, by the growth in diamonds’ value – from BWP 1.4billion in 1980 to BWP 46.5billion in 1998. A large portion of the mineral wealth is accounted for by diamonds hence indicating its importance in Botswana’s economy. Botswana has done well in capturing and reinvestment of mineral rent (Lange, 2003). In conclusion, Botswana has been successful in utilising its mineral revenues to enhance economic development as indicated by the high net savings index. Mineral accounts are useful in that they enhance sound and informed decision making regarding sustainable development planning and management of the available mineral resources. The accounts therefore need to be updated and expanded to include information on new discoveries.
4.2 Macroeconomic data availability for Natural Resource Accounting
Macroeconomic data provides the framework within which much natural resource accounting takes place. Macroeconomic data can be divided into the following categories:
i. Gross Domestic Product: GDP by output (production); GDP by expenditure; GDP by income ii. Capital Stock
iii. International Trade: Trade in goods; Trade in services iv. Public Finance v. Prices
vi. Money and exchange rates A brief assessment of the quality and availability of relevant macroeconomic data follows.
Gross Domestic Product (GDP)
Statistics Botswana produces GDP data quarterly. The data are released according to an advance release calendar and are available within 90 days of the end of the relevant quarter. Data are produced by GDP by output and by expenditure, in both current and constant prices. The constant price data series has a base year of 1993/4. GDP by income data have not been produced for the past decade. GDP Output Data In published data, the economy is disaggregated into ten sectors (Table 8). However, Statistics Botswana also produces (on request) data for output disaggregated into 36 sub-sectors. The data
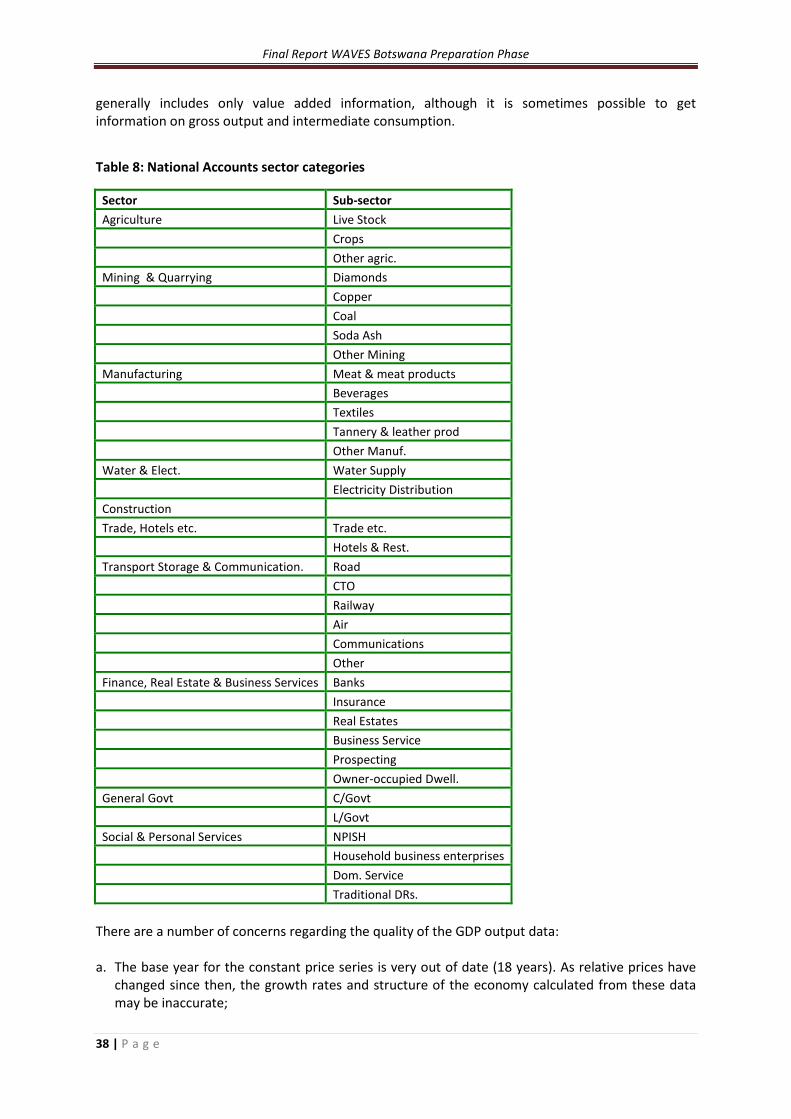
Final Report WAVES Botswana Preparation Phase
38 | P a g e
generally includes only value added information, although it is sometimes possible to get information on gross output and intermediate consumption.
Table 8: National Accounts sector categories
Sector Sub-sector Agriculture Live Stock Crops Other agric. Mining & Quarrying Diamonds Copper Coal Soda Ash Other Mining Manufacturing Meat & meat products Beverages Textiles Tannery & leather prod Other Manuf. Water & Elect. Water Supply Electricity Distribution Construction Trade, Hotels etc. Trade etc. Hotels & Rest. Transport Storage & Communication. Road CTO Railway Air Communications Other Finance, Real Estate & Business Services Banks Insurance Real Estates Business Service Prospecting Owner-occupied Dwell. General Govt C/Govt L/Govt Social & Personal Services NPISH Household business enterprises Dom. Service Traditional DRs.
There are a number of concerns regarding the quality of the GDP output data: a. The base year for the constant price series is very out of date (18 years). As relative prices have
changed since then, the growth rates and structure of the economy calculated from these data may be inaccurate;

Final Report WAVES Botswana Preparation Phase
39 | P a g e
b. There are inconsistencies between the published data series and the source data. For instance, the growth rate of real output (value added) in the diamond sub-sector exactly followed the growth of output measured in terms of carats until 2009, but since then the relationship has changed (Figure 1);
c. The process of rebasing the constant price series to a more recent year has thrown up a number of errors in the old series; while the revision process is still incomplete, initial results are that GDP has been overestimated over the years, and that the necessary corrections will lead to a downward revision of historical GDP, along with a commensurate reduction in historical economic growth rates. It may also lead to a downward revision of the size of the mining sector and its share of GDP. The process of revising the GDP data is expected to be completed during 2012.
Figure 1: Comparison of diamond output growth rates
GDP Expenditure Data are produced along with the Output (Production) data, in current and constant prices. These data are essential for tracking investment and savings; both are crucial variables in the assessment of macroeconomic sustainability in general and the sustainable use of mineral revenues in particular. However, the data are highly inaccurate, most obviously reflected in the Errors & Omissions (E&O) that are necessary to make the GDP Expenditure data balance with the GDP Output data. The level of E&O is volatile from year to year but has generally increased over time, and is often equivalent to more than 10% of GDP. A major implication of this is that it is impossible to calculate national savings with any accuracy. There are two ways of calculating national savings from the national accounts expenditure data, i.e. Y = C + I + X – M = C + S hence S = Y – C and S = X – M + I Due to E&O, the two calculations of the national savings rate yield wildly differing results. For instance, in 2010 the savings rate calculated in current prices was either 38% or 21% of GDP, depending on which identity is chosen. Without knowing which of the main categories are the most
-50%-40%-30%-20%-10%
0%10%20%30%40%50%
Annu
al G
row
th (4
QM
A)
DIamond Output Growth
VA real Carats
Final Report WAVES Botswana Preparation Phase
40 | P a g e
inaccurate, it is impossible to generate a national savings rate with any degree of confidence. However, the ongoing revision of the GDP data and updating of the base year should help to provide a more consistent series with improved recording of savings rates going forward. This is expected to be completed during 2012. GDP Income data track claims on national output by income category (wages, profits, consumption of fixed capital etc.) and is important in tracing the distribution of income over time. Although not of central importance to natural resource accounting, it is crucial more generally, especially in a society that has a very high degree of income inequality like Botswana. Unfortunately Statistics Botswana has been unable to produce these data for some time, and they have not been published since 2000/01. Capital Stock
Data on capital stock are very important from several perspectives, such as monitoring productivity (required for total factor production or TFP calculations) and assessing whether the capital assets of the nation are being maintained and expanded – which is particularly important for a mineral producing country. Unfortunately, although capital stock data by sector have been published in the past, they are no longer published. The most recent capital stock data that we are aware of date back to 2006/7.
Trade data
Trade data are important from a macroeconomic perspective as Botswana is a highly open economy and exports and imports account for a high proportion of GDP. More generally, many economic developments are driven by trade developments. Furthermore, mineral exports make up the majority of overall exports. Much of Botswana’s trade data are of high quality. Data on exports and imports of goods are published monthly, with a relatively short time lag. Data on major exports (e.g. diamonds, copper-nickel) are separated, and the remainder are divided into high-level commodity groupings. The data are sourced from BURS, and compiled from computerised clearance forms, which minimises the scope for sampling or data entry error. Data on key exports are also published by the Bank of Botswana, sourced directly from major exporting firms. The main concern with the data on trade in goods is that of inconsistencies between the SB data and the BoB data. These inconsistencies are often quite large and the basis for this inconsistency is as yet unresolved. Data on trade in services (e.g. tourism, financial services) are compiled by the Bank of Botswana (BoB) and drawn from various different sources, including data on foreign exchange transactions from the commercial banks and various surveys (e.g. visitor surveys). Unfortunately the services import and export data are very poor, with published data series inconsistent and subject to unexplained methodological changes. As a result, there are no credible published data on tourism exports. Public finance
Data on public finances are produced by the Ministry of Finance and development Planning (MFDP) and published by BoB in the Botswana Financial Statistics. Data published monthly include revenue and spending, to a reasonable level of disaggregation. Annual data provide a more detailed disaggregation of spending by functional activity, with each divided into recurrent and development (investment) spending.

Final Report WAVES Botswana Preparation Phase
41 | P a g e
Although the data are of reasonable quality there are a number of problems. First, the data are complied according to the IMF’s Government Finance Statistics (GFS) 1986 manual, rather than the more up to date GFS 2001 manual. One of the big differences is that GFS 1986 treats all revenue and spending on a cash flow basis, so that, for instance, revenues from asset sales are considered as “income” in the budget. The GFS2001 corrects this and treats revenues from asset sales (e.g. privatisation receipts) as a financing item rather than a revenue item, in line with conventional accounting treatment. A second problem is that the production and publication of the data is very erratic, with variable time lags of up to six months before “top line” data are published, and even longer lags for more disaggregated data (e.g., at the time of writing in October 2011, the most recent disaggregated revenue and spending data are for February 2011). MFDP has consistently failed to live up to its own commitments to produce regular and timely public finance data. A third problem is that data on public debt and guarantees is almost non-existent. At the time of writing the most recent data on overall public borrowing was for March 2010, and no data are published regularly on guarantees. Hence data on government financial liabilities – which are necessary to determine the overall financial asset position of government – are very weak. Prices, money and exchange rates
These data are of less direct relevance to natural resource accounting but are generally of higher quality. Inflation data (based on the consumer price index) are published monthly, in line with an advance release calendar, by the middle of the month following the reference date. There is no Producer Price Index. Monetary and financial data are compiled by the BoB and published in the BFS, with most variables published monthly with relatively short lags. Exchange rate data are published daily on the BoB website and monthly in the BFS. Information on the quality and availability of key macroeconomic data is summarised in Table 9. Table 9: Summary of macroeconomic data quality
Frequency Timeliness ARC Quality Relevance GDP - Output (production)
Q 3m Y 3 5
GDP - Expenditure Q 3m Y 3 4 GDP - Income NP None N 1 2 Capital stock NP None N 1 5 Public revenue & spending
M 3-6m N 4 5
Public debt A 12-24m N 2 3 Trade - Goods M 2-4m N 4 5 Trade - Services Q 6-9m N 2 3 Inflation M 1m Y 4 2 Money/finance M 1-2m Y 4 2 Exchange Rates D Same day n/a 4 2 ARC-Advance release calendar; NP-not published; Q-quarterly; M-Monthly; D-daily; Quality and Relevance (to the current exercise) are subjective assessments on a scale of 1-5
5 Opportunities for WAVES activities
Final Report WAVES Botswana Preparation Phase
42 | P a g e
5.1 Introduction WAVES focuses on improving sustainable development planning and decision making through wealth and resource accounting. Moreover, it assists decision makers to better understand the value of ecosystems services. A detailed work plan has been prepared for the four main policy messages/ areas, i.e. macro economics & mining, the future energy mix, water resources use and scarcity and ecosystems, tourism, land and livelihoods. A matrix summary is available separately. During the first stakeholder workshop, the suggestion was made to develop sustainable development indicators across the resources under consideration (i.e. water, land, minerals, tourism and energy). The country’s development performance is currently measured by economic indicators (e.g. p.c. GDP) and the human development index (HDI). These SD indicators would complement the traditionally used economic development indicators9, provide better information about the SD performance and could be used to support the Rio+20 process (2012) and Botswana contributions thereto and support the MTR process in 2012/3 and ultimately NDP11 preparations. Therefore, the choice and construction of SD indicators would be a priority activity for early 2012. A second performance review of Vision 2016 is planned for the first half of 2012, and this review considers whether new indicators should be incorporated in the evaluation of progress in achieving the Vision 2016 objectives. Hence there may be an opportunity to engage with this review process with a view to incorporating a broader range of SD indicators. The following activities are recommended:
g. Rapid assessment of international SD indicators and best practices; h. Recommendations for a limited number of Botswana-SD indicators, which will be reviewed
at a stakeholder workshop; i. Construction of SD indicators: j. Indicator analysis for Rio+20 (2012) and for MTR (2012/3); k. Regular up-dating of the SD indicators to be included in the State of Nation analysis and
budget speech; and l. Engage with Vision 2016 performance review process with a view to including SD
indicators. The second major proposed cross cutting activity is the valuation of ecosystem services in the Chobe area. WAVES would collaborate with the GEF funded BioChobe project (funding is available for detailed project preparation in 2012 and implementation will start in 2013). The Chobe area is important for biodiversity and development for several reasons:
i. The area has important biodiversity resources (e.g. wildlife, hard wood and other natural resources);
ii. The area is currently under-utilised (e.g. Forest Reserves) and where used the use is unbalanced. For example, tourism is concentrated too much on the Chobe River front, leading to congestion and risks of biodiversity losses, while other parts of the Chobe National park are under-utilised;
iii. There is no integrated land use plan that optimises land use and safeguards wildlife migration routes and biodiversity hotspots; and
9 The indicators do not take into account changes in the stock and quality of natural resources and changes in (and the
costs of) pollution.
Final Report WAVES Botswana Preparation Phase
43 | P a g e
iv. Growing competition between agriculture and ecotourism and nature conservation, among others because of access to surface water.
The time window to get resource use and conservation in this high value area right is limited, and therefore action is required in the near future. The following activities are recommended:
1. Collaboration with BioChobe and District authorities to establish WAVES activities, priorities and time lines for the area;
2. Assessment of ecosystems’ values of the CNP and selected FRs; 3. Policy analysis of valuation results to promote multiple resource use (e.g. FR for tourism and
wood harvesting), re align land use zones (e.g. introduce National park status or WMA zoning in FRs). This will benefit local livelihoods and district development as well as biodiversity conservation; and
4. The results will be integrated in the midterm review of the Chobe DDP and NDP10 and contribute towards the next rounds of DDP/NDP.
Below we discuss resource and sector specific activities.
5.2 Water resources activities
Botswana has two major advantages with respect to water accounting. Firstly, water accounts have been prepared in the past, even though they are not adequately institutionalised and irregularly up-dated. Second, the main new mandate of DWA is water resources management and in discussions with DWA it became clear that water accounting is considered to be an important tool (see also BNWMP2; SMEC et. al., 2006). The data base that DWA plans to establish in support of their IWRM efforts will facilitate the WA10. The positive attitude towards WA is further amplified by the SADC initiative to introduce a standardised method of water accounting in southern Africa, based on the UNSO system. Moreover, the Stockholm Statement to the Rio+20 Summit adopted at the World water Week states the close interdependence between water, food and energy security and calls for significant increases in (and incentives for) water use efficiency and for the expansion of current measures of economic performance with indicators on environmental and social sustainability. During the consultations, DWA mentioned that there will be need for external support to develop in house human resource capacity and expertise. In brief, the environment is most suitable for the preparation of improved annual water accounts but WAVES support is required. The following activities are recommended:
9. Discuss and agree DWA hosting of WA activities (expansion of WA and annual up-dates). Parties involved should be DWA, SB, DEA (as initial WA initiator) and PEI/WAVES. The start-up activity needs to validate DWA commitment to WA and ensure that WA will be developed in a way that DWA can sustain (and expand) the efforts beyond the WAVES project duration;
10. Review DWA IWRM needs and priorities. WA was assumed to be covered in the BNWMP2, but this did not happen. However, the plan, the new (draft) water policy and the country’s IWRM-WE plan (due by the end of 2012), can all be used to identify WA needs and priority areas;
11. Review data base and gaps (beyond the review provided here). The establishment of the DWA data base would assist the construction of WA and vice versa WA could assist the
10 It is uncertain when the data base will be established.

Final Report WAVES Botswana Preparation Phase
44 | P a g e
development of a comprehensive water management data base. The institutional reforms should lead to greater data homogeneity and improved data access;
12. Design the required structure for WA (Water Accounts) and identification of priorities for WA development. This activity needs to comprise the review of international WA requirements and best practices (UNSO and SADC), blended with national needs and priorities based on the country’s ‘environment’ and data availability;
13. Training of DWA staff in WA development, including data collection and entry. Once DWA has identified dedicated staff, training needs to be offered in understanding WA and their construction and use;
14. Compilation of the BWA. This needs to be done by DWA staff with technical assistance and support from WAVES;
15. Policy analysis of the BWA results. It is recommended that DWA will constitute a policy analysis committee that analyses the WA results in terms of their implications for IWRM (in terms of MTR and IWRM-WE plan) and BNWMP2 implementation; and
16. Incorporation of policy findings in development planning cycle and decision making. The targets will be MTR and the NDP11. This requires that DWA staff involved in the development planning cycle is kept fully informed about WA and its results.
Activities 6-8 would be annual events and linked to policy entry points applicable to that particular year. In terms of time schedule, activities 1-6 can be implemented in 2012. Activity 7 would be done in 2013 and target the MTR. Subsequently, activities 6-8 would become annual activities.
5.3 Mineral resources activities The incorporation of mineral resources into the wealth accounting framework is very important in Botswana for several reasons. First, minerals account for a high proportion (30-40%) of GDP. Second, the diamond component of the mining sector is expected to experience a decline in production levels within the next 15-20 years, thus giving sustainability issues a high priority. A particular concern is that the levels of consumption to which Botswana has become accustomed may not be sustainable when diamond revenues drop off. Third, economic rent constitutes a high proportion of gross output in the diamond industry, thereby making issues around the capturing of rent and the uses to which mineral revenues are put by government particularly important. Botswana has been highly successful in rent capturing in the past and needs to continue this success in future. Even if fiscal systems are quite efficient at capturing rent, and if government is committed to devoting mineral revenues to reinvestment in physical and human capital (which appears to be the case), it is nevertheless important that such reinvestment is devoted to economically productive assets if the income generation capacity of the economy is to be sustained once diamond production drops. Fourth, even though diamond production is scheduled to drop sharply within a generation, there is the possibility of developing large-scale coal mining in Botswana. This raises resource sustainability issues that are similar in principle but different in context to those surrounding diamonds, but also a much broader range of environmental sustainability issues. While mineral accounts have been produced in the past (DEA and CAR, 2006), there has been no attempt to expand and regularly up-date these mineral accounts, whether in terms of tracking the availability and use of natural mineral assets, or calculating economic rent and its appropriation and use. However, there have been attempts to incorporate sustainability considerations into public finance decisions over a prolonged period, although this appears to have fallen into disuse.

Final Report WAVES Botswana Preparation Phase
45 | P a g e
Although government recognises that mineral accounts are important in Botswana, implementation is hindered by a lack of the necessary source data and inadequate prioritisation. The key institution is the Mineral Affairs Division (MAD) of the Ministry of Minerals, Energy and Water Resources (MMEWR), under which falls both the Department of Mines (DoM) and the Department of Geological Survey (DGS). Also integrally involved is Statistics Botswana (SB, formerly the Central Statistics Office), particularly the National Accounts unit, and to a certain degree the Ministry of Finance and Development Planning (MFDP), which compiles public finance data. There are several activities that are recommended for the WAVES project in respect of mineral resource accounting:
k. Surveying existing data availability (especially in DoM, DGS and SB) and identifying data gaps.
l. Updating economic rent calculations, as far as possible, on the basis of existing data m. Building institutional support for the development of mineral resource accounting in the
MAD and SB n. Assessing priorities and developing a framework for mineral resource accounting o. Identifying the resources needed to fill the data gaps, and helping to mobilise for the
provision of those resources. This may include identifying and extracting unused data from existing data sources and surveys, identifying how to upgrade existing data collection exercises, and identifying the resources needed to meaningfully analyse data and publish the results.
p. Training staff in MAD and SB to compile mineral resource accounts. q. Compile first set of mineral resource accounts. r. Publishing expanded and updated mineral resource accounts s. Analysing the accounts, developing policy implications and providing feedback to MMEWR
and MFDP t. Extending the analysis and policy implications to provide inputs to NDP11.
In terms of timescale, items 1-3 could be carried out in 2012. Item 3 would need to be continued into 2013, along with items 4-7. Once the framework for mineral resource accounts is agreed, the resources provided and the system of data collection and analysis in place, 2014 and 2015 would then be devoted to improving the framework, deepening the analysis and feeding into policy processes, notably NDP11 which will run from March 2016. Compiling the accounts should then become an annual activity.
5.3 Ecosystems, livelihoods, tourism and other land -related activities Valuations have been carried out in the past for the Okavango Delta and the Makgadikgadi wetland. These studies showed the high value of direct and indirect land and ecosystem uses (provision of goods such as food, beef, veld products and tourist products as well environmental regulatory functions, etc.). The loss of ecosystem services would affect the potential for economic growth and diversification as well as poverty eradication efforts. It is therefore important that the values of the most important ecosystems are estimated and understood. Tourism has grown over the years and has become a major contributor to GDP as well as an importance source of employment and development. Although the tourism industry has shown significant growth over the years, tourism data collection and analysis have been neglected. The Department of Tourism (DoT) has been tasked with handling tourism statistics. The DoT collects statistics for international tourists and for tourist accommodation. It further undertook a Tourism Satellite Account (TSA) in 2005/6, and has since managed one update in 2009. The department also

Final Report WAVES Botswana Preparation Phase
46 | P a g e
carries out some entry and exit surveys at border posts which feed into their annual reports. Although the surveys are carried out on a continuing basis and supposedly analyzed monthly, the data is not readily available to the public other than once a year. The results of the Domestic Tourism Survey are not yet available. Other than the above mentioned, there is insufficient data for tourism accounts and the Department does not have the capacity to do more. There is a missing link between SB National Accounts division and the DoT and thus there is little inclusion of tourism into national accounts. Further, the Department of Tourism needs some understanding on the kind of data required by the market and consumers. Land accounts (LA) are complex as they cover a variety of economic sectors, land-based resources and land uses. Moreover, many land data are incomplete (e.g. land quality) or inconsistent (land use by district). Most land data are not regularly recorded and computerised. Few countries have comprehensive land accounts, but a framework is in preparation by UNSO and lessons can be learned from other countries, both of which could offer useful starting points for Botswana’s LA. LAs are important as optimal land use is essential for future economic growth, development and increased welfare. The past decades have shown that agricultural land productivity is low and stagnant and that other sectors and land uses have a higher productivity and growth potential. Multi land use and more diverse land uses (in addition to traditional agriculture) are therefore vital to the country’s future. Land Boards and the Departments of Lands and Town and Regional Planning are key institutions in land use planning and management. To-date they have however shown little interest in the construction of land accounts (as shown during the first WAVES stakeholder workshop). Therefore, the development of land accounts cannot take place immediately. The first steps would be to review experiences from other countries with land accounts and to review the proposed UNSO method. Based on these activities, discussions with the above institutions are commended to assess the relevance of LA for Botswana. If interests exist, the data base will be reviewed and priorities for Botswana LA should be assessed (2013 & 2014). Construction of LA could then start in 2015 and the LA can be used as inputs into the NDP11 planning process. The following has been recommended as activities for WAVES: 11. Review previous ecosystem valuation studies (e.g. Okavango, Makgadikgadi & Protected Areas) 12. Liaise with BioChobe preparation study to determine ecosystem valuation needs additional to
the project; 13. Review existing tourism data, surveys and satellite accounts; 14. Valuation of Chobe area (in consultation with and depending on the needs of the BioChobe
project) 15. Design land account framework; 16. Collect data for the accounts; 17. Collect additional data through tourism expenditures and enterprise surveys; 18. Enter data for land accounts; 19. Policy analysis and implementation recommendations for accounts for NDP11; and 20. Training and awareness raising workshop
Activities 1 through 3 are planned for the first year of WAVES, while Activities 4 to 8 (partly) are to be undertaken in the 2nd and 3rd year. Activity 10 will be done throughout the project duration. Activity 9 (and part of 8) will occur in the last year.
Final Report WAVES Botswana Preparation Phase
47 | P a g e
5.4 Energy resources Energy resources utilization cut across all sectors and therefore given the current energy shortages experienced in the region and in Botswana their importance cannot be overemphasized. However some resources are limited thus affects people’s livelihoods and electricity costs are rising and as such not all consumers can afford it. In contrast, energy resources such as coal and the sun are not sufficiently exploited. Coal reserves are significant but the resource has not been fully tapped because of low grades (requiring washing) and access to export markets. National energy balance information is also available for 1981 to 2008. These indicate energy resources in terms of supply and demand for the various sectors. General data on energy resources in Botswana is available but not adequate and comprehensive. Energy stock data and use data by type of energy and economic sector are limited. For instance, data on biomass is lacking (rate of uptake, depletion rate, etc), but the resource is highly important particularly for rural livelihoods. There have been no attempts to develop energy accounts in Botswana; hence WAVES could initiate such accounts in collaboration with the Department of Energy Affairs (DENA). It is yet to be fully assessed as to what data is available that would be utilized in developing the accounts. There is however need to develop interest from DENA for WAVES to get full support and needed participation. The following energy related activities are recommended for the WAVES programme:
j. Development of interest among the DENA and relevant stakeholders such as Botswana Power Corporation (BPC) and Department of Transport. This would establish the activity needs of the sector, identify the role they could play in the process of developing energy accounts and commitment to the process beyond 2015;
k. Baseline assessment of energy resources data from the Department of Energy and identifying gaps. This would also include assessing the type of energy resources to be considered;
l. Assessment of priorities for the sector and develop a framework to be adopted for the energy accounts. This process should also be a collaboration of WAVES and DENA;
m. Design the structure for energy accounts n. Assessment of capacity needs and identifying relevant dedicated staff within the DENA that
require training. These would be trained on the framework adopted, data collection, entry, analysis, presentation of the findings and how they can be utilized.
o. Identification of energy pricing issues and long-term economic costs and benefits p. Data collection of data by each energy resource. This would lead to development of energy
accounts for the available energy resources. This process will be driven by the department with technical support from WAVES.
q. Publishing the accounts and analysis for policy implications. This should result in the preparation of a policy brief.
r. Update and further analysis of the accounts for input into NDP 11.
In terms of the time line, activities 1 – 3 could be undertaken in 2012; 4 in 2013; 5 between 2013 and 2014; while 6 and 7 could be carried out in 2015.
Final Report WAVES Botswana Preparation Phase
48 | P a g e
References Arntzen,J.W,. and D. Veenenedaal, 1986. Profile of Environment and Development. National Institute for Research, Gaborone Arntzen,J. et. al., 2010. The economic value of the Makgadikgadi Wetland. Vol2. Makgadikgadi Framework Management Plan, DEA & CAR, 2007. Botswana Mineral Accounts. DEA & CAR, 2006. Botswana Water Accounts. DEA & CAR, 2008. Botswana Livestock Accounts. Government of Botswana, 2010. National development Plans 9 & 10. Government of Botswana and UNDP, forthcoming. Botswana Human Development Report. GoB & UNDP, 2006 and 2010. Progress reports MDG achievement. Lange,G.M., 2003. National Wealth, Natural Capital and Sustainable Development in Namibia. Research Discussion Paper 56, DEA, MET. Lange,G.M. and Hassan, R. (eds.), 2006. The economics of water management in southern Africa, pp.15-43. Edward Elgers. New York. MEWT, 2002. State of the Environment report. Gaborone. MEWT, 2007. Revised Biodiversity Strategy and Action Plan. Gaborone. Turpie,J., J.Barnes, J.Arntzen, G.Lange, B.Nherera and B.Buzwani, 2006. The Economic Value of the Okavango Delta and RAMSAR site. ODMP report prepared for the DEA. Vision Council, 2009. Vision 2016 Botswana Performance Report. World Bank, 2010a. Mainstreaming Environmental Concerns into Development Planning. Policy Note prepared for Government of Botswana. World Bank, 2010b. The Impacts of Climate Change on Botswana’s development in particular water resources sector. World Bank, 2011. The Changing Wealth of Nations: Measuring Sustainable Development in the New Millennium. Washington DC.

Final Report WAVES Botswana Preparation Phase
49 | P a g e
Appendix A: Land resources and sector assessment
A.1 Resource supply & trends Botswana is a large, semi-arid, land-locked country in central southern Africa. The land surface is approximately 582 000 km2. The Kalahari sandveld covers 77% of the country, while the eastern hardveld constitutes 23% (Table 5). Low and erratic rainfall and poor soil conditions are the main constraints of primary land productivity. Table 10: Size of the two major ecosystems in Botswana (km2)
District Sandveld Hardveld Total size Southern 15 328 13 142 28 470
South-East 1 780 1 780 Kweneng 23 630 12 260 35 890
Kgatleng 7 960 7 960 Central 70 347 77 383 147 730
North east 5 120 5 120
Ngamiland 109 130 109 130 Chobe 7 950 12 850 20 800
Ghanzi 117 910 117 910 Kgalagadi 104 912 2 028 106 940 Total 449 207 132 523 581 730
Source: Environment Statistics 2006.
Sandveld around the Chobe, Makgadikgadi and Okavango Delta is sometimes classified as wet sandveld (Map 1). Unlike its neighbours, Tribal Land is the most common form of land tenure (71%); State land covers 25% and freehold land a mere 4% (NDP10, p.252). Given its small population (1.8 million in 2001), population density is low. However, land pressure exists in eastern Botswana, particularly around urban areas and in the smaller administrative districts (South-East and North-East District). The main concern with the land supply refers to declining quality due to settlement expansion, land clearing and livestock grazing. Land resources in the vicinity of villages and land in the immediate vicinity of boreholes are most degraded due to high livestock pressure. Such degradation leads locally to soil erosion but more widespread to bush encroachment and loss of biodiversity and productive capacity. Perennial grasses disappear and encroacher tree shrubs dominate the woody vegetation. Due to highly variable climatic conditions, the actual productivity of land resources fluctuates widely, limiting the relevance of common land management concepts such as carrying capacity. Land users need to pursue adaptive land management strategies based on the actual, highly volatile conditions.
A.2 Resource demand & trends The main demands of land are for agricultural, residential, mining, commercial, industrial, civic, community and tourism/recreational activities. Arable land demands have been limited due to stagnation of the sector. In fact, most arable land is under utilised. Demand for overall grazing land has not increased much since the national herd has not grown since the 1980s. However, there is growing demand for private grazing land. The

Final Report WAVES Botswana Preparation Phase
50 | P a g e
growth of the tourism sector has led to more demand for tourism concessions and land. Traditionally, tourism has depended on wildlife viewing in Parks, Reserves and later on Wildlife Management Areas. More recently, there is a growing demand for land in specific areas or spots (e.g. scenic spots, large dams) outside wildlife areas. Efforts are made to consolidate such spots into the Land Bank. Finally, the mining sector continues to grow rapidly. Exploration activities cover much of the country and new mines have been established. While the overall land demand for mining may be small, it is growing and mining exploration opens up hitherto less accessible areas for development. Table 6 shows the current land use. Clearly, most land resources are used for livestock production and nature conservation. Fifty nine percent of the land resources are used for agriculture and settlements (a quarter is this land is privately owned); nineteen percent is used for resource conservation (Parks and Reserves) and forty percent is used for tourism (Parks, Reserves and WMAs). Little land is formally set aside for crop production. Table 11: Land uses and zones
Land tenure and sub categories Size in km2 Size in km2
I Tribal Land 416 869 Ia Communal (Livestock, arable & residential) 253 223
Ib Private Ranches (livestock and some game farming) 65 774
Ic Wildlife management Areas (WMA) 97 872
II Freehold land 19 429 IIa Freehold farms (livestock and some game farming) 19 109
IIb Arable blocks 320
III State Land 145 433 145 433 IIIa National Parks (conservation & tourism) 45 900
IIIb Game Reserves (conservation & tourism) 60 558
IIIc Forest Reserves (conservation) 4 555
IIId Government livestock ranches 3 717
IIIe WMA (tourism, conservation and limited agriculture) 30 703 Total land resources 581 731
Source: adapted from Environmental Statistics 2006.
Over the last decades, the major changes in land demand have been:
a. Establishment of Wildlife Management Areas in Tribal and State Land (since 1986), where wildlife utilisation is the primary form of land use. Agricultural land use is secondary. WMAs occupy a significant portion of the land resource (Table 2);
b. Settlement expansion, mostly into mixed farming areas. Although population growth has declined to 1.9% per annum (2001-2011), the growth or cities, towns and large villages is considerably faster requiring more serviced plots and agricultural land in the vicinity;
c. Growing demand for private agricultural land, in particular livestock ranches. This demand is encouraged by agricultural policies that promote ranches in order to commercialise the livestock sector. This demand is mostly met through an increase in the lease area on Tribal Land;
d. Land speculation, particularly around urban areas. This has led to an informal land market where plots and arable fields are sold (see for example the Botswana Advertiser).
Final Report WAVES Botswana Preparation Phase
51 | P a g e
A.3 Land related policies, legislation and enabling-disabling environment
The most important policies and laws include the Tribal Land Act, the 1975 Tribal Grazing Land Policy, the 1986 Wildlife Conservation Policy, the Land Tenure Commission Report and White paper (1985), the 1990 Wildlife and National Parks Act, the 1990 National Agricultural Development Policy, the 1990 Tourism Policy and Act and the 2003 Settlement Policy. The revised 2010 EIA Act requires environmental impact assessments of projects and policies with expected significant environmental impacts, including adverse impacts on land resources. Botswana has a long history of land use planning (dating back to the late 1970s), but surprisingly there is no approved Land Policy. Little has changed over time in terms of the main land tenure categories (Tribal, Freehold and State Land) but changes have occurred within the main category of Tribal Land with the introduction of leasehold Tribal Land (under the 1975 TGLP and the 1991 NADP). In response to growing land pressure in small districts, Batswana are now allowed to apply for Tribal Land in any part of the country, irrespective of their origin or current residence. This has facilitated access to land among residents of small districts. Communal Tribal Land has remained free to-date but annual land rentals are due for leasehold land. These charges benefit Land Boards in Tribal Land and Government on State Land. There is no systematic foundation for setting land rentals, and as a result charges are often low, discouraging investment and productivity. However, a competitive tendering process is used for tourism concessions, leading to higher revenues and more productive use. Land valuation and a systematic land allocation and charges system is needed to promote optimal land use, particularly on Tribal and State Land. State Land is essentially managed by the Department of Lands. District Land Boards are responsible for the allocation, use and management of Tribal Land under the Tribal Land Act. Land Boards have been fairly successful in allocating land resources, but are not really actively managing Tribal Land resources. For example, powers to repossess unused communal land in order to allocate it to land applicants are not used. Land Boards do not possess a computerised land data base, making it impossible to manage land resources effectively and to minimise land use conflicts. Most Districts have a land use plan and large settlements often have a settlement land use plan. Such plans are prepared through the Department of Lands (DoL), Department of Town and Regional Planning (DTRP) and the District Land Use Planning Units (DLUPU).
A.4 Available data and data gaps
Available data
Supply: • Land area by district and national • Land tenure by district and national • Land use & zones by district and national • Soil maps (national and district) • Vegetation types • Drainage basins map (Limpopo, Okavango, Makgadikgai, Nata, Chobe & Molopo) • Biodiversity richness index (national) and BD threats • Ecological zones (sandveld – hardveld) • Potential carrying capacity for livestock • Crop land suitability map (national) • Agro-climatic zones (national) • National map with boreholes drilled; water point surveys in (some) districts • Wildlife distribution (national) and by major wildlife regions
Demand:
• Land use • Land right applications (LB) • Land pressure: population, livestock, wildlife

Final Report WAVES Botswana Preparation Phase
52 | P a g e
Markets:
• Prices of freehold land • Land charges by LB and DoL • Land rentals for tourism concessions
A.5 Land data issues
a. Lack of integration of land use and water use planning b. Land pressure (e.g. population, livestock) c. Data inconsistencies (adding up districts) d. No computerisation – data base e. Time series of land use changes f. No data on allocations, use, changes in quality, land distribution, total land rights g. Inconsistencies with local boundaries (e.g. admin, wildlife, agricultural, health etc.). GIS overlays h. Different eco regions (e.g. Revised BDSAP and SoE Report) i. Up and down scaling (between district & national level).
Final Report WAVES Botswana Preparation Phase
53 | P a g e
Appendix B: Water resources & sector review Water is a key resource to Botswana’s development and is a basic need for human beings, ecological systems and drives economic growth. The country is however semi-arid with low, erratic rainfall (ranging between 250 and 650mm per year) and is characterised by scarce water resources. Surface water resources are limited especially in the southern part while most of the available rivers are in the north. Groundwater is therefore the major water resource in Botswana and is especially important in rural areas (DEA and CAR, 2006; and Lange and Hassan, 2006). There has been rapid development over the years and this has led to expansion of water provision services to several townships and villages and an expansion of the end-consumers. This has put pressure on the available resources hence the need to efficiently and sustainably use the available limited water resources. The country is currently undergoing a sector reform process where institutional roles of water service delivery have shifted and a Water Resources Council will be established. In addition the reform also involves development of water policy and revision of water legislation (World Bank, 2009).
B.1 Water resource supply trends
B.1.2 Surface water The country’s surface water sources are restricted to ephemeral and perennial rivers as well as water stored in reservoirs. The perennial rivers Limpopo, Orange, Chobe/Zambezi and Okavango, are shared water courses and their utilisation is subject to SADC Protocol on Shared Water Courses. The country’s average annual run-off is about 696Mm3 (SMEC et al., 2006) but only limited quantities can be captured. This minimal water harvesting is due to lack of suitable dam sites, variability of rainfall and high evaporation rates (Parida et al., 2006). According to CAR and DEA (2006), there are about ninety-four dams, of which 94% are small and utilised in the agriculture sector. Five large dams supply urban areas and these include Letsibogo, Gaborone, Shashe and Nywane, Bokaa and Ntimbale dams with a total storage capacity of 354.1 Mm3 11 and sustainable yields of 70.3 Mm3 per annum (DEA and CAR, 2006).Table 1 gives information about these dams and clearly indicates that the sustainable yields of the dams are small as compared to the total dam capacity (about 20%). The Botswana water accounts (CAR and DEA, 2006) show that the major dams are under high pressure (increasing demand and high evaporation) as indicated by a decrease in the amounts of water stored. The stock accounts (dams) for 2001, 2002 and 2003 estimated final dam volumes of 320, 236 and 245 Mm3 for the mentioned period. Water abstraction from these sources far exceeds the dam sustainable yields. Construction of a few dams: Dikgatlhong, Lotsane, Ntimbale and Thune in eastern Botswana is on-going and it estimated that they would yield a total of 75.63 Mm3 per annum (SMEC et al., 2006). These are the last available dam sites in the country therefore further dam developments will rely on shared water sources and their use is subject to international agreement with the riparian states. The 2006 National Water Master Plan however argues that it would be costly to undertake further expansion of water supply will be costly therefore it is imperative to explore more sustainable options and change current practices in water use and management.
11 Excluding Ntimbale dam
‘Duplication of the NSWC is a very expensive option to pursue.
Despite it being uneconomic, it may still proceed for political and
strategic reasons, which could be equally valid. However, these
reasons should be transparent, as all consumers will eventually pay
for these decisions’ (Review NWMP, vol. 12, p.9).

Final Report WAVES Botswana Preparation Phase
54 | P a g e
Table 12: Botswana's major dams
Dam Capacity Mm3
Hydrologically sustainable yields (Mm3)
Sustainable Yields (Mm3) Mean annual runoff (Mm3)
Gaborone 144.2 7 10 31 Letsibogo 104 16 20 57 Nywane 2.3 0.3 0.3 1.9
Bokaa 18.5 0.1 1.1 9 Shashe 85.3 22 40 84 Total 354.3 45.3 70.3 173.9
Source: SMEC et al., 1991, WUC annual reports (in CAR and DEA, 2009).
B.1.2 Groundwater About 80% of Botswana’s population receives water from groundwater sources (SMEC et al., 2006) and in 2003, these resources provided 55.5% of the country’s total water demand (World Bank, 2010). Groundwater sources supply most rural areas as well as the mining and the livestock sectors. Total groundwater resources are estimated at around 100billion m3 with an average annual recharge of about 1.6 billion m 3 (SMEC et al., 2006). There are 25 000 officially registered boreholes of which over 10 000 are government owned.
B.1.3 Wastewater The National Master Plan for Wastewater and Sanitation (NMPWWS) of 2003 estimates that there are sixty-four wastewater treatment works (WWTWs) in Botswana with a total capacity of 90,974m3 per day. Wastewater is mainly produced in urban centres and these account for about 80% of the total inflow at the WWTWs (CAR and DEA, 2006 and 2009). Figure 1 shows wastewater inflows into WWTWs for the period 1990 to 2003. The inflow was estimated at 14.8 Mm3 in 1990 and more than doubled to 29.2 Mm3 in 2003 and the supply is largely generated from government and households. Five major types of treatment facilities are commonly used: pond system, activated sludge, trickling filter, rotating biological contractors and constructed wetlands. The availability of the resource is increasing largely due to increasing water consumption and improved sanitation and sewerage facilities.

Final Report WAVES Botswana Preparation Phase
55 | P a g e
Figure 2: Wastewater supply to WWTWs (1990-2003; Mm3 )
Source: CAR and DEA, 2006.
Reliability of water supply in Botswana is generally good. This mainly becomes a concern when there is insufficient rainfall or drought as this reduces the groundwater levels and inflows into dams are reduced. Moreover, reliability of supply maybe hampered when supply infrastructures are over-stretched (World Bank, 2010).
B.2 Water resource consumption trends Aggregate water consumption has increased from 140 Mm3 in 1990 to 170 Mm3 in 2003. This is however below the 1991 demand forecast of the National Water Master Plan (CAR and DEA, 2006). The growth in water consumption is largely associated with mining and household sectors. There has been an expansion of mining developments hence resulting in increased water use. Furthermore, the increase in household water consumption is due to population growth, access to income as well as access to water and sanitation facilities. Per user sector category, the agricultural sector remains the leading water user in Botswana followed by households while mining experienced the fastest growth followed by government (Table 2). Water consumption has increased much faster in urban areas as compared to rural areas. In terms of water service providers, self-providers (i.e. most mines and the livestock and nature-based tourism sector), account for the largest share of water consumption (50% of water consumption in 2003). Water service providers (Water Utilities Corporation -WUC, Department of Water Affairs-DWA and the District Councils-DCs) provide less than half of total consumption (CAR and DEA, 2006) but WUC however doubled its production since 1992. Through the on-going Water Sector Reform, WUC has expanded its mandate to take over water service provision.
Table 13: Water consumption by sector (1990-2003; Mm3 )
User category 1992 1996 2000 2003
Agriculture 72.9 70.6 76 63.4
Mining 12.8 14.4 24.1 26.8
Manufacturing 3.9 2.1 4 5.1
Water + electricity 0 0.8 0.5 0.7
Construction 0 0.4 0.4 0.4
0
5
10
15
20
25
30
35
1990 1991 1992 1993 1994 1995 1996 1997 1998 1999 2000 2001 2002 2003
Domestic Government Industrial Total

Final Report WAVES Botswana Preparation Phase
56 | P a g e
Trade 0.2 0.7 1 1.2
Hotels and restaurants 0.2 0.5 0.8 0.8
Transport and communication 0 0.2 0.2 0.3
Insurance, banking, business 0 0.5 0.7 0.8
Social and personal services 0 1.2 1.7 2.4
Government 8.7 8.8 11.1 11.5
Household use 36.1 41.1 48.1 56.9
WUC private sector 7.7 0 0 0
Total 142.5 141.3 168.6 170.3
Source: DEA and CAR, 2006 Wastewater use is confined to re-use, recycling, discharges into the environment and losses during processing. According to CAR and DEA (2006), wastewater is mostly lost in the production system and this accounted for 50% of the outflow (2003) from wastewater treatment works. Moreover, discharges into the environment are significant. Re-use of treated effluent is growing and in 2003 it represented 11% of the total outflow and less than 1% of water consumption. Re-use will increase in the future as the government has set an ambitious target of 96% re-use by 2030 and current initiatives strive to enhance re-use (e.g. draft Water Policy, IWRM and WDM Strategy). This would enhance potable water use efficiency and lead to significant economic savings in the water sector (suspending investments in huge water supply infrastructure).
B.3 Policies, legislation and institutional environment The water sector is characterised by incomplete, fragmented and outdated policy and legislative framework. The Acts (Water Act 1968, Water Works Act 1962, Water Utilities Corporation (WUC) Act 1970 and the Borehole Act 1956) are over forty years old and thus outdated (briefly summarised in table 3). They do not incorporate recent IWRM concerns and are not consistent with current world water sector trends. There is no comprehensive water management policy. Policy statements are scattered over the National Development Plans and the Water Master Plans (1991 and 2006). There is also the Draft National Water and Wastewater Policy which attempts to integrate the principles of IWRM. It is worth noting that the policy has been in draft form for several years.
Table 14: Details of the existing water laws in Botswana
Act Details Comment
Water Act, 1968 • Controls water resources use and presents an institutional framework for water allocation; • Ownership of public water by the state; • Everyone has the right to water for drinking, washing, cooking, livestock; • A water right is required to extract water : divert water, dam construction, water storage,
use and effluent discharge into public water; • Possession of water rights does not necessarily mean that the amount of water is always
available; • Provision to cancel the water quota if the available water resources do not meet current
demand, if the right is not used within 3 years.
• Water quality issues are limited;
• Due to lack of monitoring it is likely that users abstract more than they are legally entitled to and beyond the rate of recharge, particularly for groundwater resources.
• Transboundary water use and management are not catered for;
• IWRM is not addressed. • Lacks detailed water
pricing principles
Water Works Act,
1962
• Provision for gazetted water works areas; • These areas should have a designated water authority, e.g WUC who has the right to take
water, construct, make, purchase or take over all water works within the boundaries of the water works area and is also responsible for water supply;
• Water charges should relate to the water consumed and metered readings;
• Monopoly of water supply • Lacks detailed water
pricing principles

Final Report WAVES Botswana Preparation Phase
57 | P a g e
• Minister approves water charges
WUC Act, 1970 • WUC is responsible for bulk water supply or in water works areas where it is given authority;
• WUC will take necessary measures to ensure adequate water supply in areas of operation; • WUC should operate commercially and generate revenues for the agency.
• Lacks detailed water pricing principles
Boreholes, 1956 • Permission to develop a borehole should be sought from the Geological Surveys authority • Geological Surveys keeps a registry of boreholes in the country. The department can at any
point, access any borehole for inspection, water sampling, pump tests and is expected to keep records of these.
The 1991 and 2006 Water Master Plans have guided the country’s water resource management over the last two decades. The 1991 Plan was focussed on water supply measures whilst the 2006 Plan calls for a shift towards IWRM and emphasises on water demand management (CAR, 2010). The latter addresses policy gaps, particularly with respect to water demand management, water allocation, and productive water provision outside urban areas, re-use and recycling of wastewater (SMEC et al., 2006). The 2006 Plan made important recommendations for the water sector and can be viewed as Botswana’s (general) IWRM strategy. It is noteworthy to mention that the 2006 plan calls for the reform of the water sector hence the on-going Water Sector Reform Project (WSRP). The main objective of the water sector reforms project is to reform Botswana’s water and sanitation sectors by 2014. WUC now has the overall water supply responsibility and will assume responsibility for wastewater treatment and management as well. DWA will be responsible for overall planning, developing and managing water resources. The water sector reforms also seek to establish the Water Resources Council which will be an independent body associated with the Ministry of Mineral, Energy and Water Resources. The Council will be charged with issuing directives and being responsible for monitoring the national water resources and water balance, allocating water resources among users, and guiding the development of water resources policy (2010 Draft Water and Wastewater Policy). This authoritative body will replace the Water Apportionment Board. The Regulator will also be established and will ensure financial sustainability and determine requirements to inform regular tariff adjustment and customer related issues. This authoritative body would also cover other sectors such as energy. In addition to changes in institutional roles, the reform involves reviewing water laws and finalising the draft Water Policy.
B.4 Available data and gaps Through the Water Accounting Programme, several data were collected. Available data is with regard to WUC: annual water consumption; dam capacities, actual storage, abstraction as well as evaporation rates; tariffs; billing records. However the data is incomplete and needs to be updated. With regard to DWA, the following data exist: annual categorised production, consumption and losses data; water abstraction for major well fields (WELLMON database) and expenditures and revenues (insufficient). Data gaps include: Operation and maintenance costs; capital costs, revenues, water consumption by other villages. However, through the 2006 NWMP, demand forecasts for most villages in the country are available. Data on groundwater stocks and abstractions is also limited. There is no comprehensive information about the total volume of groundwater, e.g. water stored in aquifers an well fields is insufficient. Finally, there are no records of village water consumption. The water accounts used the method of per capita water consumption based on population figures and projections as well as average per capita daily water use. Data is also available from the Village Water Monitoring project. There is no information about how much water is used for domestic consumption, schools & clinics, offices, local government, livestock water, and other uses. Data on costs and revenues is also not available. Self providers Livestock: data on actual water use is not available. However, water use has been estimated (Water Accounts) based on livestock numbers and daily water requirements by livestock species. National livestock numbers are available from the agricultural statistics (1980-2006). There are gaps in some years (1991, 1992, 1994, 2000, 2001 and 2005). Data is also weak on the sources of water for livestock farming. Data is not available for dams constructed by the Ministry of Agriculture. Irrigation: Actual irrigation water use is unknown. Data is needed on the irrigated area, water sources, crops under irrigation and irrigation water use. Mining: Reported water use from each mine (source: mines and WUC). Water costs can be attained from the mines.
Final Report WAVES Botswana Preparation Phase
58 | P a g e
Wildlife: National head is known, water requirements by species (literature and CORBWA study) can be attained. Environmental water use is not known. Wastewater The Councils dealing with wastewater treatment work have data on expenditures on sewerage and the plants. The national Master Plan for Sanitation and Wastewater provides (2001) information on WWTWs (capacities, use, planned projects); Population data is available from CSO. The unit price of treated wastewater for given WWTWs is known. However, there are gaps in inflows and outflows from the plants, no data on capital costs and the available operation and maintenance costs are not complete.
B.5 Resource use and supply issues
B.5.1 Supply
• There is high variability of annual run-off related to highly variable rainfall patterns. This limits the safe yields of available reservoirs;
• The country is characterized by a growing spatial mismatch between water resources (mostly in the north) and water demand (mostly in the south-eastern parts);
• Botswana has limited groundwater resources and high variations in recharge rates. In the western and northern parts of the country, the problem is extreme and where available, the water is often saline;
• Most surface water resources are subject to the SADC Protocol on Shared Water Courses, and need to be shared in a fair, equitable and sustainable manner with other riparian states;
• There are high water losses from the supply systems and these vary considerably between water providers, WUC and DWA. WUC estimates water losses in its water supply system at 22% or 6.5Mm3 (CAR, 2010);
• The costs of traditional water supplies are escalating. Water transfer schemes have also proven to be costly and further developments/expansion of supply will require huge investments;
• The water supply mandate of WUC has been expanded through the current water sector reform process. There are concerns as to whether the utility will be able to deliver fully on this mandate in ensuring adequate water supply to all towns and villages in the country and doing so in an efficient manner.
B.5.2 Demand
• There is rapid growth in water demand of households, government and the mining sector, urban and rural areas as well. Higher welfare, population growth and economic growth will further increase water demand unless water efficiency is successfully increased;
• Demand is expected to rise fast in future due to new mining developments, electricity expansion and possible projects such as the Zambezi Integrated Agro-Commercial Development Project;
• Groundwater depletion in mining areas and around settlements. Current levels of groundwater abstraction are unsustainable as they often exceed recharge;
• There is limited use of non-conventional sources of water such as rainwater harvesting and re-use/recycling of treated wastewater. Limited use is partly due to lack of information and education about re-use and recycling of wastewater. However, re-use of treated effluent for agriculture is in principle good, but the production and product quality are unclear.
Generally, progress in policy and legislative development as well as implementation is slow. Furthermore, while the government appreciates the importance of IWRM, implementation is lagging behind and stakeholder participation is limited as is attention on gender and cross cutting issues. Some of these challenges are being addressed through implementation of the 2006NWMP, WSRP and the on-going development of the National IWRM-WE Plan.

Final Report WAVES Botswana Preparation Phase
59 | P a g e
B.6 Activities and priorities for WAVES The Botswana Water Accounting programme was established through the Department of Environmental Affairs (formerly National Conservation Strategy Agency and recently Department of Water Affairs have been involved in the programme. The accounts are available for the period 1990 to 2003 with an inclusion of wastewater resources. Despite this commendable effort, several challenges and data inadequacies were encountered and through WAVEs, this could be addressed. The following activities are proposed:
3. Update the water accounts Stock and supply accounts:
• Reservoir Inflow and outflows – natural inflows, inflows from other dams and recycled treated wastewater water flows;
• Water losses from the water supply systems; • Dams developed and operated by Ministry of Agriculture should be included in the
accounts; • Surface water stocks. The available stock accounts need to be strengthened. In addition,
accounts for rivers/lakes should be developed and should be separated into domestic and international rivers;
• Groundwater stocks to be expanded to include volumes stored in aquifers and recharge rates should be estimated;
• Wastewater supply accounts need to be updated;
Monetary aspects: • Capital costs ( reservoirs, groundwater sources, WWTWs) • Recurrent (operations and maintenance)costs and well as wastewater treatment costs; • Revenues (DWA, WUC)
4. Other accounts Accounts for Okavango, Chobe or Limpopo rivers. Studies on the Okavango have been
conducted (e.g. EPSMO) and some are on-going (Water Audit study). This would produce essential information necessary for development of the accounts.
The priority for WAVES would be to institutionalise water accounts at DWA and to collect missing data so as to update the current accounts. Data for the monetary accounts is crucial.
References DEA & CAR, 2006. Water Accounts of Botswana (1992-2003). Report prepared by DEA in association with CAR, DEA-Gaborone, Botswana. CAR, 2010. National Scoping Study for Botswana IWRM-WE Programme, report prepared for Kalahari Conservation Society, Gaborone, Botswana. Lange,G.M. and Hassan, R. (eds.), 2006. The economics of water management in southern Africa, pp.15-43. Edward Elgers. New York. Parida, B.P. and Moalafhi, D.B., 2008. Regional Rainfall Frequency Analysis for Botswana Using L-Moments and Radial Basis Function Network. Physics and Chemistry of the Earth, Parts A/B/C, Volume 33, 8-13, 2008, 614-620. SMEC et al, 1991. Botswana National Water Master Plan. Government of Botswana. SMEC (in association with EHES), 2006. National Water Master Plan Review; Final Report, Prepared for the Department of Water Affairs, Ministry of Minerals, Energy and Water Resources, Gaborone, Botswana. World Bank 2009. Technical Assistance for Reform of the Water and Sanitation Sector, Volume 1; Main Report.
World Bank, 2010. Botswana Climate Variability and Change; Understanding the Risks. Draft Policy Note. World Bank.

Final Report WAVES Botswana Preparation Phase
60 | P a g e

Final Report WAVES Botswana Preparation Phase
61 | P a g e
Appendix C: Energy resources
C.1 Introduction Energy is an essential resource both for production and provision of goods and services. It is therefore a key resource to human beings and all living creatures on earth. In Botswana, it has equally played and continues to play a crucial role in livelihoods security and economic growth. Its importance therefore cannot be over-emphasised. Briefly, its role in Botswana‘s economy is outlined below (EECG, 2003; and MFDP, 2010):
• Energy resources’ contribution to national Gross Domestic Product and employment is phenomenal. In According to NDP 10, their contribution increased from 1.4% to 1.9% during NDP 9;
• Energy is an input into all productive sectors hence has an impact on the overall production cost and enhances economic competitiveness of industry;
• Energy is important to the welfare of communities as it is required for cooking, heating and lighting. In addition, vulnerable households spend a significant amount of their income on ensuring that their energy needs are met. According to EECG, 2003, about 20% and 30% of income derived by poor urban and rural households is spent on acquiring energy for various purposes;
• The importance of energy efficiency is receiving international attention largely due to both economic and environmental benefits associated with utilising less energy, producing more with less inputs and exploiting use of renewable energy sources among others. Being energy efficient can improve Botswana’s economic competitiveness in the long run;
• The production and consumption of energy can have negative impacts on the environment at both local and globalised levels. The sector contributes largely to the production and emissions of Green House Gases (GHGs) which are associated which global warming. It is therefore imperative to keep track of the available GHG in the country and their emission levels;
• Energy drives education and modernization through lighting of education facilities, appliances and information exchange devices such as television and radio;
• The health care system of the country is largely dependent upon electricity since most appliances used in the sector require provision of power hence essential to the welfare of the communities.
Both traditional and conventional energy sources are used in Botswana. The most prominent traditional source is fuelwood while the modern sources are many and vary from sector to sector. The main conventional sources of energy include grid electricity, gas (LPG), paraffin, petroleum products such as petrol and diesel as well as coal. The use of renewable energy sources such as solar, bio fuels and biomass is limited but it is the government’s intention to increase the use of these resources during NDP 10 (MFDP, 2010).
C.2 Resource supply trends Electricity Electricity production in Botswana is dominated by Botswana Power Corporation (BPC), which is a parastatal and operates a 120MW coal fired power station in Morupule. The Morupule Power Station provides approximately 20% of the country's power requirements, while 80% has to be imported from the Southern African Power Pool (SAPP), mostly from Eskom, the South African power utility. However, the region has been experiencing power supply shortages, Botswana affected as well, and this has led to reduced power imports from Eskom (only 250MW) while additional imports of 90MW from Mozambique have been opened. In addition, the planned Morupule Power Station expansion is expected to provide 600MW of power by 2012 (Phase 1) hence replacing most of the imported electricity (MFDP, 2010; and MMEWR, 2010). Phase 2 of the project will double the installed capacity to 1,320 MW. The Mmamabula energy supply project will further generate 2 400MW of power to Botswana (this project is under development). There are a number of Independent Power Producers (IPPs) and the most prominent are BOTASH and DBES. Total electricity generated was 991,137 MWh in 2004 and went up to 1,082,036 MWh in 2005 (Environmental Statistics, 2006). These included capacity generated by both BPC and BOTASH. In 2007 and 2008, electricity contributed 20.6% and 16.6% (Table 1) to the total Primary Energy Supply -PES (CSO, 2011). PES is the total energy that is available for domestic production of energy. The government has embarked on the Rural

Final Report WAVES Botswana Preparation Phase
62 | P a g e
Electrification Programme (RED) which is meant to increase access and utilization of electricity by the rural dwellers. This has led to an increased uptake of electricity from 26% in 2004 to 56% in 2009 (MMWER, 2010). Table 15: Total Primary energy supply in kilo tons of oil equivalent (2007 and 2008)
Source 2007 2008
Coal 505.816 485.929 LDG 6.534 35.916 Petrol 343.057 381.59 Aviation gasoline 2.252 2.433 Gasoline type Jet Fuel 6.09 Kerosene type Jet Fuel 8.388 10.04 Paraffin 13.191 8.205 Diesel 124.302 427.631 Residual fuel oil 16.164 8.808 Lubricants 12.47 15.118 Electricity 267.864 276.602 Total supply 1,300.038 1,658.362
Source: CSO, 2011
Coal
Botswana has abundant coal reserves (over 212,383 million tonnes; refer to Table 2) of which 48,576 million tonnes are classified as measured, indicated or inferred reserves and the rest are speculative and hypothetical resources (EECG, 2003; and CSO, 2008). There is only one operating coal mine (Morupule Coalfield) and local production is below a million tons. In 2005, the mine produced about 985 000 tonnes of coal (CSO, 2006). More than half of the coal produced locally is used to meet the country’s electricity needs hence BPC is the major consumer. The second largest consumer is BOTASH and uses it for electricity generation for own utilization. The locally produced coal has high ash content hence it is of low quality. For this reason, the country has to import higher-grade coal for use in some industrial activities. To improve the quality, a coal washing plant with a capacity of 40 000 tonnes per month was developed in 2008. Moreover, to increase accessibility of the resource, two coal depots are currently being established in Kang and Ghanzi (MFDP, 2010). Table 16: Estimated Botswana Coal Inventory (million tons)
Measured Indicated Inferred Hypothetical Speculative Total
Morupule 2,846 2,706 4,272 4,851 3,397 18,072 Moijabana 2,406 648 3,054 Mmamabula 494 20,215 2,504 23,213 Letlhakeng 7,213 23,340 39,800 70,353 Ncojane 2,025 2,700 4,725 Dukwi 32 1,572 1,604 Mmamantswe 598 2300 2,898 Serule 307 1,341 1,766 6,270 9,684 Dutlwe 2,070 60,875 8,795 71,740 Foley 6,860 6860 Bobonong 179 179
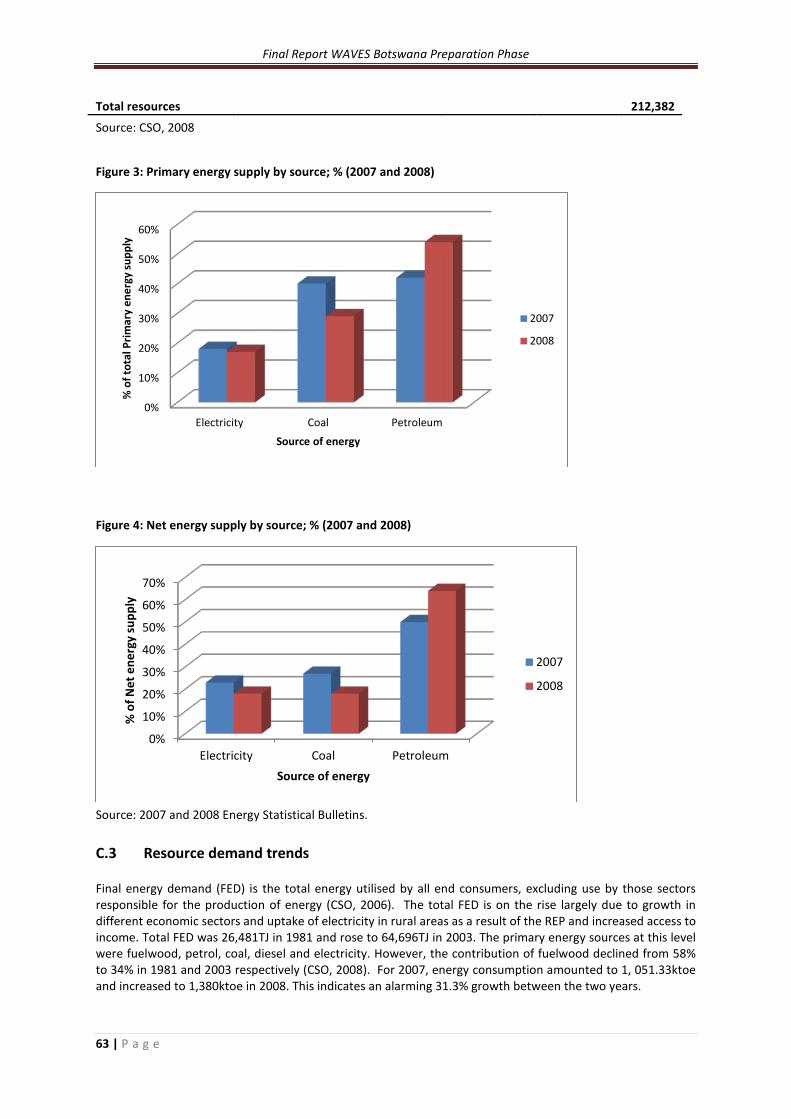
Final Report WAVES Botswana Preparation Phase
63 | P a g e
Total resources 212,382
Source: CSO, 2008
Figure 3: Primary energy supply by source; % (2007 and 2008)
Figure 4: Net energy supply by source; % (2007 and 2008)
Source: 2007 and 2008 Energy Statistical Bulletins. C.3 Resource demand trends Final energy demand (FED) is the total energy utilised by all end consumers, excluding use by those sectors responsible for the production of energy (CSO, 2006). The total FED is on the rise largely due to growth in different economic sectors and uptake of electricity in rural areas as a result of the REP and increased access to income. Total FED was 26,481TJ in 1981 and rose to 64,696TJ in 2003. The primary energy sources at this level were fuelwood, petrol, coal, diesel and electricity. However, the contribution of fuelwood declined from 58% to 34% in 1981 and 2003 respectively (CSO, 2008). For 2007, energy consumption amounted to 1, 051.33ktoe and increased to 1,380ktoe in 2008. This indicates an alarming 31.3% growth between the two years.
0%
10%
20%
30%
40%
50%
60%
Electricity Coal Petroleum
% o
f tot
al P
rimar
y en
ergy
supp
ly
Source of energy
2007
2008
0%
10%
20%
30%
40%
50%
60%
70%
Electricity Coal Petroleum
% o
f Net
ene
rgy
supp
ly
Source of energy
2007
2008

Final Report WAVES Botswana Preparation Phase
64 | P a g e
a. Household sector Households account for the largest energy consumption in Botswana. This is mainly attributed to use of fuelwood as the principal source of energy for major household activities such as cooking, lighting and heating. The sector contribution to annual FED in 1981 to 1997 was 45% and contribution dropped to 38% in 2003 (CSO, 2006). Despite this decline, the sector still remained the largest energy user in the given period. In 2007 and 2008, households accounted for 6.6 and 6.7% of total energy consumption. These estimates did not however consider traditional energy sources’ utilisation. The 1991 and 2001 and 2008 population estimates indicate a growing trend in the number of households with access to different energy sources as shown in Tables 18 and 19. There is a decline in the proportion of households using fuel wood as a source of energy for both lighting and cooking. This is accelerated by decreasing number of households in rural areas and increased access to disposable income by populations in urban centres as they can now afford conventional energy sources such as gas and paraffin. Although its use has declined over the years, paraffin remains the major energy source for lighting. Although, government has made considerable progress in enhancing access to electricity by all, MMWER (2010) alludes that electricity connections in rural areas still remain below target. This is because the initial costs of connections and purchase of appliances is probably high more the low income earners. Table 17: Proportion of households in urban and rural areas by energy source for lighting
1991 2001 2008
Energy source total urban rural total urban rural total urban rural Electricity 10.1 17.5 2 24.8 37 8.1 43.1 33.5 9.6 Solar 0 0 0 0.2 0.1 0.4 1.4 0.9 0.5 LPG 0.8 1.2 0.3 0.5 0.7 0.4 0.2 0.2 0 Biogas 0 0 0 0.1 0.1 0.1 Fuel wood 11.4 0.8 23.1 5.6 0.6 12.5 3.1 0.1 3 Paraffin 64.5 65.7 63.1 53.4 49.2 59.2 Candle 11.8 14.1 9.3 8.6 7 10.9 Paraffin/candle 0 0 0 6 5.2 7.1 50.9 22.2 28.7 Other 1.4 0.7 2.1 0.6 0.1 1.3 0.3 0.9 Not stated 0 0 0 0.1 0.1 0.2 0 0 0 Table 18: Proportion of households in urban and rural areas by primary energy source for cooking
1991 2001 2008
Energy source total urban rural total urban rural total urban rural Electricity 2.7 4.8 0.3 4.86 7.6 1.08 11.2 9.2 2 Solar 0 0 0 0.19 0.28 0.08 0.4 0.3 0.1 LPG 21.6 35.6 6.3 40.59 57.65 17.01 41.9 32.8 9.1 Biogas 0 0 0 0.57 0.66 0.44 Fuelwood 64.3 40.6 90.6 45.72 22.83 77.34 43.5 12.4 31.1 Paraffin 10.7 18.2 2.5 7.53 10.47 3.47 2.4 2 0.4 Cow dung 0 0 0 0.11 0.02 0.23 Coal 0.1 0.1 0.5 0.12 0.12 0.11 0.2 0.1 0.1 Crop waste 0 0 0 0.08 0.1 0.06 Other 0.6 0.6 0 0.11 0.12 0.09 0.1 0 0.1 Not stated 0.12 0.14 0.1 0.3 0.2 0.1

Final Report WAVES Botswana Preparation Phase
65 | P a g e
Sources: 1991 and 2001 Population and Housing Censuses; and CSO, 2011
b. Transport sector The dominance of the transport sector in energy consumption is growing at a faster rate. The sector’s contribution to total FED rose from 13% in 1981 to 49% in 2008. The sector is solely reliant upon petroleum products particularly petrol and diesel. Petrol accounted for approximately 100% in the energy consumed in this sector. The importance of transport in economic development and livelihoods improvement cannot be overemphasised hence its high contribution to total FED. By and large, petrol and diesel use is an important part of the country’s energy profile. However, because these fuels are mostly imported and are subject to price variations, efficiency in the utilisation of these resources is therefore critical.
c. Industry The industry sector contributed some 24.9% and 37.2% to FED in 1981 and 2008 respectively. Production of goods and services in the industry sector is highly dependent on energy consumption. Energy use has increased largely due to expansion of industrial activities and increasing population demand (CSO, 2006). The mining sub-sector continues to dominate electricity consumption and is also the largest consumer of coal. However, with the country’s strategies to diversify the economy, the demand for power might change to the manufacturing sub-sector. Figure 5: Final energy consumption by sector; 1981, 1991, 2001 and 2008 (%)
Source: CSO, 2006 and Department of Energy Affairs, 2008
C.4 Energy related policies, Legislation and Institutional Framework Botswana’s energy sector developments are guided by Botswana Energy Master Plans (BEMP) and successive National development plans (NDPs).
According to NDP10, the energy sector aims to provide adequate and reliable supplies of energy at minimum costs, and to utilize energy resources sustainably. NDP 10 therefore recommends the following strategies:
0
10
20
30
40
50
60
households Transport Industry Others
% c
onsu
mpt
ion
Consumer sector
1981
1991
2001
2008

Final Report WAVES Botswana Preparation Phase
66 | P a g e
The first BEMP was developed in 1985 and revised in 1996 and 2003 in light of changing domestic and global energy challenges. The 2003 BEMP takes into consideration the country’s socio-economic goals and environmental goals as specified in NDP 9 and Vision 2016. The plan therefore focuses on a number of policy issues and identifies priority strategies for implementation in-order to address these issues. These are:
• Integrated Energy Planning (IEP); • Demand sectors; • Supply sectors (electricity, oil and gas, biomass, coal and renewable energy resources); • Energy efficiency; • Cross cutting issues such as environmental management, HIV/AIDS, education and gender; and • Issues related to governance and regulation in the energy sector.
The 2003 BEMP adopts the IEP approach to guide the sector and this is “a planning process which aims for least cost development path for the energy sector to guide policy making and implementation” (EECG, 2003; pp 14). IEP therefore emphasises integrated resources planning and calls for a balance between demand and supply and their management options. It further considers energy linkages with broader economic developments, environmental and economic costs and benefit and calls for need to enhance institutional capacity so as to implement IEP. IEP implementation is however currently limited because of inadequate energy data and insufficient capacity within the Department of Energy Affairs. Regarding demand, the plan addresses household poverty in particular promoting measures to adopt cleaner production technologies and utilisation of modern energy sources. It also emphasises fuel demand management in the transport sector which is the largest consumer of petroleum products in the country.
Box 1: NDP-10 Energy Strategies
• Infrastructure development for electricity: self sufficiency with exports of electricity; methods will be sought to supply rural electricity through affordable technologies;
• Energy conservation and demand management: energy efficient buildings and equipment, policy for energy demand management (EDM), including pricing. The target is to limit energy consumption growth to 5-6% per annum;
• Promotion of renewable energy sources: possibility of a solar thermal power station; enforcement of renewable energy use in government institutions and greater private sector involvement;
• Reduction of dependency on petroleum product imports: diversification of supply routes to reduce the dependency on South Africa; development of additional storage capacity and a cross border fuel pipeline.
• Bilateral and regional cooperation agreements are seen as critical part of the energy strategy. Botswana is part of the Southern African Power Grid.

Final Report WAVES Botswana Preparation Phase
67 | P a g e
The plan stipulates ways of achieving sustainability and security in electricity supply amid high electricity imports and power shortages throughout the region. It also aims to enhance BPC financial performance and the rural electrification programme as well as the use of off-grid generators. Furthermore, BEMP promotes the use of renewable energy sources particularly solar. The plan recognises the current minimal uptake of solar but appreciates that government institutions have adopted solar technologies especially in employees’ housing facilities. It is important to note that the plan recognises the need for Botswana to take advantage of existing regional and international developments in renewable energy. This could be achieved through tracking trends and experiences from other countries and being signatories to energy bilateral and multilateral agreements to guide developments in the sector. Energy efficiency and conservation are essential in light of severe power shortages affecting Botswana and the SADC region as well as increasing petroleum product prices exacerbated by growing demands and limited supply. BEMP therefore calls for energy efficiency measures such as replacing incandescent lamps with compact fluorescent lamps as well as public awareness campaigns. BPC has already made efforts in raising awareness and freely installing energy saving lamps in households throughout the country. The plan highlights the need to develop guidelines for energy efficient building design and these have been developed (2008) and will be implemented in NDP 10. The plan also takes cognisance of the limited institutional capacity especially within the Department of Energy Affairs which will hamper sector developments if not addressed. It therefore promotes capacity building initiatives to enable institutions to be better placed to implement sector goals and objectives. All the issues and strategies identified in the plan paved way for the development of the National Energy Policy (NEP) which considers sectoral changes, dynamic and evolving national, regional and international energy challenges that require an overarching policy direction. The NEP is currently in draft form and requires finalisation. The draft policy aims to “meet the energy needs of Botswana for social and economic development in a sustainable manner” (pp 3). The NEP therefore specifically aims to achieve the following objectives:
• Enhancing sustainable economic growth by promoting competition, efficiency and investment in the sector thus achieving poverty reduction;
• Increasing access to affordable energy services to all sectors; • Improving institutional arrangements and governance in the sector; • Improving capacity within the sector; • Improving the quality of and access to energy information; • Managing energy related environmental and health impacts; • Improving energy security particularly through supply diversity, regional cooperation and trade; • Gender mainstreaming and consideration of socio-economic status in planning and development.
The policy addresses these objectives by stipulating several related strategic goals for implementation. It calls for the development of an independent energy regulator and establishment of legislative laws to implement and enforce the policy. The policy is commendable but will require finalisation in-order for the strategies to be implemented. It also needs to consider regional and international issues and agreements and how the policy will be harmonized with these agreements. The sector is operated mainly by government and participation of other ministries, parastatals, private companies and the civil society. The Department of Energy Affairs under MMEWR has the overall responsibility for formulation, coordination and direction of policy as well as supervising BPC. Other key players include:
• BPC – generation, distribution and supply of electricity; • Subsidiary multinational oil companies for the supply and distribution of petroleum products; • BOTASH and DBES; • Rural Industries Innovation Centre for developing and dissemination of energy technologies; • Botswana Technology Centre for research and development and information dissemination especially
in relation to solar power;

Final Report WAVES Botswana Preparation Phase
68 | P a g e
• Ministry of Environment, Wildlife and Tourism through environmental conservation measures, research on fuel wood, productivity of natural woodlands and implementation of wood resources programmes.;
• Ministry of Local Government and Ministry of Education and Skills Development for off-grid power supply, installation and maintenance of solar power equipment;
C.5 Available data and data gaps There is insufficient data and information on energy resources especially regarding traditional energies such as biomass and fuelwood resources as well as the uptake of solar energy. The energy resource has not been adequately assessed, and have not been fully characterised. This has hampered full exploitation of the resources especially with regards to coal. In terms of the energy balances, CSO has compiled energy statistics for the year 1981 to 2003 and 2007-08. Information relates to final and net energy demand and supply in terms of energy source and user sector. Information is comprehensive for the electricity resource. However, the availability and uptake of solar energy are not adequately documented. Moreover, biomass data are lacking. For instance, activities to enhance the availability of fuelwood are not documented hence this hampers information on the resource base. In addition, information on the rate of depletion of fuelwood in Botswana is lacking. There is data on the production of GHG and related emissions as well as the sources of these emissions. Data is also available on fuel prices and are up to date. It is not known as to whether the information is available in a computerised format. The data referred to above is captured in the statistical reports (CSO, Department of Energy Affairs and BPC).
C.6 Resource use and supply issues
• The main concerns with energy supply and demand are inadequate security and reliability of power supply to all end users. This is because Botswana highly relies on imports from foreign countries and this is often associated with high costs. In addition, the region is currently faced with power shortages therefore imports from ESKOM have reduced thus affecting the reliability of power supply from this utility.
• Botswana does not have sufficient oil reserve storage capacity (currently below 90-day supply level). This may hinder immediate supply and distribution to other parts of the country hence affecting economic activities.
• Fuel wood resources are being overharvested and in some areas there is woodland degradation. Although government is seeking ways to reduce use of these resources, several households especially the rural poor are highly affected because of reduced supply.
• There is need for participation of locally owned companies in the petroleum industry to increase production and distribution of petroleum products. The limited private sector participation is caused by poor pricing mechanisms and uncompetitive prices. This sector is still dominated by multi-national oil companies.
• The poor quality of Botswana’s coal has led to dependence on imported coal from other countries and underutilisation of the available resources which are in abundance. There is therefore need to adopt highly efficient coal cleaning technologies and promote uptake of coal especially in the domestic sector.
• There are environmental concerns associated with Morupule B and Mmamabula projects which will lead to a significant increase in water consumption (4-8 MCM p.a. or 2-4% of the national consumption) (World Bank, 2010-unpublished). This will thus insert more pressure on water resources and requiring wise water allocation and management.
• There is a likelihood of increased carbon emissions from the coal plants hence the country’s contribution to climate change will rise. Phase 1 of Morupule B project is expected to increase per capita carbon emission to 8.7 tons, which is slightly above the world average and to nearly 17 tons

Final Report WAVES Botswana Preparation Phase
69 | P a g e
with Mmamabula and Morupule B phase 2. World Bank (2010, unpublished) alluded that this figure would be highest in Africa and one of the highest in the world.
• Environmental impacts associated with the transport sector are significant. These include oil spills, indiscriminate disposal of used oil and vehicular pollution.
• There is underutilisation of renewable energy sources such as solar. This is due to high costs associated with solar power equipment, limited technical skill to service solar technology, perceptions of the public and other end users. Govt needs to link up with solar companies to tap on the available solar energy by investing in solar energy technology. This would enhance power availability, enhance energy efficiency and conservation of other energy resources. Solar energy yields minimal impacts on the environment as opposed to other conventional energy sources.
Despite its importance as a driver of economic growth in Botswana, the sector is still neglected in that there is no overarching guiding policy (currently being developed) and legislation to drive sector developments and programmes. Collection, analysis and dissemination of energy data is still poor and needs to be enhanced. Efforts should also be directed towards more research especially in developing and investing in appropriate technologies and appliances such as solar power and efficient coal equipment.
C.7 Possible phase 2 WAVES activities
The World Bank WAVES project can benefit Botswana’s energy sector through the following: • Development of energy resources accounts;
o Collection, update and analysis of available data on stocks and flows; o Analysis of data on resource availability by source/supply; o Analysis of resource use by sector and the intended purpose;
• The value of energy resources as capital or development assets; • Assess economic contributions of the sector to the national economy; • Assessing the sector’s impacts on environmental sustainability. For instance, information on the GHG
emissions could be updated and further assessed in economic terms; • Impacts of depletion of the resource and costs of abatement. There is therefore need collect
information from various stakeholders involved in mitigation, rehabilitation, and afforestation activities);
References (to follow)

Final Report WAVES Botswana Preparation Phase
70 | P a g e
Appendix D: Mineral resources sector
D.1 Introduction
The framework for quantification of mineral accounts involves three main components (DAE/CAR, 2007):
• Quantifying the major physical trends in resource stocks and changes therein for the major minerals; • Quantifying the major monetary trends in resource stocks and changes therein • Explore to what extent government has captured the benefits of mineral extraction for the country’s
development and growth
The availability of data under each of these headings is briefly assessed below.
The key minerals currently being produced in Botswana are:
• Diamonds • Copper & nickel (mined together, along with saleable quantities of cobalt, platinum and palladium) • Gold • Soda ash & salt • Coal • Semi-precious stones • Industrial minerals (sand, gravel, clay, crushed stone)
In addition, there are known to be deposits of coal-bed methane and uranium. Neither are currently being mined other than to establish reserves and feasible extraction levels.
There are various data sources that provide information on the relative economic magnitudes of the different minerals. National accounts data breaks down output (value added) in the mining sector into five activities: diamonds, copper-nickel, coal, soda ash and “other mining”. In 2010, diamonds accounted for 83% of mining output, copper-nickel 13%, with the remaining 4% accounted for by coal, gold, soda ash and industrial minerals. Export data also provides a breakdown across commodities, and provides a similar distribution; in 2010, diamonds accounted for 81% of the value of mineral exports, copper-nickel 16%, with approximately 2% each for gold and soda ash.
D.2 Mineral production, resources & reserves
The first step towards producing full mineral accounts is to establish trends in the stock of mineral assets in the ground. The stock of any mineral at the end of a given year depends on the opening stock (at the beginning of the year), depletion of the stock through mining, and additions to the stock through reserve discoveries or identification.
Unfortunately only one of these three variables is readily available: annual physical production levels (in carats, tonnes, kilogrammes or cubic metres), which are published for all of the above minerals in the Annual Reports of the Department of Mines. No comprehensive data are published for the stock of mineral reserves or for annual additions. However, some inferences can be made regarding known developments in each of the mining sectors.
Diamonds: the last known public data on the stock of diamonds was in a De Beers Annual Report in 1999, when the figure was 788 million carats (mcts). Since that time production (to 2010) has amounted to 312mcts, leaving a stock of 455mcts. Since that time there have been some new discoveries, but the additional stocks from the two new mines that are being established is only around 40mcts. The value of additional reserves/resources established by Debswana is unknown. But with production in the region of 30mcts a year, the known stock figures are consistent with a projected end-of-life for Botswana’s existing diamonds mines around 2030. Annual production is therefore consuming a significant proportion of the known reserves.
Figure 6: Projected diamond output to 2031

Final Report WAVES Botswana Preparation Phase
71 | P a g e
Source: MMEWA
Copper-nickel: information on copper-nickel reserves was published by the Department of Mines until 1987. Based on that information and known production data (approx 50ktpa), the reserves would have been exhausted by 2008. However, additional discoveries and reserve additions have taken place at the oldest mine (BCL Selebi-Phikwe) and newer producers including Tati Nickel and African Copper, as well as a mine currently under construction (Discovery Metals). The latter includes a substantial addition to reserves/resources (1.6Mt copper and 61moz silver). Tati Nickel (Norilsk) disclosed reserves/resources of approximately 1Mt each of copper and nickel) at as December 2009. Soda ash and salt: no information is available regarding the size of the reserves. Gold: no information is available regarding the size of the reserves. However, the one active mine is said to have only a few (<5) years of production remaining, so reserves are close to depletion. Coal: published data on coal reserves are old (1987) and then amounted to around 7 billion tonnes. With annual coal production currently in the region of 1 million tonnes (mt), coal is effectively a non-depleting resource. Since that time a great deal of further exploration has taken place and more recent estimates have placed Botswana’s coal reserves at over 200 billion tonnes. Even if coal production rises sharply, which is likely, for additional domestic and export power generation and for direct coal exports, annual production could reach 50-100mt, which is still small in relation to the level of reserves. The production of meaningful resource stock accounts is hampered by the non-availability of comprehensive stock data. With a high level of prospecting taking place and new mines opening, useful information on mineral reserve/resource stocks can be gleaned from the public documents that new mining companies are required to provide, for instance to stock exchanges as part of listing requirements. Hence the availability of resource estimates for the new and existing diamond and copper/nickel mines, and for some of the companies at an advanced stage of exploration for coal and uranium. However, this does not include information from existing producers that are not directly listed on a stock exchange (including the major mining companies Debswana, BCL, Morupule Colliery, and Soda Ash Botswana). Hence the publication of comprehensive stock data by the Department of Mines, as well as annual adjustments due to new discoveries etc., would be essential in order to produce comprehensive mineral stock accounts. Historically there has been some sensitivity over publishing reserve figures, in part due to the commercial confidentiality requirements entailed in the relationship between the Government of Botswana and De Beers (the shareholders of Debswana), which has been compounded by the traditional secrecy and almost complete lack of transparency in the global diamond industry. However, the world has now changed and expectations of transparency have increased – not least due to concerns over the corrupt use of revenues from oil and other mineral products. But even absent these concerns, conventional corporate governance criteria require

Final Report WAVES Botswana Preparation Phase
72 | P a g e
companies to be transparent about their assets – which is why listed companies must disclose resource estimates – and there is no obvious reason why countries should not publish aggregated resource information Box 2: Mineral Reserves and Resources
Although we can in principle talk about mineral stocks, depletion through production and addition through new discoveries, in practice the notion of the stock of mineral resources is somewhat more elastic than this. First, different deposits of minerals in the ground will be known with different degrees of uncertainty, and second, whether a given deposit is economically viable to mine will vary over time, depending on, inter alia, mineral prices. Stocks are conventionally divided into resources and reserves. Mineral reserves are known with some degree of certainty and are considered to be economically exploitable, although even then they are divided into proven and probable reserves. Mineral resources are known with less certainty and are not established as economically exploitable, and are divided into three categories, with progressively greater uncertainty: measured, indicated and inferred. For mineral stock data to be useful, it needs to be divided at a minimum into reserve and resource categories. Although the overall mineral stock includes both, this does not mean that this can all be mined. For instance, Discovery Metals Boseto mine reports that the ore body contains 1.56 Mt of copper. However, the mineral reserve includes only 300,000 tonnes of copper (20% of the total deposit). However, the mining plan anticipates production of 36,000 tpa of copper for 15 years – a total of 540,000 t of copper. So: (i) The mineral reserve is sufficient for a bankable feasibility study for the mine, even though it only covers 20% of the total deposit; (ii) As mining takes place, the company will invest in bringing parts of the deposit from the resource to the reserve category (iii) Perhaps one-third to one-half of the total deposit will eventually be mined
D.3 Monetary accounts The monetary mineral accounts have two major components (i) the calculation of economic resource rent, and (ii) changes in the monetary value of mineral stocks.
D.3.1 Economic rent The economic resource rent of a mineral represents the economic return that is earned from the extraction and sale of a resource over and above the economic cost of production. It occurs because minerals have scarcity value. Optimal policy towards the taxation of mineral products typically aims to secure the resource rent for the government (or nation) while leaving the mining company with sufficient return on capital to make the investment worthwhile (including a reward for risk), which is included in the economic cost of production. Although resource rent is a simple concept, calculating it in practice – and hence determining how much of the rent has accrued to the government and how much to mining companies – is not a straightforward task. Essentially it requires data on the gross operating surplus (equivalent to value added less wages) and capital stock. Neither are published by SB. Preferably these data should be available on a per-mineral basis, although a higher-level calculation could be carried out at the level of the mineral sector as a whole. In addition, the rent calculation requires a decision as to what is an acceptable rate of return on capital to be included in the economic cost. Resource rent calculations were carried out up to 2001, but are not available since. An updated calculation could be carried out up to 2006/7, at the level of the mining sector as a whole, using available data on capital stock and value added, and making use of an estimate of wages paid. Extending the series further would require more up-to-date data on capital stock.
D.3.2 Monetary value of mineral assets A crude estimate of the monetary value of mineral assets can be obtained simply by multiplying the physical volume of resources in the ground by the current value (e.g. in dollars/pula per carat or per tonne of nickel). The value of the asset would then decrease as resources are depleted and increase if prices go up. However this is not a very helpful approach to valuation, and does not help to provide information on the economic value to the country of mineral resources. The economic value is essentially the net present value of

Final Report WAVES Botswana Preparation Phase
73 | P a g e
the future economic rents that will be accrued from the exploitation of that commodity. This in turn depends on a variety of factors, notably anticipated future production levels, prices, and costs, and how these are expected to change over time. Although the mining companies would generally have such information – at least for a reasonable period into the future – it is not generally publicly available. Production of useful monetary valuations of mineral resources would require the active co-operation of Statistics Botswana (for information required to calculate mineral rent) and of the Department of Mines (for future production, cost and revenue profiles for different minerals).
D.4 Minerals and national wealth An important issue for mineral-based economies is the extent to which the wealth from mineral resources as they are extracted is converted to other forms of wealth. One possible principle is that as mineral assets are depleted, the proceeds are invested in other forms of assets, which could include physical assets (such as roads, schools, machinery etc), financial assets and intangible assets such as skills, institutions). Any country needs its asset base to grow over time if income is to also grow, but it is particularly important in developing countries where mineral assets may comprise a large proportion of total assets, that as minerals are depleted the proceeds are not (entirely) consumed but are invested in other assets. From the perspective of tracing developments in the proceeds of mineral assets, a country’s wealth may be conceived as comprising the following: • Mineral assets (in the ground) • Produced assets (belonging to government) • Produced assets (belonging to the private sector) • Financial assets The issues around the valuation of mineral assets have been discussed above. The value of produced assets can be estimated, in the absence of published capital stock data, by taking historical capital stock data, data on gross fixed investment (GFCF) from the national accounts, and an estimate of depreciation, and projecting a capital stock series forward from the historical starting point. However, this would not be capable of distinguishing between public sector and private sector assets, until a disaggregated capital stock series is produced by SB. Estimates of financial assets have to be measured differently. While there are data on various types of financial assets in the country (currency, bank deposits, shares, bonds etc.) these do not comprise net wealth as domestic financial assets are generally offset by equal liabilities to residents (e.g. if a company issues a share that is bought by a resident, the country’s wealth does not increase, even if the stock of financial assets is increased). A country’s financial wealth increases only if it accumulates assets abroad, representing the liabilities of non-residents (e.g. if a share issued by a foreign company is bought by a Motswana, that represents a net financial asset for Botswana). The country’s net financial position is represented by the International Investment Position (IIP), which records liabilities of non-residents to Botswana residents (individuals, companies and government), net of liabilities of Botswana residents to non-residents. Data on the IIP is published annually by the Bank of Botswana.
D.5 Government mineral revenues and investment The main channel through which mineral revenues are turned into investment that can preserve national wealth is through government. The effectiveness of this channel depends on two key questions:
- how much of the total mineral rent accrues to government? - how are the mineral revenues received by government spent?
The answer to the first question requires information on mineral rent, which, as noted above, is not readily available. Calculations up to 2001 suggested that government had been quite effective at capturing mineral rent, and it is likely that this situation has continued, especially since a more favourable revenue-sharing deal was negotiated with De Beers in the late 2000s. Information on mineral revenues received by government is readily available. Overall mineral revenues are derived from three sources: mineral royalties; taxes on mining company profits; and dividends from shares held in mining companies. Data on revenues received from royalties and dividends are published by the Department of Mines in their annual report. In 2009/10, the distribution of revenues received was as follows (again illustrating the dominant position of diamonds):
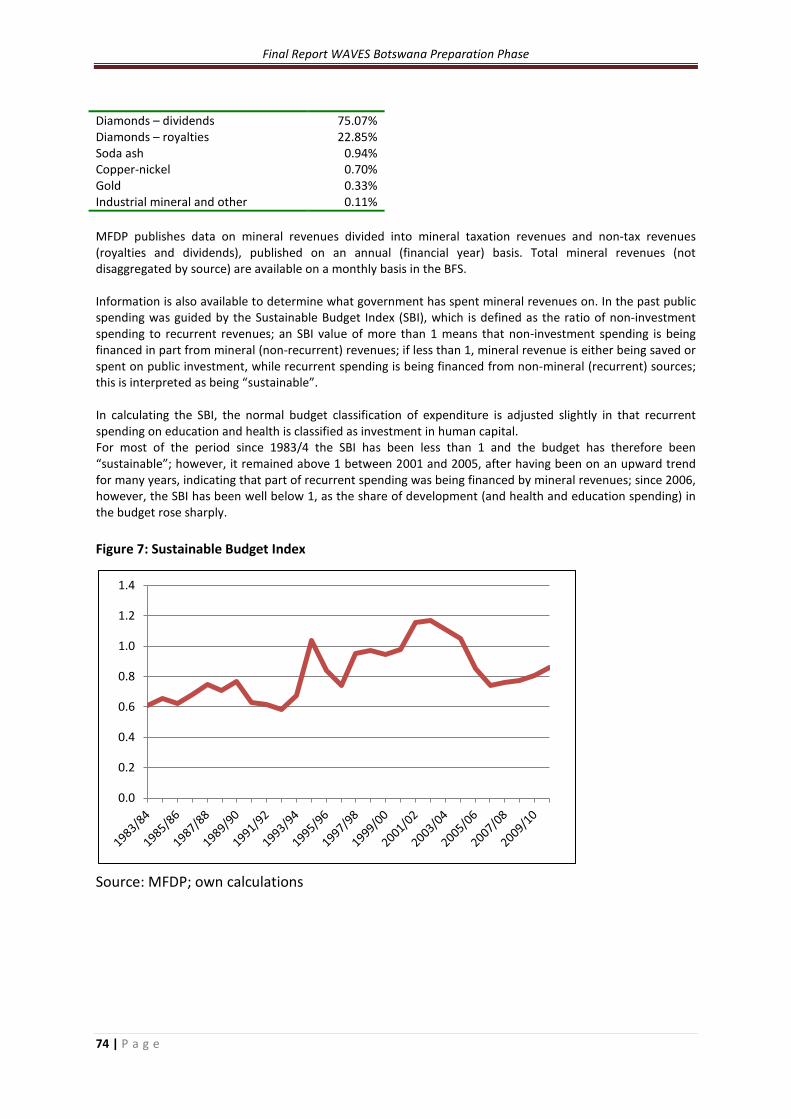
Final Report WAVES Botswana Preparation Phase
74 | P a g e
Diamonds – dividends 75.07% Diamonds – royalties 22.85% Soda ash 0.94% Copper-nickel 0.70% Gold 0.33% Industrial mineral and other 0.11% MFDP publishes data on mineral revenues divided into mineral taxation revenues and non-tax revenues (royalties and dividends), published on an annual (financial year) basis. Total mineral revenues (not disaggregated by source) are available on a monthly basis in the BFS. Information is also available to determine what government has spent mineral revenues on. In the past public spending was guided by the Sustainable Budget Index (SBI), which is defined as the ratio of non-investment spending to recurrent revenues; an SBI value of more than 1 means that non-investment spending is being financed in part from mineral (non-recurrent) revenues; if less than 1, mineral revenue is either being saved or spent on public investment, while recurrent spending is being financed from non-mineral (recurrent) sources; this is interpreted as being “sustainable”. In calculating the SBI, the normal budget classification of expenditure is adjusted slightly in that recurrent spending on education and health is classified as investment in human capital. For most of the period since 1983/4 the SBI has been less than 1 and the budget has therefore been “sustainable”; however, it remained above 1 between 2001 and 2005, after having been on an upward trend for many years, indicating that part of recurrent spending was being financed by mineral revenues; since 2006, however, the SBI has been well below 1, as the share of development (and health and education spending) in the budget rose sharply. Figure 7: Sustainable Budget Index
Source: MFDP; own calculations
0.0
0.2
0.4
0.6
0.8
1.0
1.2
1.4

Final Report WAVES Botswana Preparation Phase
75 | P a g e
Figure 8: Accumulated mineral revenues & public investment
Source: MFDP; own calculations
Although the SBI (and its corollary, maintenance of assets) is a convenient rule of thumb it is questionable whether a budget meeting the SBI is sustainable, for a variety of reasons:
o Investing in public assets is not in itself sufficient to ensure that the investment is productive and will generate a future income once minerals are depleted; some categories of “investment” spending are clearly economically unproductive (such as defence spending), and others are more appropriately considered to be “maintenance” of human capital (such as large portions of health expenditure, and spending on welfare programmes) that may well be justified for social reasons but do not add to the stock of capital in economic terms (any more than the maintenance of roads, while essential, can be considered to be net investment);
o Concerns have been expressed regarding the productivity and economic impact of many public investment projects; for compliance with the SBI rule to be effective in meeting its objectives it needs to be supplemented with effective project appraisal analysis, appropriate project selection and prioritization systems, and effective monitoring and evaluation; while these skills and processes may have been in place in earlier years, it is widely agreed that these disciplines have dissipated over the years; furthermore, while in the earlier years of mineral-financed spending economic and social needs largely coincided, in the later years many of the most important economic investment needs have been met and spending has been increasingly driven by social and political needs, often with minimal economic benefits;
o The SBI considers investment in aggregate (whether in physical, financial or human capital) and does not provide any useful guidance as to the distribution of public investment and assets across these different types of capital; in particular, it does not have any way of ensuring that public investment will be effective at generating future income when minerals are depleted, and therefore contrasts with alternative approaches that focus on the accumulation of sufficient financial assets (for instance in a sovereign wealth fund) that would be capable of yielding an annuity income to replace mineral income;
o The SBI does not address the fact that, due to the very high profitability of Botswana’s diamond mining and the very high revenue share accruing to government, the level of fiscal revenues (and spending) in Botswana relative to GDP has been very high, leading to a very large government sector in the economy; once diamonds are depleted, even if economic diversification is successful and new sources of growth are found, fiscal revenues will inevitably decline as a share of GDP and it will be necessary for government to shrink; from this perspective, therefore, simply adhering to the SBI does not mean that government is of a sustainable size.
0
50
100
150
200
250
300
350P
billi
on (r
eal,
2010
pric
es)
Education Health Infrastructure Mineral revenues acc

Final Report WAVES Botswana Preparation Phase
76 | P a g e
In recent years the SBI seems to have fallen out of use in government – for instance, it is not mentioned at all in NDP10 – and reference is made to other fiscal rules that do not address the application of mineral revenues to investment directly. Furthermore, increased attention has been paid – particularly by the IMF in Article IV reports and other economic assessments - to the non-mineral budget balance as an alternative indicator of sustainability, focusing more on the level of spending that can be financed in the absence of mineral revenues, rather than how mineral revenues are used – in other words looking forward more to the post-mineral era. Issues around government sustainability are important now that diamond reserves are projected to be depleted by 2030. Besides tracking whether government is using mineral assets to accumulate physical and human assets, it is useful to consider whether government is also accumulating net financial assets. To the extent that it does, these can be used to generate an income that may to some degree replace mineral revenues when minerals are exhausted. Botswana has never explicitly targeted the establishment of such a “Fund for Future Generations”. However, countries in the early stages of mineral exploitation are now typically advised to consider establishing such a fund, perhaps in the form of a Sovereign Wealth Fund, that can provide an annuity income (this is the approach followed by Norway with its very large Oil Fund; in this case government’s oil revenues are paid into the Oil Fund, not the general government budget, and only the income on the Fund is used to finance government spending). Government’s financial assets primarily comprise funds on deposit in the BoB. In addition, some of the BoB’s capital and reserves may also be considered to be financial assets of the government. There is also a relatively small amount of lending by government to parastatals. Against this must be set government’s financial liabilities, or borrowing. Historically the GoB has not borrowed significant amounts, given that it has generally run budget surpluses. However, with the large deficits incurred during the global financial and economic crisis, government has undertaken substantial borrowing, mainly from international sources, although there has been increasing domestic bond issuance. Government’s Net Financial Assets (NFA) can be calculated as follows: NFA = Deposits at BoB + unrealised revaluation reserves at BoB – government debt Data on deposits and reserves at BoB are published monthly. Unfortunately data on government borrowing are very poor and are only published with a long time lag. The most recent formally published data (in the BFS) are for March 2010, although estimates were produced with the 2011 Budget for the March 2011 debt position.

Final Report WAVES Botswana Preparation Phase
77 | P a g e
Appendix E: Tourism resources and sector
E.1 Introduction Travel and tourism is potentially one of the most important contributors to economic diversification and employment creation. It also has significant environmental and resource implications, with much tourism activity being based on natural resources and operating in ecologically fragile rural areas. Tourism may already be making significant contributions to GDP, employment and export earnings, although data availability is poor. There are numerous ways of measuring the size, performance and economic contribution of the tourism sector. The main ones are outlined below. Below is a comparison of Tourism data, specifically tourist arrival and expenditure data, from the CSO Botswana, UNCTAD and the World Bank World Development Indicators. The CSO arrivals data excludes arrivals from Zimbabwe. The comparison does not include 2009 UNCTAD data. The WDI describes International inbound tourists (overnight visitors) as the number of tourists who travel to a country other than that in which they have their usual residence, but outside their usual environment, for a period not exceeding 12 months and whose main purpose in visiting is other than an activity remunerated from within the country visited. UNCTAD defines arrivals of visitors as the total number of non-resident visitors who arrived in a reporting economy during a given year. UNCTAD also makes the distinction between a visitor and a tourist, and describes a tourist as a person who stays for at least one night. All tourists are also considered visitors. The tourist arrivals data of the CSO is obtained through immigration forms that are completed at the various border posts. The CSO figures from travelers leaving or entering Botswana on arrivals cover only non-citizens, both visitors and temporary residents of Botswana. Figure 9: Tourism arrivals
Sources: CSO Tourism Report (2005, 2007&2009), UNCTAD Handbook of Statistics 2010, World Bank World Development Indicators As shown in the above chart, CSO and WDI tourist arrival figures are more or less in line with a marginal difference in 2009. In 2005 and 2007 however, UNCTAD reported higher tourist arrival than CSO and WDI. There is a clear inconsistency in data reported by the various sources which brings up the question of how
-
200,000
400,000
600,000
800,000
1,000,000
1,200,000
1,400,000
1,600,000
1,800,000
2,000,000
2005 2007 2009
Num
ber o
f vis
itors
Year
CSO
UNCTAD
WDI

Final Report WAVES Botswana Preparation Phase
78 | P a g e
reliable is any of this data; CSO collects data from border and airport terminals whilst UNCTAD references UNWTO as a data source. The inconsistency could be caused by the different definitions of tourist. Figure 10: International tourist arrivals by purpose, 2005
Source: Department of Tourism, WTTC
The largest single category motivator for visiting Botswana is Visiting Friends and Relatives (VFR), Whilst VFR takes a big chunk of arrivals, holidays and leisure are rising fast since 1994 - by 10% per annum between 1994 and 2005, against 7% for VFR visitors. The ‘other’ category shown above includes returning and prospective residents, as well as those seeking employment. But more than half of the “other” cateogry represents tourists who did not give a reason for their visit, which makes analysis of tourism trends more difficult. WDI Tourist expenditure is reported as International tourism receipts. These are defined as expenditures by international inbound visitors, including payments to national carriers for international transport, and may include any other prepayment made for goods or services received in the destination country. UNCTAD’s total expenditure of tourists refers to expenditures of non-resident visitors within the territory of a reporting economy, including the costs they pay for transportation. The Botswana national data on tourist expenditure includes expenditure on accommodation, meals/drinks, transport, recreation, shopping and other expenditure. It should be noted that the survey methodology for Botswana tourism statistics changed in 2007, therefore comparisons with prior periods may be misleading. Figure 11: Comparison of Tourism Expenditure with Travel Services Exports
Other, 45%
Leisure, 15.80% business, 4.20%
VFR, 21.10%
Transit, 13.10%

Final Report WAVES Botswana Preparation Phase
79 | P a g e
Sources: Department of Tourism- Tourism Statistics, Bank of Botswana Balance of Payments, UNCTAD Handbook of Statistics 2010, World Bank World Development Indicators
The above chart shows discrepancies (BoB/CSO data) between travel services exports and tourist expenditure, with 2009 showing the largest difference. In 2005 UNCTAD shows the tourist expenditure to be more or less equal to travel services exports, whereas in 2007 there is a large degree of inconsistency. WDI data shows that in the years 2005 to 2009, tourist expenditure was in line with travel services exports. Around 30% of total tourist expenditure is towards accommodation. Other spending is generally allocated to services such as tours, guides, etc. Figure 12: Breakdown of Tourism Expenditure
Source: Department of Tourism
0
100
200
300
400
500
600
2005
2007
2009
2005
2007
2009
2005
2007
2009
BoB / CSO UNCTAD WDI
US
$ M
illio
ns
Total Expenditure
Travel Services Exports
Accommodation, 29.8
other, 26.3 food & drink,
10.8
Transport, 7.2
Shopping, 15.8
Recreation, 10.2
Final Report WAVES Botswana Preparation Phase
80 | P a g e
E.2 Tourism economic impacts Calculating the contribution of the tourism industry to GDP is a complex process. This is because tourism per se is not an economic sector in terms of the conventional disaggregation of national accounts statistics. The national accounts GDP data are conventionally divided according to the type of productive activities undertaken, e.g. agriculture, mining, manufacturing, transportation, government services etc.. The tourism industry (or more appropriately, the “travel and tourism” industry) is defined differently, in terms of the type of consumer of various different goods and services. The defining characteristic of the travel and tourism industry from an economic perspective is that it is based on travel by individuals to a place that that is outside their usual environment12. It includes consumption by the following groups:
• Inbound international visitors (but excluding visitors being remunerated from within the country or those coming to make purchases of goods for sale in their country of origin)
• Domestic visitors, e.g. residents travelling within the country but outside of their usual environment (away from home)
• Residents on an outbound trip who spend money domestically pre-departure (e.g. travel agency bookings)
• The complication in measuring the contribution of tourism to GDP arises from the fact that the expenditure of tourists cuts across many different productive sectors of the economy, ranging from the obvious one such as hotels and transportation to smaller portions of less obvious sectors such as agriculture, communications, manufacturing etc. Furthermore, even in the “tourism dependent” sectors of the economy such as hotels, there may be some expenditure which is made by non-tourists (e.g., local residents visiting a casino).
• The contribution of the tourism sector to GDP is conventionally measured through the Tourism Satellite Account (TSA), following a methodology that has been put forward by the World Travel & Tourism Council (WTTC). This divides productive activities in an economy into those producing tourism-specific products (including accommodation services, restaurants, road and air transport services, travel agencies etc.) and non-specific products (all other activities). It then estimates the tourism component of these activities, and derives the total contribution of tourism-related supply and consumption to GDP.
• A second important distinction is between the tourism industry and the tourism economy. The tourism industry comprises all of the direct suppliers of goods and services to tourists (e.g. hotels, safari companies, airlines, travel agencies etc.). In addition, there are the upstream suppliers who provide goods and services to the tourism industry, e.g. providers of accounting services, fuel, foodstuffs etc.. These represent the indirect contribution of tourism to GDP. The tourism economy comprises both the direct and indirect contributions of tourism-related activities.
• There are three studies that have been done on tourism’s impact on the economy of Botswana. These include ‘Assessment of Economic Impact of Tourism in Botswana’ (Department of Tourism, 1999); ‘Botswana The impact of travel and tourism on jobs and the economy’ (World Travel and Tourism Council, 2007), and ‘Botswana strengthening tourism statistics and formulation of an experimental TSA-2005/2006’ (UN World Tourism Organisation, 2007). These studies have diverging figures on the sectors contributions to GDP, employment and exports.
E.2.1 GDP With demand for travel and tourism rising, in 2007 tourism was posted US7060bn of total demand and is forested to grow to US$13232bn by 2017 worldwide, whilst for Botswana demand during 2007 was US$1,620mn and expected to reach US$3078mn by 2017. In the same period, tourism’s contribution to GDP is expected to grow by 8%, from US$486mn in 2007 to US$1054mn according to WTTC.
12 It therefore excludes certain activity by local residents, e.g. visiting a restaurant. It also excludes travel for the purposes
of an activity remunerated from within the place visited, e.g., travel to take up employment.
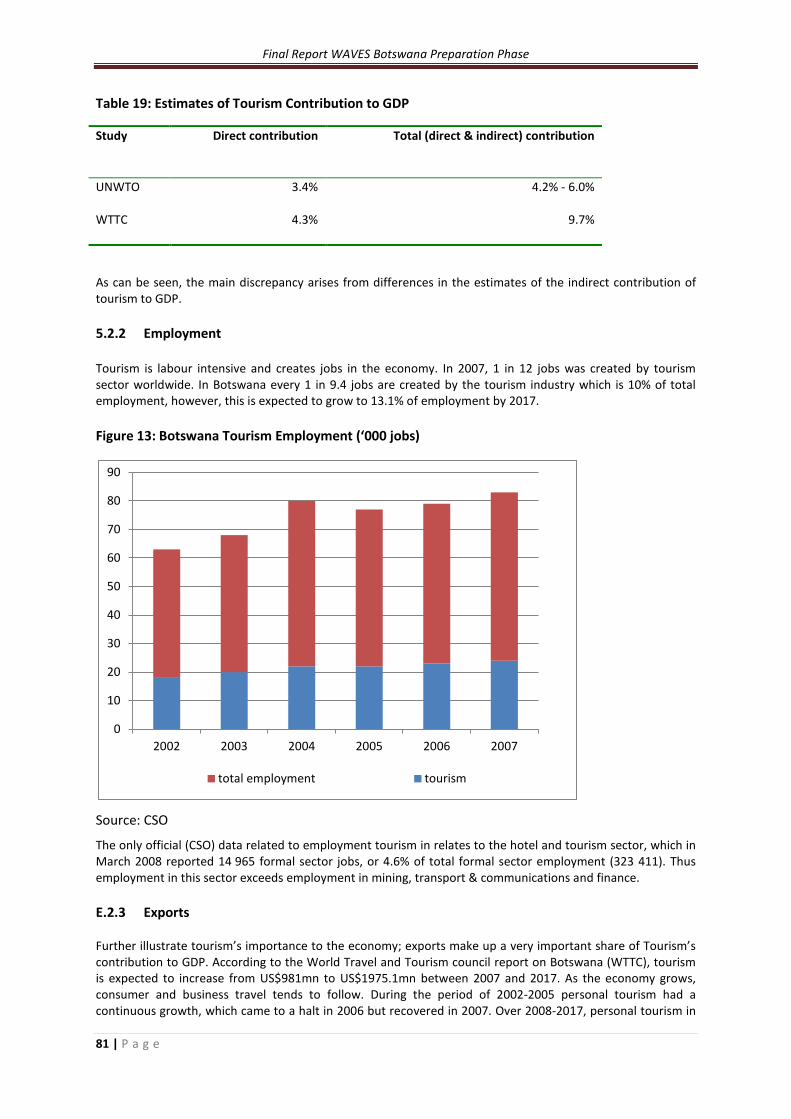
Final Report WAVES Botswana Preparation Phase
81 | P a g e
Table 19: Estimates of Tourism Contribution to GDP
Study Direct contribution Total (direct & indirect) contribution
UNWTO 3.4% 4.2% - 6.0%
WTTC 4.3% 9.7%
As can be seen, the main discrepancy arises from differences in the estimates of the indirect contribution of tourism to GDP. 5.2.2 Employment Tourism is labour intensive and creates jobs in the economy. In 2007, 1 in 12 jobs was created by tourism sector worldwide. In Botswana every 1 in 9.4 jobs are created by the tourism industry which is 10% of total employment, however, this is expected to grow to 13.1% of employment by 2017. Figure 13: Botswana Tourism Employment (‘000 jobs)
Source: CSO
The only official (CSO) data related to employment tourism in relates to the hotel and tourism sector, which in March 2008 reported 14 965 formal sector jobs, or 4.6% of total formal sector employment (323 411). Thus employment in this sector exceeds employment in mining, transport & communications and finance. E.2.3 Exports Further illustrate tourism’s importance to the economy; exports make up a very important share of Tourism’s contribution to GDP. According to the World Travel and Tourism council report on Botswana (WTTC), tourism is expected to increase from US$981mn to US$1975.1mn between 2007 and 2017. As the economy grows, consumer and business travel tends to follow. During the period of 2002-2005 personal tourism had a continuous growth, which came to a halt in 2006 but recovered in 2007. Over 2008-2017, personal tourism in
0
10
20
30
40
50
60
70
80
90
2002 2003 2004 2005 2006 2007
total employment tourism

Final Report WAVES Botswana Preparation Phase
82 | P a g e
Botswana is expected to grow at an annual rate of 3.7% while business/government travel is forecast to grow by 3.3% a year. The contribution of tourism to Botswana’s exports has been growing steadily. Travel exports grew on average by 21% a year over the period from 1992 to 2007, much faster than total export growth of 15% a year. After this dramatic growth, balance of payments (BoP) data showed that “travel services” was Botswana’s third largest export in 2007, after diamonds and copper-nickel. However, it has subsequently become clear that there are major problems in the BoP data. Figures for the years 2008-10 indicate much lower levels of tourism exports, in contrast to other data that indicate steady or even growing tourism activity. The reason appears to be changes in methodologies and definitions used by the Bank of Botswana to compile the services trade data, with the result that there is no consistent data series. BoP data from the Bank of Botswana show that “travel” exports were P535million in 2010; this represents around 1.6% of total goods and services exports. In 2007, however, travel exports were recorded at P3 352million, around 9.2% of total goods and services exports13. According to the WTTC, residents of Botswana have recently been allocating about 10.7% of their personal expenditures on travel and tourism, above world average of 9.7% and significantly higher than that of Sub-Saharan Africa at 4.7%. Personal travel is directly linked to the development of the residents of the economy. While Botswana ranks high in terms of current Travel and Tourism spending on a relative basis, it ranks low in the worldwide listing (113th) in respect of future forecast growth of personal travel and tourism, suggesting a significant need to focus attention on domestic travel and services for Botswana residents in the years to come. Tourism is a catalyst for construction and manufacturing and therefore there is a lot of capital investment involved. Between 2007 and 2017, both the public and private sector combined are expected to have an increase in spending by about 94%. There is however a problem with tourism data; there are contradictions between WTTC and UNWTO data, even those these presumably originated from the same source (Botswana Department of Tourism). Unfortunately the services import and export data are very poor, with published data series inconsistent and subject to unexplained methodological changes. As a result, there is no credible published time series data on tourism exports, for instance. This is a major problem that needs to be addressed, given the current and potential importance of tourism as a contributor to economic diversification and employment creation.
13 “Travel” is the export category that best matches the tourism industry, although part of the industry also falls into the
“transportation” category.