prepared in cooperation with the federal emergency
TRANSCRIPT
St. J
ohn
River
River
Fish
MARKET STREET
Fort Kent
AVENUE DES ÉRABLES
New Brunswick MAINE
CANADA
UNITED STATES
01014000
01013500
W MAIN STREET
InternationalBridge
BRIDGE ST
MILLS RD
Old USGSstreamgage
11
11 161
161
161
1
1
Prepared in cooperation with the Federal Emergency Managment Agency, Region 1
Flood-Inundation Maps for the St. John andFish Rivers in Fort Kent, Maine
U.S. Department of the InteriorU.S. Geological Survey
Pamphlet to accompanyScientific Investigations Map 3157

Cover: Image of Fort Kent, Maine, from Global Relief Technologies, 2008.

Flood-Inundation Maps for the St. John and Fish Rivers in Fort Kent, Maine
By Pamela J. Lombard
Prepared in cooperation with the Federal Emergency Management Agency, Region 1
Pamphlet to accompanyScientific Investigations Map 3157
U.S. Department of the InteriorU.S. Geological Survey

U.S. Department of the InteriorKEN SALAZAR, Secretary
U.S. Geological SurveyMarcia K. McNutt, Director
U.S. Geological Survey, Reston, Virginia: 2011
For more information on the USGS—the Federal source for science about the Earth, its natural and living resources, natural hazards, and the environment, visit http://www.usgs.gov or call 1-888-ASK-USGS
For an overview of USGS information products, including maps, imagery, and publications, visit http://www.usgs.gov/pubprod
To order this and other USGS information products, visit http://store.usgs.gov
Any use of trade, product, or firm names is for descriptive purposes only and does not imply endorsement by the U.S. Government.
Although this report is in the public domain, permission must be secured from the individual copyright owners to reproduce any copyrighted materials contained within this report.
Suggested citation:Lombard, P.J., 2011, Flood-Inundation maps for the St. John and Fish Rivers in Fort Kent, Maine: U.S. Geological Survey Scientific Investigations Map 3157, 8 p. pamphlet, 29 map sheets, scale 1:17,500.

iii
Contents
Abstract ...........................................................................................................................................................1Introduction.....................................................................................................................................................1
Purpose and Scope ..............................................................................................................................3Study Area Description ........................................................................................................................3Previous Studies ...................................................................................................................................3
Methods...........................................................................................................................................................3Constructing Water-Surface Profiles ................................................................................................4Topographic/Bathymetric Data ..........................................................................................................4Hydrologic and Steady Flow Data ......................................................................................................4Energy Loss Factors .............................................................................................................................4Model Calibration and Performance .................................................................................................4Development of Water-Surface Profiles ...........................................................................................4
Flood-Inundation Maps .................................................................................................................................5St. John and Fish Rivers, Fort Kent, Maine, Flood-Inundation Maps on the Internet ...............5Uncertainty Associated with Inundation Maps ...............................................................................6
Acknowledgments .........................................................................................................................................7Summary..........................................................................................................................................................7References Cited............................................................................................................................................8
Figures
1. Location of study reach for the St. John and Fish Rivers and location of USGS streamgage and National Weather Service forecast sites ...................................................2
2. Blue squares show the identification number of the correct flood-inundation map to choose from the 29 available maps according to current or forecast gage height at two USGS streamgages at Fort Kent, Maine; St. John River below Fish River (01014000), and Fish River (01013500) ........................................................................................7
Tables
1. USGS streamgage information for sites in Fort Kent, Maine ................................................3 2. Comparison of hydraulic-model output and surveyed high-water mark elevations
from the flood of April–May, 2008, St. John and Fish Rivers, Fort Kent, Maine .................5 3. Discharge in cubic feet per second (cfs) for corresponding gage height estimates
at selected locations for the St. John River, Fort Kent, Maine, for simulated water-surface profiles .............................................................................................................................6
4. Discharge in cubic feet per second (cfs) for corresponding gage height estimates at selected locations for the Fish River, Fort Kent, Maine, for simulated water- surface profiles .............................................................................................................................6
iv
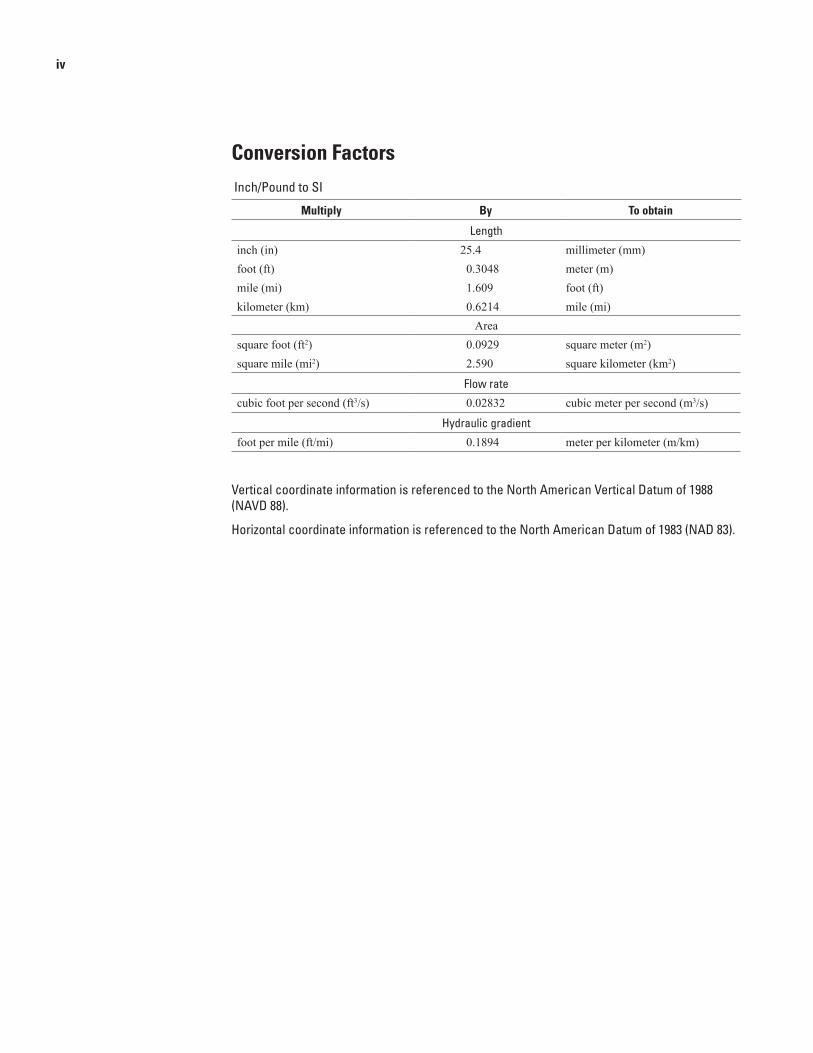
Conversion Factors
Inch/Pound to SI
Multiply By To obtain
Length
inch (in) 25.4 millimeter (mm)foot (ft) 0.3048 meter (m)mile (mi) 1.609 foot (ft) kilometer (km) 0.6214 mile (mi)
Areasquare foot (ft2) 0.0929 square meter (m2)square mile (mi2) 2.590 square kilometer (km2)
Flow rate
cubic foot per second (ft3/s) 0.02832 cubic meter per second (m3/s)
Hydraulic gradient
foot per mile (ft/mi) 0.1894 meter per kilometer (m/km)
Vertical coordinate information is referenced to the North American Vertical Datum of 1988 (NAVD 88).
Horizontal coordinate information is referenced to the North American Datum of 1983 (NAD 83).

Flood-Inundation Maps for the St. John and Fish Rivers in Fort Kent, Maine
By Pamela J. Lombard
AbstractDigital flood-inundation maps for a 2.5-mile reach of
the St. John River and a 2-mile reach of the Fish River were created by the U.S. Geological Survey (USGS) in cooperation with the Federal Emergency Management Agency (FEMA). The St. John River reach extends from 1,000 feet (ft) upstream from the International Bridge in Fort Kent, Maine, to 5,000 ft downstream from the International Bridge. The 2-mile reach of the Fish River extends from just upstream from Mills Road to its confluence with the St. John River in Fort Kent. The inundation maps, which can be accessed through the USGS Flood Inundation Mapping Science Web site at http://water.usgs.gov/osw/flood_inundation/ depict estimates of the areal extent and depth of flooding corresponding to selected water levels (gage heights) at the USGS streamgage, St. John River below Fish River at Fort Kent, Maine (station 01014000) and the USGS streamgage, Fish River near Fort Kent, Maine (station 01013500). Current gage heights at these USGS streamgages may be obtained on the Internet at http://waterdata.usgs.gov/me/nwis/current/?type=flow The National Weather Service (NWS) forecasts flood hydrographs at places that are often collocated at USGS streamgages, such as the two gages mentioned above. Forecasted peak-gage-height information, also available on the Internet, may be used in conjunction with the maps developed during this study to show predicted areas of flood inundation.
For this study, flood profiles were computed for the stream reach by means of a one-dimensional step-backwater model. The model was calibrated using gage height-discharge relations at USGS streamgages 01014000 and 01013500, and documented high water marks from a flood in April-May, 2008. The hydraulic model was then used to deter-mine elevations throughout the study reaches for nine gage heights at streamgage 01014000, and for seven gage heights at streamgage 01013500. Flood-inundation maps for this report include 29 combinations of gage heights at the two streamgages. Gage heights are referenced to the streamgage datums and range from bankfull to approximately the highest recorded water level at the streamgages. The simulated water-surface profiles were then combined with a geographic infor-mation system (GIS) digital elevation model (derived from Light Detection and Ranging (LiDAR) data having a 0.6-ft
vertical and 3.3-ft horizontal resolution) in order to delineate the area flooded at each water level.
Flood inundation maps and current gage heights from USGS streamgages and forecasted stream gage heights from the NWS are all available on the internet. These data provide emergency management personnel and residents from Fort Kent with information that is critical for flood-response activi-ties such as evacuations, road closures, emergency shelter location, disaster declarations and postflood recovery efforts.
IntroductionThe town of Fort Kent, Maine, is a small urban commu-
nity with an estimated population of 4,300 (Maine Register, 2009). Fort Kent has experienced severe flooding numerous times, most notably in 1974, 1979, and 2008. The majority of flood damages have occurred in Fort Kent at the confluence of the St. John and Fish Rivers (fig. 1).
Prior to this study, Fort Kent officials have relied on several information sources to make decisions on how best to alert the public and mitigate flood damages. One source is the Federal Emergency Management Agency (FEMA) Flood Insurance Study (FIS) for Fort Kent dated February, 1984 (Federal Emergency Management Agency, 1984). A second source of information is the USGS streamgages on the St. John and Fish Rivers in Fort Kent (table 1) from which cur-rent or historical water levels (gage height) can be obtained at http://waterdata.usgs.gov/me/nwis/current/?type=flow. A third source is the National Weather Service (NWS) forecast of peak gage height at the USGS streamgages through the Advanced Hydrologic Prediction Service (AHPS) website at http://www.erh.noaa.gov/nerfc/index.shtml. Although FEMA flood-insurance studies provide maps of theoretical floods for given exceedance probabilities, these maps do not necessar-ily correspond to current or forecast flood elevations and do not indicate how deep the water is at locations other than near USGS streamgages or NWS flood-forecast points. USGS cur-rent gage height and NWS forecast gage height information is useful for residents in the immediate vicinity of a streamgage, but is of limited use to residents upstream or downstream of the streamgage because the water-surface elevations are not constant along the stream channel.
St. J
ohn
River
River
Fish
MARKET STREET
Fort Kent
AVENUE DES ÉRABLES
New Brunswick MAINECANADA
UNITED STATES
01014000
01013500
W MAIN STREET
InternationalBridge
BRIDGE ST
MILLS RD
Old USGSstreamgage
MAINE
Studyarea
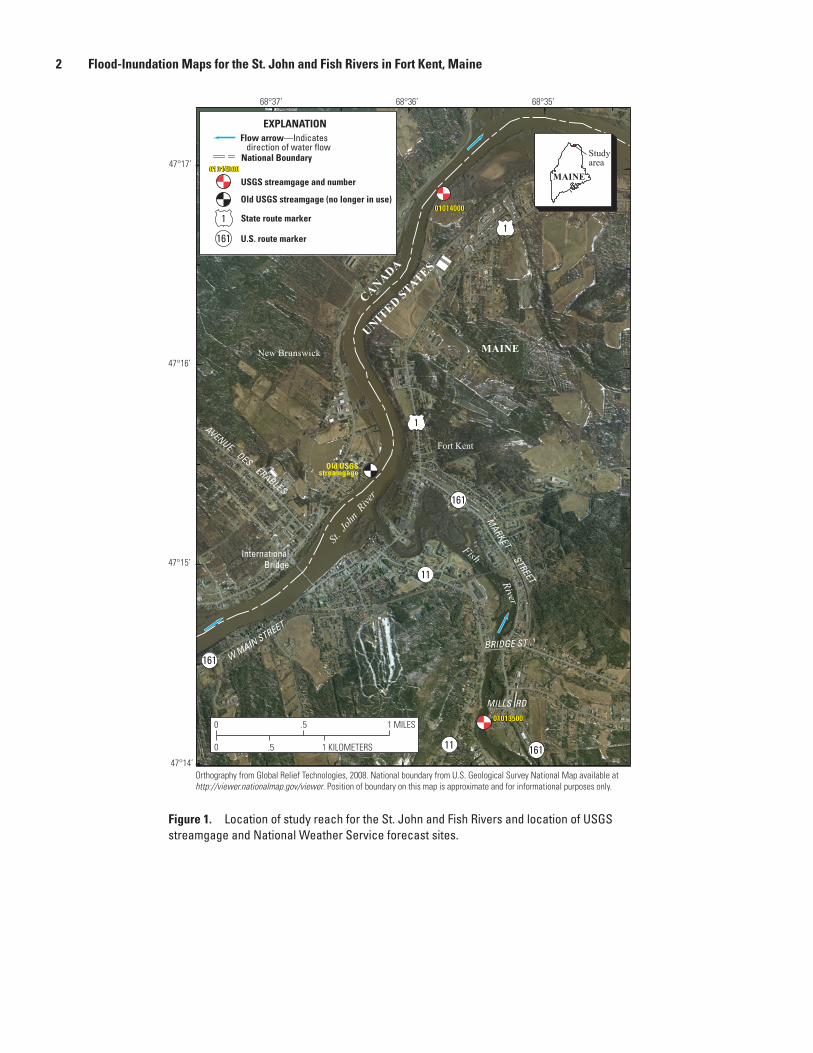
Orthography from Global Relief Technologies, 2008. National boundary from U.S. Geological Survey National Map available at http://viewer.nationalmap.gov/viewer. Position of boundary on this map is approximate and for informational purposes only.
EXPLANATIONFlow arrow—Indicates
direction of water flowNational Boundary
USGS streamgage and number
State route marker
U.S. route marker
Old USGS streamgage (no longer in use)
01014000
11
11
161
161
161
11
161
1
47°14’
47°15’
47°16’
47°17’
68°35’68°36’68°37’
1 KILOMETERS.50
1 MILES.50
Figure 1. Location of study reach for the St. John and Fish Rivers and location of USGS streamgage and National Weather Service forecast sites.
2 Flood-Inundation Maps for the St. John and Fish Rivers in Fort Kent, Maine

Methods 3
Purpose and Scope
The purpose of this report is to describe the development of a series of flood-inundation maps for the St. John and Fish Rivers near Fort Kent, Maine, and to make these maps avail-able to emergency workers and the public on the USGS Flood Inundation Mapping Science Web site available at http://water.usgs.gov/osw/flood_inundation/. The purpose is to (1) provide users with a library of flood inundation maps that correspond to a range of flood elevations on the two rivers that come together in Fort Kent, Maine, and (2) provide links between NWS forecasted peak stage at streamgages during times of flood and the corresponding flood inundation map that shows what that forecast stage will look like on the ground.
Study Area Description
The Fish and St. John Rivers are in northern Maine in Aroostook County. The St. John River has a drainage area of 4,782 mi2 at the International Bridge above the Fish River in Fort Kent, and a drainage area of 5,680 mi2 at streamgage 01014000. The St. John River forms part of the United States–Canada border before flowing to New Brunswick, Canada, and draining into the Atlantic Ocean. It flows northeastward in Maine, resulting in ice and snow upriver melting sooner than downriver, sending ice jams and heavier flows north and downriver to Fort Kent. The river basin is relatively undevel-oped and has no dams for most of its length. The Fish River has a drainage area of 873 mi2 at streamgage 01013500, and a drainage area of 890 mi2 at the mouth. The Fish River flows generally northward before entering the St. John River in Fort Kent. The flood inundation maps include the St. John River from between 1,000 ft upstream from the International Bridge in Fort Kent and 5,000 ft downstream from the International Bridge; and the Fish River from just upstream from Mills Road to its confluence with the St. John River in Fort Kent, Maine (fig. 1).
The economy of Fort Kent is diverse, but is centered on agriculture (primarily potato crops) and forestry. Nearly 80 percent of the manufacturing is in wood and paper products.
Previous Studies
The previous FIS for Fort Kent (Federal Emergency Management Agency, 1984) was completed by New England Division of the U.S. Army Corps of Engineers for the Federal Insurance Administration in September, 1984. That study covered the 1.0 and 0.2 percent annual exceedance probability water-surface profiles and associated flood-plain maps for all significant flooding sources in the town of Fort Kent. A flood-documentation study of the 2008 flood in northern Maine (Lombard, 2010) provided many of the high water marks used to calibrate models for this flood-inundation work.
Methods
Tasks specific to development of the maps were (1) examination of data from streamgages on the St. John River and the Fish River (table 1); (2) collection of topographic data and geometric data (for structures/bridges) throughout the study reach; (3) determination of energy-loss factors (roughness coefficients) in the stream channel and flood plain, and steady-flow data; (4) computation of water-surface profiles using the U.S. Army Corps of Engineers (USACE) HEC–RAS computer program (U.S. Army Corps of Engineers, 2010); (5) production of estimated flood- inundation maps corresponding to targeted water surface elevations at the gages (gage heights) using the USACE HEC–GeoRas computer program (U.S. Army Corps of Engi-neers, 2009) and a Geographic Information System (GIS); and (6) development of an Internet interface that links to USGS real-time streamgage information and (or) NWS forecasted peak gage height to facilitate the display of user-selected flood-inundation maps on the Internet.
Maps were produced for inundation levels referenced to gage heights at the USGS streamgage, St. John River below Fish River at Fort Kent, Maine (station 01014000), and the USGS streamgage, Fish River near Fort Kent, ME (station 01013500) and range from approximately bankfull to the maximum recorded water level at each streamgage.
Table 1. USGS streamgage information for sites in Fort Kent, Maine.
Station name Station number
Drainage area (mi2)
Latitude Longitude Period of record Maximum flood elevation (ft above NAVD 88)
and date
St. John River below Fish River at Fort Kent, Maine
01014000 5,680 47°15'29" 68°35'45" Oct., 1926 to 2010 517.64 ft1 April 30, 2008
Fish River near Fort Kent, Maine
01013500 873 47°14'15" 68°34'58" Sept., 1929 to 2010 524.60 ft April 30, 2008
1Corresponds to an approximate elevation of 512.1 ft NAVD88 or a gage height of 27.7 ft at current (2010) location of gage (latitude 47°16'59.9", longitude 68°35'6.6")

Constructing Water-Surface Profiles
The water-surface profiles used to produce the flood-inundation maps in this study were computed using HEC–RAS, version 4.1.0 (U.S. Army Corps of Engineers, 2010). HEC–RAS is a one-dimensional step-backwater model for simulation of water-surface profiles with steady-state (gradually varied) or unsteady-state flow computation options. The HEC–RAS analysis for this study was done using the steady-state flow computation option.
Topographic/Bathymetric Data
Global positioning system (GPS) static surveys were used to establish a local control network at locations near the streams studied. All topographic data are referenced horizon-tally to the North American Datum of 1983 (NAD 83) and to the North American Vertical Datum of 1988 (NAVD 88), and are projected in Maine State Plane East coordinates in feet.
Streambank elevations and hydraulic structure geometries were obtained from USGS field surveys using differential leveling techniques to tie elevations to the local control net-work described above. Structural dimensions for four bridges were measured and surveyed in the field concurrently with the stream-channel surveys. Underwater depths were determined using hydroacoustic instrumentation to profile the channel bottom in relation to the water surface. A detailed description of the methods used to acquire and process the topographic and bathymetric data can be found in Bales and others (2007).
Light Detection and Ranging (LiDAR) data were col-lected and post processed in 2009 by The Sanborn Map Co., Inc. Using a Geographic Information System (GIS), a Triangular Irregular Network (TIN) was developed from the digital grids provided by The Sanborn Map Co. to supplement surveyed cross-sectional data and provide digital elevation data for mapping. Selected data collected during the GPS field surveys were used by the USGS to perform quality-control checks of the LiDAR mapping data.
Hydrologic and Steady Flow Data
The study area hydrologic network consists of two streamgages, both with more than 80 years of record (fig. 1; table 1). Gage height is measured continuously at the two sites from which continuous records of streamflow are computed. All water-surface elevations are referenced to gage datum and to NAVD 88. The streamgages are equipped with satellite radio transmitters that allow data to be transmitted routinely to the Internet within an hour of collection. Data can be accessed at http://waterdata.usgs.gov/me/nwis/current/?type=flow by clicking on the appropriate station number.
Energy Loss Factors
Field observations and high-resolution aerial photo-graphs were used to select initial (pre-calibration) Manning’s roughness coefficients (“n” values) for energy (friction) loss calculations. Initial values of n were adjusted as part of the calibration process. The n-values for the main channel of the St. John River range from 0.023 to 0.049, and n-values for overbanks range from 0.07 to 0.09. For the main chan-nel of the Fish River, n-values range from 0.048 to 0.05 and n-values for overbanks range from 0.085 to 0.1.
Model Calibration and Performance
The hydraulic model was calibrated to the gage height-discharge relations at the St. John and Fish River streamgages in Fort Kent and high-water marks from the flood in 2008 (Lombard, 2010). The estimated peak dis-charge for the April-May 2008 flood was 183,000 ft3/s with an estimated gage height of 517.64 ft at streamgage 01014000. The estimated peak discharge for the 2008 flood was 18,300 ft3/s, with an estimated gage height of 524.6 ft at streamgage 01013500. Model calibration was accomplished by adjusting Manning’s n-values and loss coefficients until the results of the hydraulic computations closely agreed with the known flood discharge and gage height values. Differ-ences between measured and simulated gage heights for models calibrated to high-water marks were less than 0.2 ft except at the mouth of the Fish River which is affected by backwater from the St. John River (table 2). In this case modeled gage height is 0.74 feet lower than gage height observed during the April-May 2008 flood. The model reflects backwater from the St. John River at this location. Details on techniques used in model development and cali-bration can be found in Bales and others (2007).
Development of Water-Surface Profiles
Profiles were developed for nine gage heights at 1-ft intervals between 20.6 ft and 28.6 ft as referenced to a local gage datum at streamgage 01014000, corresponding to elevations of between 505 and 513 ft NAVD88. In addition, profiles were developed for seven gage heights at 1-ft intervals between 8.3 ft and 14.3 ft as referenced to a local gage datum at station 01013500—corresponding to elevations of between 519 and 525 ft NAVD 88.
Models on the Fish River and the St. John River were calibrated to produce the selected profile elevations at the streamgages (tables 3 and 4). Discharges at the mouth of the Fish River were determined by drainage-area adjustment calculations by using the following equation:
4 Flood-Inundation Maps for the St. John and Fish Rivers in Fort Kent, Maine

Flood-Inundation Maps 5
Qungaged = Qgaged(DAungaged/DAgaged)b
whereQungaged is the unknown flow at a location upstream or
downstream from the streamgage in cubic feet per second (cfs),
Qgaged is the flow at the gage in cfs,DA is the drainage area in square miles,and b is a coefficient that depends on the exceedance
probability (Hodgkins, 1999).Discharges on the St. John River upstream from the con-
fluence of the Fish River were determined by subtracting the discharge of the Fish River at the mouth from the discharge of the St. John River at the streamgage downstream from the Fish River confluence. Drainage areas were calculated in GIS and are based on a USGS watershed boundary data layer at a scale of 1:24,000.
Flood-Inundation Maps
Flood-inundation maps were created for 29 combinations of profiles at the two USGS streamgages, both of which are NWS flood-forecast points (fig. 2). The maps were created in a GIS by combining the water-surface profiles and digital eleva-tion model data. The digital elevation model data were col-lected and processed to meet 3.3-ft (root-mean-squared error) horizontal accuracy and a vertical accuracy of 0.6 ft. Estimated flood-inundation boundaries for each simulated profile were developed with HEC–GeoRAS software (U.S. Army Corps of Engineers, 2009). HEC–GeoRAS is a set of procedures, tools, and utilities for processing geospatial data in ArcGIS by use of graphical user interface (Whitehead and Ostheimer, 2009). The interface allows the preparation of geometric data
for import into HEC–RAS and processes simulation results exported from HEC–RAS (U.S. Army Corps of Engineers, 2010). The HEC–GeoRAS results at the cross sections were adjusted to ensure a hydraulically reasonable transition of the boundary between modeled cross sections relative to the contour data for the land surface (Whitehead and Ostheimer, 2009). The maps show estimated flood-inundation areas over-laid on high-resolution, georeferenced, aerial photographs of the study area for each of the water-surface profiles that were generated by the hydraulic model.
St. John and Fish Rivers, Fort Kent, Maine, Flood-Inundation Maps on the Internet
A USGS Flood Inundation Mapping Science World Wide Web portal has been established by the USGS at url http://water.usgs.gov/osw/flood_inundation/ to provide flood-inundation information to the public. The maps and data from this study showing the extent of inundated areas can be downloaded in three electronic file formats from that portal; (1) GIS shapefile format (2) kmz file format, and (3) Portable Document (PDF) Format. Users can print out formatted maps quickly or create a customized map using available GIS data layers. In addition, downloadable GIS raster files and kmz map files showing the depth of flooded areas are available at the web portal. All pdf and kmz maps show aerial photography beneath the flood layers. The estimated flood-inundation maps are displayed in sufficient detail to note the extent of flood-ing with respect to individual structures so that preparations for flooding and decisions for emergency response can be performed efficiently.
Each stream reach displayed on the Web portal con-tains links to USGS graphs of the current gage height and
Table 2. Comparison of hydraulic-model output and surveyed high-water mark elevations from the flood of April–May, 2008, St. John and Fish Rivers, Fort Kent, Maine. [ft, feet]
River station High-water mark elevation (ft) ( NAVD88)
Model water-surface elevation (ft)
Elevation difference (ft)
St. John River
Old streamgage in New Brunswick, Canada 517.64 517.63 –0.01
International Bridge 520.53 520.54 +0.01
Fish River
Route 1 Bridge 520.04 519.3 –0.74
350 ft downstream from Bridge Street 521.67 521.67 0
Streamgage 01013500 524.6 524.5 -0.1

6 Flood-Inundation Maps for the St. John and Fish Rivers in Fort Kent, Maine
Table 3. Discharge in cubic feet per second (cfs) for corresponding gage height estimates at selected locations for the St. John River, Fort Kent, Maine, for simulated water-surface profiles.
Gage height in feet above gage datum
(parentheses reference NAVD 88)
20.6 (505)
21.6 (506)
22.6 (507)
23.6 (508)
24.6 (509)
25.6 (510)
26.6 (511)
27.6 (512)
28.6 (513)
Streamgage no. 01014000
101,500 108,800 117,600 128,700 140,000 152,900 166,400 180,500 195,000
Upstream from Fish River confluence
92,600 99,300 107,400 117,600 128,000 139,900 152,400 165,400 178,700
Table 4. Discharge in cubic feet per second (cfs) for corresponding gage height estimates at selected locations for the Fish River, Fort Kent, Maine, for simulated water-surface profiles.
Gage height in feet above gage datum
(parentheses reference NAVD 88)
8.3 (519)
9.3 (520)
10.3 (521)
11.3 (522)
12.3 (523)
13.3 (524)
14.3 (525)
At mouth 7,500 9,400 11,000 14,000 15,100 16,300 19,600
Streamgage no. 01013500
7,300 9,200 10,800 13,800 14,800 15,900 19,200
streamflow at streamgages 01014000 and 01013500—to which the inundation maps are referenced. A link also is provided to the NWS Advanced Hydrologic Prediction Service (AHPS) site (http:/water.weather.gov/ahps/) so that the user can obtain applicable information on forecasted peak gage heights.
Uncertainty Associated with Inundation Maps
Although the flood-inundation maps represent the boundaries of inundated areas with a distinct line, some uncertainty is associated with these maps. The flood boundar-ies shown were estimated based on gage heights at selected USGS streamgages. Water-surface elevations along the stream reaches were estimated by steady-state hydraulic modeling, assuming unobstructed flow and using discharges and hydro-logic conditions anticipated at the USGS streamgage(s). The hydraulic model reflects the land-cover characteristics and any bridge, dam, levee, or other hydraulic structures existing in 2010. Unique meteorological factors (timing and distribution of precipitation) may cause actual discharges along the mod-eled reach to vary from assumed conditions during a flood and lead to deviations in the water-surface elevations and inunda-tion boundaries shown. Additional areas may be flooded due to unanticipated backwater from major tributaries along the main stem or from localized debris or ice jams. Inundated areas shown should not be used for navigation, regulatory, permit-ting, or other legal purposes. The USGS provides these maps as a quick reference and emergency planning tool but assumes
no legal liability or responsibility for any direct, indirect, inci-dental, consequential, special, or exemplary damages or lost profit resulting from the use or misuse of this information.
If this series of flood-inundation maps will be used in conjunction with NWS river forecasts, the user should be aware of additional uncertainties. The NWS uses forecast models to estimate the quantity and timing of water flowing through selected stream reaches in the United States. These forecast models (1) estimate the amount of runoff generated by a precipitation or snowmelt event, (2) simulate the movement of floodwater as it proceeds downstream, and (3) predict the flow and gage height for the stream at a given location (AHPS forecast point) throughout the forecast period (every 6 hours over 3 to 5 days).

Summary 7
Figure 2. Blue squares show the identification number of the correct flood-inundation map to choose from the 29 available maps according to current or forecast gage height at two USGS streamgages at Fort Kent, Maine; St. John River below Fish River (01014000), and Fish River (01013500).
19
10 11 12
13 14
15 16
17
18
20 21
22 23
24 25 8
928 26
29 27
1 2 3
4 5
6 7
20.6 21.6 22.6 23.6 24.6 25.6 26.6 27.6 28.6
8.3
9.3
10.3
11.3
12.3
13.3
14.3
Gage height at USGS streamgage no. 01014000, St. John River below Fish River at Fort Kent (in feet)
Gag
e he
ight
at U
SGS
stre
amga
ge n
o. 0
1013
500,
Fish
Riv
er n
ear F
ort K
ent (
in fe
et)
Choosing the Correct Map for Forecast Flood
Acknowledgments
The author thanks the many local, State, and Federal agencies that have cooperated in the funding for the operation and maintenance of the streamgages used for this study, espe-cially the Maine Emergency Management Agency, the Maine River Flow Advisory Commission, the International Joint Commission, and the National Weather Service.
SummaryA series of estimated flood-inundation maps were devel-
oped in cooperation with FEMA for the St. John and Fish Rivers in Fort Kent, Maine. These maps, available at a USGS Web portal, in conjunction with the real-time gage height data from USGS streamgages 01014000 and 01013500, and NWS flood forecasts, can help to guide the general public in taking individual safety precautions and can provide city officials with a tool to manage emergency flood operations and flood-mitigation efforts.
The maps were developed using the U.S. Army Corps of Engineers’ HEC–RAS and HEC–GeoRAS programs to compute water-surface profiles and to delineate estimated flood-inundation areas and depth of flooding for selected gage heights. The maps show estimated flood-inundation areas overlaid on a high-resolution georeferenced aerial photograph of the study area. Maps reflect profiles developed for nine gage heights between 20.6 ft and 28.6 ft at streamgage 01014000 (505 and 513 ft NAVD88) and seven gage heights between 8.3 ft and 14.3 ft at streamgage 01013500 (519 and 525 ft NAVD88).

8 Flood-Inundation Maps for the St. John and Fish Rivers in Fort Kent, Maine
Publishing support provided by:Denver Publishing Service CenterFor more information concerning this publication, contact:Director, Maine Water Science CenterU.S. Geological Survey196 Whitten RoadAugusta, ME 04330(207) 622-8201Or visit the Maine Water Science CenterWeb site at:http://me.water.usgs.gov/
References Cited
Bales, J.D., Wagner, C.R., Tighe, K.C., and Terziotti, Silvia, 2007, LiDAR-derived flood-inundation maps for real-time flood-mapping applications, Tar River Basin, North Carolina: U.S. Geological Survey Scientific Investigations Report 2007–5032, 42 p.
Federal Emergency Management Agency (FEMA), 1984, Flood insurance study, town of Fort Kent, Aroostook County, Maine. Washington, D.C., 19 p.
Hodgkins, G, 1999. Estimating the magnitude of peak flows for streams in Maine for selected recurrence Intervals: U.S. Geological Survey Water-Resources Investigations Report 99–4008, 45 p.
Lombard, P.J., 2010, Flood of April and May 2008 in northern Maine: U.S. Geological Survey Scientific Investigations Report 2010–5003, 17 p. Available at http://pubs.usgs.gov/sir/2010/5003/.
Maine Register, 2009, Maine register state yearbook and leg-islative manual no. 140: Standish, Maine, Tower Publishing Company.
U.S. Army Corps of Engineers, 2009, Hydrologic Engineering Center, HEC-GeoRAS, GIS Tools for Support of HEC–RAS at http://www.hec.usace.army.mil/software/hec-ras/hec-georas_downloads.html
U.S. Army Corps of Engineers, Hydrologic Engineering Cen-ter, 2010, HEC–RAS River Analysis System, version 4.1, at http://www.hec.usace.army.mil/software/hec-ras/hecras-download.html.
Whitehead, M.T., and Ostheimer, C.J., 2009, Development of a flood-warning system and flood-inundation mapping for the Blanchard River in Findlay, Ohio: U.S. Geological Survey Scientific Investigations Report 2008–5234, 9 p.
Lombard—
Flood-Inundation Maps for the St. John and Fish Rivers in Fort Kent, M
aine—U.S. Geological Survey Scientific Investigations M
ap 3157