prepared in cooperation with the minnesota pollution ...greg k. brown, howard e. taylor, imma...
TRANSCRIPT

Endocrine Active Chemicals, Pharmaceuticals, and Other Chemicals of Concern in Surface Water, Wastewater- Treatment Plant Effluent, and Bed Sediment, and Biological Characteristics in Selected Streams, Minnesota—Design, Methods, and Data, 2009
Prepared in cooperation with the Minnesota Pollution Control Agency, St. Cloud State University, University of St. Thomas, and the University of Colorado
U.S. Department of the InteriorU.S. Geological Survey
Data Series 575
U.S. Department of the InteriorU.S. Geological Survey
Data Series 575
Prepared in cooperation with the Minnesota Pollution Control Agency, St. Cloud State University, University of St. Thomas, and the University of Colorado
Endocrine Active Chemicals, Pharmaceuticals, and Other Chemicals of Concern in Surface Water, Wastewater- Treatment Plant Effluent, and Bed Sediment, and Biological Characteristics in Selected Streams, Minnesota—Design, Methods, and Data, 2009

Front cover. Industrial wastewater-treatment plant outflow in Worthington, Minnesota. Photograph by John Greene, U.S. Geological Survey, September 9 , 2009.
Back cover. Left: Duluth Minnesota wastewater-treatment plant, Duluth, Minnesota. Photograph by Laura Murphy, U.S. Geological Survey, October 1, 2009. Upper right: Metropolitan wastewater-treatment plant outflow, St. Paul , Minnesota. Photograph by Kathy Lee, U.S. Geological Survey, September 24, 2009. Lower right: East Grand Forks wastewater-treatment plant outflow, East Grand Forks, Minnesota. Photograph by John Greene, U.S. Geological Survey, October 21, 2009.

Endocrine Active Chemicals, Pharmaceuticals, and Other Chemicals of Concern in Surface Water, Wastewater- Treatment Plant Effluent, and Bed Sediment, and Biological Characteristics in Selected Streams, Minnesota—Design, Methods, and Data, 2009
By Kathy E. Lee, Susan K. Langer, Larry B. Barber, Jeff H. Writer, Mark L. Ferrey, Heiko L. Schoenfuss, Edward T. Furlong, William T. Foreman, James L. Gray, Rhiannon C. ReVello, Dalma Martinovic, Olivia P. Woodruff, Steffanie H. Keefe, Greg K. Brown, Howard E. Taylor, Imma Ferrer, and E. Michael Thurman
Prepared in cooperation with the Minnesota Pollution Control Agency, St. Cloud State University, University of St. Thomas, and the University of Colorado
Data Series 575
U.S. Department of the InteriorU.S. Geological Survey

U.S. Department of the InteriorKEN SALAZAR, Secretary
U.S. Geological SurveyMarcia K. McNutt, Director
U.S. Geological Survey, Reston, Virginia: 2011
For more information on the USGS—the Federal source for science about the Earth, its natural and living resources, natural hazards, and the environment, visit http://www.usgs.gov or call 1-888-ASK-USGS
For an overview of USGS information products, including maps, imagery, and publications, visit http://www.usgs.gov/pubprod
Any use of trade, product, or firm names is for descriptive purposes only and does not imply endorsement by the U.S. Government.
Although this report is in the public domain, permission must be secured from the individual copyright owners to reproduce any copyrighted materials contained within this report.
Suggested citation:Lee, K.E., Langer, S.K., Barber, L.B., Writer, J.H., Ferrey, M.L., Schoenfuss, H.L., Furlong, E.T., William T. Foreman, Gray, J.L., ReVello, R.C., Martinovic, D., Woodruff, O.P., Keefe, S.H., Brown, G.K., Taylor, H.E., Ferrer, I., and Thurman, E.M., 2011, Endocrine active chemicals, pharmaceuticals, and other chemicals of concern in surface water, wastewater-treatment plant effluent, and bed sediment, and biological characteristics in selected streams, Minnesota—design, methods, and data, 2009: U.S. Geological Survey Data Series 575, 54 p., with appendixes.

iii
Contents
Abstract ...........................................................................................................................................................1Introduction.....................................................................................................................................................1
Purpose and Scope ..............................................................................................................................2Acknowledgments ................................................................................................................................4
Study Design ..................................................................................................................................................4Site Selection.........................................................................................................................................4Site Characterization ...........................................................................................................................9
Methods...........................................................................................................................................................9Data Collection ......................................................................................................................................9
Hydrologic Measurements ........................................................................................................9Water-Sample Collection..........................................................................................................18Bed-Sediment Sample Collection ...........................................................................................18
Caged Fish Deployment .....................................................................................................................19Sample Processing and Analyses ...................................................................................................19
Surface-Water and Wastewater-Effluent Chemical Analyses ..........................................19Bed-Sediment Chemical Analyses .........................................................................................29Bioassay for Total Estrogenicity .............................................................................................31Caged Fish Processing .............................................................................................................32
Data for Endocrine Active Chemicals, Pharmaceuticals, Other Chemicals of Concern, and Biological Characteristics ............................................................................................................32
Water Data ...........................................................................................................................................33Major Ions and Nutrients .........................................................................................................33Trace Elements and Major Ions ...............................................................................................33Pharmaceuticals ........................................................................................................................35Phytoestrogens, Pharmaceuticals, and an Antimicrobial ..................................................37Alkylphenols and Other Neutral Organic Chemicals ...........................................................39Carboxylic Acids ........................................................................................................................41Steroidal Hormones and Other Chemicals ............................................................................41
Bed-Sediment Data ............................................................................................................................41Carbon and Wastewater-Indicator Chemicals .....................................................................41Steroidal Hormones and other chemicals .............................................................................44
Biological Characteristics .................................................................................................................44Total Estrogenicity .....................................................................................................................44Caged Fish Data .........................................................................................................................45
Summary........................................................................................................................................................45References Cited..........................................................................................................................................45Appendixes 1–12 ..........................................................................................................................................51

iv
Figures 1. Map showing locations of wastewater-treatment plants that discharge to
surface waters in Minnesota ......................................................................................................3 2. Schematic showing relative locations of sampling sites upstream and
downstream from discharge of wastewater-treatment plant effluent ................................4 3. Map showing site locations during 2009. Each square typically represents
three sites ......................................................................................................................................5
Tables 1. List of sampling sites, latitude, longitude, and sampling dates ............................................6 2. Population and land-cover percentages for drainage basins for sampling
sites ...............................................................................................................................................10 3. Number of feedlots and animal type summaries for drainage basins for each
sampling site ................................................................................................................................13 4. Characteristics of wastewater-treatment plants sampled ..................................................16 5. Properties and chemicals analyzed in water or bed-sediment samples ..........................20 6. Chemical and the corresponding isotope dilution standard (IDS) used for its
quantification in bed-sediment by U.S. Geological Survey National Water Quality Laboratory for custom analytical method 6434 ........................................................30
7. Hydrologic properties determined from tracer studies for selected sites .......................34 8. Quality-assurance summary for major ions and nutrients in water samples
analyzed at the U.S. Geological Survey National Water Quality Laboratory ....................35 9. Quality-assurance summary for trace elements and major ions in water samples
analyzed at the U.S. Geological Survey National Research Program Laboratory ....................................................................................................................................36
10. Quality-assurance summary for pharmaceuticals in water samples analyzed at the U.S. Geological Survey National Water Quality Laboratory .........................................38
11. Quality-assurance summary for phytoestrogens, pharmaceuticals, and an antimicrobial chemical in water samples analyzed at the University of Colorado Center for Environmental Mass Spectrometry ......................................................................39
12. Quality-assurance summary for alkylphenols and other neutral organic chemicals in water samples analyzed at the U.S. Geological Survey National Research Program Laboratory ...................................................................................................................40
13. Quality-assurance summary for carboxylic acids in water samples analyzed at the U.S. Geological Survey National Research Program Laboratory ................................42
14. Quality-assurance summary for steroidal hormones and other chemicals in water samples analyzed at the U.S. Geological Survey National Research Program Laboratory ....................................................................................................................................43

v
Multiply By To obtain
Length
centimeter (cm) 0.3937 inch (in.)
millimeter (mm) 0.03937 inch (in.)
micrometer (µm) 0.00003937 inch (in.)
meter (m) 3.281 foot (ft)
kilometer (km) 0.6214 mile (mi)
Area
square kilometer (km2) 247.1 acre
square kilometer (km2) 0.3861 square mile (mi2)
square meter (m2) 10.76 square foot (ft2)
square centimeter (cm2) 0.1550 square inch (ft2)
Volume
cubic meter (m3) 6.290 barrel (petroleum, 1 barrel = 42 gal)
liter (L) 33.82 ounce, fluid (fl. oz)
liter (L) 2.113 pint (pt)
liter (L) 1.057 quart (qt)
liter (L) 0.2642 gallon (gal)
cubic meter (m3) 264.2 gallon (gal)
cubic meter (m3) 0.0002642 million gallons (Mgal)
liter (L) 61.02 cubic inch (in3)
cubic meter (m3) 35.31 cubic foot (ft3)
cubic meter (m3) 1.308 cubic yard (yd3)
Flow rate
cubic meter per second (m3/s) 70.07 acre-foot per day (acre-ft/d)
cubic meter per second (m3/s) 35.31 cubic foot per second (ft3/s)
cubic meter per second (m3/s) 22.83 million gallons per day (Mgal/d)
meter per second (m/s) 3.281 foot per second (ft/s)
Mass
gram (g) 0.03527 ounce, avoirdupois (oz)
Pressure
kilopascal (kPa) 0.1450 pound per square inch (lb/ft2)
Conversion Factors
Temperature in degrees Celsius (°C) may be converted to degrees Fahrenheit (°F) as follows:
°F=(1.8×°C)+32
Vertical coordinate information is referenced to the North American Vertical Datum of 1988 (NAVD 88).
Horizontal coordinate information is referenced to the North American Datum of 1983 (NAD 83).
Altitude, as used in this report, refers to distance above the vertical datum.

vi
Concentrations of chemical constituents in water are given in milligrams per liter (mg/L), micrograms per liter (μg/L), or nanograms per liter (ng/L). Concentrations of chemical constituents in bed sediment are given in nanograms per gram (ng/g) or micrograms per kilogram (μg/kg).
Abbreviations and Acronyms
± plus or minus
μL microliter
μm micrometer
mL/min milliliter per minute
ng nanogram
Ab antibody
ASE accelerated solvent extraction13C carbon-13
CLLE continuous liquid-liquid extraction
DEET N,N-diethyl-meta-toluamide
D-loss deuterium loss
E2 17-beta-estradiol
EAC endocrine active chemical
EC10 environmental concentration at which a chemical induces a response 10 percent above the baseline
EDTA ethylenediaminetetraacetic acid
FBS fetal bovine serum
GC/MS gas chromatography/mass spectrometry
GC/MS/MS gas chromatography/tandem mass spectrometry
GIS geographic information system
HP Hewlett Packard
HPLC high-perfomance liquid chromatography
ICI antiestrogen receptor
IDS isotope dilution standard
LSW Lake Superior water
MPCA Minnesota Pollution Control Agency
MSTFA N-methyl-N-(trimethylsilyl)-trifluoroacetamide
MSTFA II N-methyl-N-(trimethylsilyl)-trifluoroacetamide activated with 2-(trimethylsilyl)ethanethiol and ammonium iodide
NLCD National Land Cover Data
NP1EC nonylphenolmonoethoxycarboxylate
NP4EC nonlyphenoltetraethoxycarboxylate
NP1EO 4-nonylphenolmonoethoxylate
NP2EO 4-nonylphenoldiethoxylate
vii
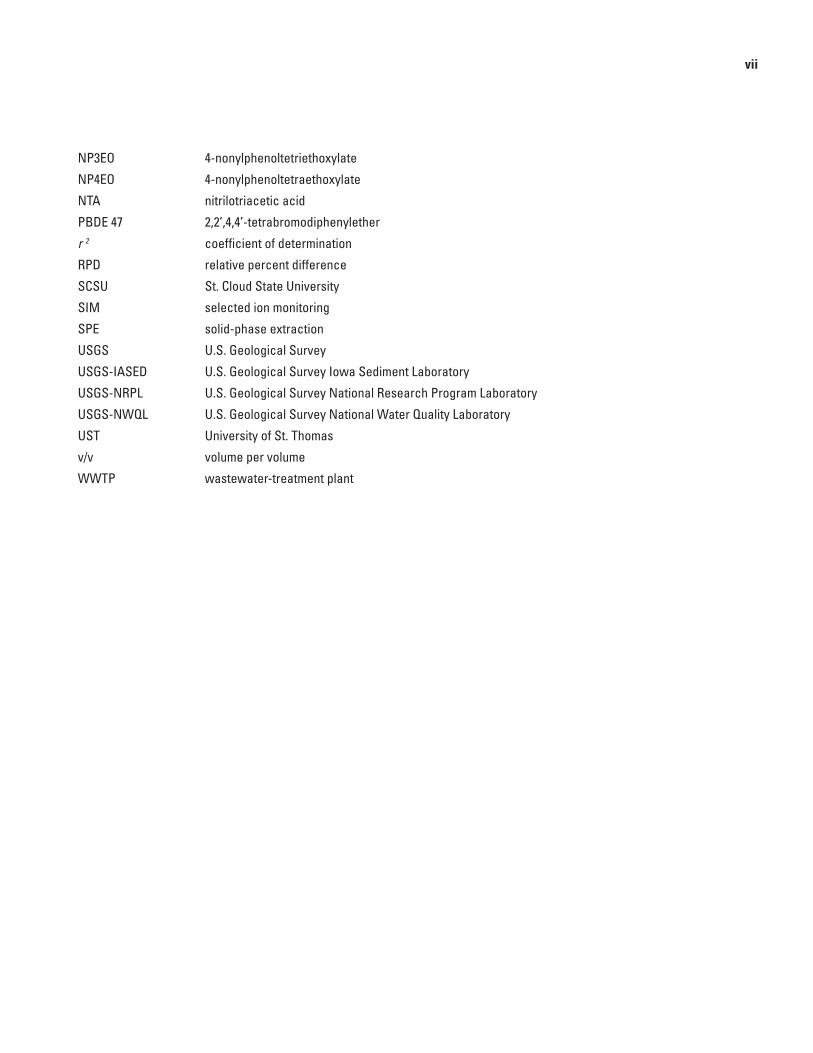
NP3EO 4-nonylphenoltetriethoxylate
NP4EO 4-nonylphenoltetraethoxylate
NTA nitrilotriacetic acid
PBDE 47 2,2’,4,4’-tetrabromodiphenylether
r 2 coefficient of determination
RPD relative percent difference
SCSU St. Cloud State University
SIM selected ion monitoring
SPE solid-phase extraction
USGS U.S. Geological Survey
USGS-IASED U.S. Geological Survey Iowa Sediment Laboratory
USGS-NRPL U.S. Geological Survey National Research Program Laboratory
USGS-NWQL U.S. Geological Survey National Water Quality Laboratory
UST University of St. Thomas
v/v volume per volume
WWTP wastewater-treatment plant

viii

Endocrine Active Chemicals, Pharmaceuticals, and Other Chemicals of Concern in Surface Water, Wastewater- Treatment Plant Effluent, and Bed Sediment, and Biological Characteristics in Selected Streams, Minnesota—Design, Methods, and Data, 2009
By Kathy E. Lee1, Susan K. Langer1, Larry B. Barber1, Jeff H. Writer1, Mark L. Ferrey2, Heiko L. Schoenfuss3, Edward T. Furlong1, William T. Foreman1, James L. Gray1, Rhiannon C. ReVello1, Dalma Martinovic4, Olivia P. Woodruff1, Steffanie H. Keefe1, Greg K. Brown1, Howard E. Taylor1, Imma Ferrer5, and E. Michael Thurman5
1U.S. Geological Survey
2 Minnesota Pollution Control Agency, St. Paul, Minn.
3 Saint Cloud State University, St. Cloud, Minn.
4 University of St. Thomas, St. Paul, Minn.
5 University of Colorado, Boulder, Colo.
AbstractThis report presents the study design, environmental
data, and quality-assurance data for an integrated chemical and biological study of selected streams or lakes that receive wastewater-treatment plant effluent in Minnesota. This study was a cooperative effort of the U.S. Geological Survey, the Minnesota Pollution Control Agency, St. Cloud State Univer-sity, the University of St. Thomas, and the University of Colo-rado. The objective of the study was to identify distribution patterns of endocrine active chemicals, pharmaceuticals, and other organic and inorganic chemicals of concern indicative of wastewater effluent, and to identify biological characteristics of estrogenicity and fish responses in the same streams.
The U.S. Geological Survey collected and analyzed water, bed-sediment, and quality-assurance samples, and measured or recorded streamflow once at each sampling location from September through November 2009. Sampling locations included surface water and wastewater-treatment plant effluent. Twenty-five wastewater-treatment plants were selected to include continuous flow and periodic release facilities with differing processing steps (activated sludge or trickling filters) and plant design flows ranging from 0.002 to 10.9 cubic meters per second (0.04 to 251 million gallons per day) throughout Minnesota in varying land-use settings. Water samples were collected from the treated effluent of the 25 wastewater-treatment plants and at one point upstream from
and one point downstream from wastewater-treatment plant effluent discharges. Bed-sediment samples also were collected at each of the stream or lake locations. Water samples were analyzed for major ions, nutrients, trace elements, pharmaceu-ticals, phytoestrogens and pharmaceuticals, alkylphenols and other neutral organic chemicals, carboxylic acids, and steroidal hormones. A subset (25 samples) of the bed-sediment samples were analyzed for carbon, wastewater-indicator chemicals, and steroidal hormones; the remaining samples were archived.
Biological characteristics were determined by using an in-vitro bioassay to determine total estrogenicity in water samples and a caged fish study to determine characteristics of fish from experiments that exposed fish to wastewater effluent in 2009. St. Cloud State University deployed and processed caged fathead minnows at 13 stream sites during September 2009 for the caged fish study. Measured fish data included length, weight, body condition factor, and vitellogenin concentrations.
IntroductionStreams receiving wastewater-treatment plant (WWTP)
effluent have been documented to contain chemicals used in private homes, industry, and agriculture. A subset of these chemicals, endocrine active chemicals (EACs) (Ahel and others, 1994a, b; Desbrow and others, 1998; Ternes, 1998; Kolpin and others, 2002) and pharmaceuticals (Lajeunesse and others, 2008; Schultz and Furlong, 2008) have been identi-fied in WWTP effluents and in surface waters in Minnesota (Barber and others, 2000, 2007; Lee and others, 2004; Lee, Schoenfuss, and others, 2008; Lee, Yaeger, and others, 2008; Martinovic and others, 2008; Writer and others, 2010).

2 Endocrine Active Chemicals, Pharmaceuticals, and Other Chemicals of Concern in Selected Streams
EACs include natural and synthetic chemicals that mimic or block the function of natural hormone mediated systems in animals, including fish (Kime, 1998; National Research Council, 1999) and invertebrates (Gagnaire and others, 2009). Although no single list of EACs exists, laboratory studies have confirmed that certain classes of chemicals including natural and synthetic hormones, pesticides, trace metals, alkylphenols, alkylphenol ethoxylates, plastic components, phthalates, and phytoestrogens affect the endocrine systems of fish through biochemical, structural, and behavioral disruption (Jobling and Sumpter, 1993; Jobling and others, 1996; Ankley and others, 1998; Kime, 1998; Miles-Richardson and others, 1999; Bis-todeau and others, 2006; Barber and others, 2007; Schoenfuss and others, 2008). The presence of pharmaceuticals in surface waters can alter normal body functions of aquatic species, including invertebrate reproduction (Nentwig, 2007) and fish behavior (Painter and others, 2010).
More than 500 WWTPs throughout Minnesota discharge treated wastewater to surface water (fig. 1). Approximately 75 percent of the WWTPs release effluent periodically (generally biannually during the spring and fall) with design flows less than 0.04 cubic meter per second (m3/s; 1 million gallons per day (Mgal/d)). Approximately 60 WWTPs discharge continu-ously to receiving streams with average design flows greater than 0.04 m3/s (Lee and others, 2010).
Results from several investigations (Barber and others, 2000, 2007; Lee, Schoenfuss, and others, 2008; Lee, Yae-ger, and others, 2008; Martinovic and others, 2008; Lee and others, 2010) indicate that concentrations of EACs in Min-nesota WWTP effluent and receiving streams greatly vary. For example, nonylphenol was detected in effluent from 9 of 11 previously studied WWTPs at concentrations ranging from less than the detection level to 18.2 micrograms per liter (µg/L) among all samples (Lee and others, 2010).
The variability in chemical occurrence and concentrations in WWTP effluent is dependent upon the influent type and processing techniques of each WWTP (Richardson and Bow-ron, 1985; Stumpf and others, 1996; Ternes, 1998). Huang and Sedlak (2001) and Drewes and others (2005) determined that tertiary wastewater treatment resulted in a 70-percent reduc-tion of EACs, and advanced treatment with reverse osmosis resulted in a 96-percent reduction of EACs. Drewes and others (2005) determined that although sewage treatment reduced the overall estrogenicity, effluents still had sufficient estrogenicity to elicit a response from a human breast cancer cell assay.
Indicators of endocrine disruption including elevated concentrations of vitellogenin in male fish (an egg yolk protein present in female fish but generally absent in male fish) and intersex occurrence (oocytes present in testes tissue) have been observed downstream from wastewater discharges (Folmar and others, 1996, 2001; Lee and others, 2000, 2010; Goodbred and others, 1997; Lee and Blazer, 2005; Lee, Schoenfuss, and others, 2008; Lee, Yaeger, and others, 2008).
Although WWTP effluent has been identified as a con-tributor of EACs to the aquatic environment (Desbrow and others, 1998; Ternes and others, 1999; Johnson and Sumpter,
2001; Vajda and others, 2008), EACs also have been detected in streams and lakes with no obvious WWTP effluent dis-charges indicating that other sources of contamination are contributing EACs (Lee and others, 2004, 2010; Lee, Schoen-fuss, and others, 2008; Writer and others, 2010). EACs and pharmaceuticals can enter aquatic systems through a variety of pathways in addition to WWTP effluent including industrial effluent discharge, runoff from agricultural and urban land surfaces, land application of human and animal waste and sub-sequent movement to groundwater or surface water, and septic system discharge.
Although research and monitoring efforts have identified EACs and pharmaceuticals in WWTP effluent and receiving streams in Minnesota, the number of WWTPs sampled among the various studies represent a small fraction (less than 5 per-cent) of the WWTPs in Minnesota. In addition, little is known about EACs in bed sediment, which may serve as a reservoir of these chemicals in aquatic environments.
In order to address these issues, the U.S. Geologi-cal Survey (USGS), Minnesota Pollution Control Agency (MPCA), St. Cloud State University (SCSU), University of St. Thomas (UST), and the University of Colorado with input from the Minnesota Department of Natural Resources, Min-nesota Department of Health, University of Minnesota, and the Metropolitan Council, began an integrated chemical and biological study in July 2009 to look at the occurrence of a broad suite of chemicals including EACs and pharmaceuti-cals in WWTP effluent and at sites upstream and downstream from the WWTP effluent discharge. Samples of surface water, wastewater effluent, and bed sediment were collected through-out Minnesota during 2009 and analyzed for selected EACs, pharmaceuticals, and other chemicals of concern. Biological characteristics were determined by using an in-vitro bioassay to determine total estrogenicity in water samples and a caged fish study to determine characteristics of fish from experiments that exposed fish to wastewater effluent in 2009.
The chemicals analyzed in this study were selected because they are indicators of human- and animal-waste sources to the environment and can affect aquatic organisms, although many of the chemicals also have natural sources (Barnes and others, 2008). The presence of naturally occurring compounds alone may not indicate a human- or animal-waste source, and some of the naturally occurring chemicals are incorporated in commercial products. Details of the potential natural sources are beyond the scope of this report, but may come from microorganisms, plant or animal sources, and may include by-products of combustion or other natural processes (Barnes and others, 2008).
Purpose and Scope
This report presents the study design, methods, environ-mental data, and quality-assurance and quality-control data for the integrated chemical and biological study of concentrations of EACs, pharmaceuticals, and other organic and inorganic

Introduction 3
Figure 1. Locations of wastewater-treatment plants that discharge to surface waters in Minnesota.
Mississippi
River
Minnesota
River
Wastewater-treatment plant with continuous flow (from the Minnesota Pollution Control Agency, oral and written commun., 2008)
Greater than 1 million gallons per day
Less than 1 million gallons per day
Wastewater-treatment plant with periodic or seasonal flow (from the Minnesota Pollution Control Agency, oral and written commun., 2008)
Greater than 1 million gallons per day
Less than 1 million gallons per day
Base from the Minnesota Department of Natural Resources, 1:24,000Universal Transverse Mercator projection Zone 15
IOWA
CANADA
90° 89°91°92°93°94°95°96°97°98°
49°
48°
47°
46°
45°
44°
43°
0 60 90 120 MILES30
0 90 120 KILOMETERS30 60
EXPLANATION
LAKE
SUPERIOR
UNITED STATES
WISCONSIN
MICHIGAN
NORTHDAKOTA
SOUTHDAKOTA
MINNESOTA

4 Endocrine Active Chemicals, Pharmaceuticals, and Other Chemicals of Concern in Selected Streams
chemicals in water samples collected from the effluents from 25 WWTPs and at 24 surface-water sites upstream and 24 sites downstream from WWTP effluent discharge in Minnesota dur-ing 2009. Environmental data and quality-assurance data also are presented for bed-sediment samples that were collected and analyzed at 25 sites. This report also provides data for biological characteristics: total estrogenicity estimates of each water sample using an in-vitro bioassay, and determined con-centrations of plasma vitellogenin and other sex characteristics of caged fish from onsite exposure experiments.
Acknowledgments
This study was supported by numerous personnel from the 25 WWTPs sampled throughout Minnesota that graciously assisted with sampling and provided access for sampling. The authors also thank Paul Hoff, Leslie Goldsmith, and Gene Soderbeck from the MPCA; Dave Wright, Jack Enblom, Jan Wolf, and Allen Stevens from the Minnesota Department of Natural Resources; Kent Johnson and Mary Gale Scott from the Metropolitan Council Environmental Services; Hillary Carpenter from the Minnesota Department of Health; and Deborah Swackhamer and Paige Novak from the University of Minnesota for their advice on study design and site selection.
The authors also are grateful to USGS scientists and field staff for assistance that was critical to the completion of the study: John Greene, Josh Larson, Katie Barnella, Molly Trombley, Danielle Then, Laura Murphy, and James McLees. The following USGS programs supported this study: Toxics Substances Hydrology Program, National Research Program, and the Cooperative Water Program.
Study Design A longitudinal sampling design was utilized to sample
the wastewater effluent and surface-water sites upstream and downstream from the effluent discharge in each receiving water (fig. 2). The upstream sample provides information about contaminants originating from sources other than the WWTP of interest, and the downstream sample provides information about contributions of contaminants from the wastewater effluent.
This study was designed to use chemical and biologi-cal measures to assess the presence and effects of EACs and pharmaceuticals in Minnesota WWTP effluents and receiving waters. Chemical analyses and in-vitro and in-vivo (estroge-nicity) bioassays were used because each method has advan-tages and disadvantages addressing different questions. In this study, chemical data for EACs and other contaminants indicative of anthropogenic influence provided quantitative measures of the effects of WWTP effluents and land use on Minnesota surface waters. In-vitro cellular assays provide a method to measure the “total estrogenicity” of an aquatic environment (Martinovic and others, 2008), and in-vivo caged fish experiments provide a method to measure whole-organ-ism responses.
Site Selection
Twenty-five WWTPs (and associated receiving streams) were selected (fig. 3, table 1). Site selection was based on WWTP and landscape characteristics. WWTPs of differ-ing sizes, influent, and processing techniques were selected.
Figure 2. Relative locations of sampling sites upstream and downstream from discharge of wastewater-treatment plant effluent.
Upstream
Downstream
Wastewater-treatment plant
Wastewater-treatment plant sampling site
Water and bed-sediment sampling site and identifier
Caged fish sampling site
Streamflow
EXPLANATION

Study Design 5
Figure 3. Locations during 2009. Each square typically represents three sites (one upstream, one downstream, and one wastewater-effluent sample).
Rainy River
Red
Red Lake
Ket
tle
Sauk R
Thief
Rive
r
Otterta
ilBi
g Fo
rk R
St. C
roix
R
Cloquet
Pine
Zumbro R
Rapid River
Buffalo
Cottonwood
Root RiverRiver
Minnesota
Chippewa
Clearwater
Cannon R
North Fork Crow
Mustinka R
Sand Hill
Snak
e R
Crow
Wing R
Ceda
r
Marsh
RumRiver
River
Two River
St. Lou
is
Des Moines
Tamarac River
Roseau
Red Eye RLittle Fork
Vermilion R
Lac q
ui Pa
rle
Nemadji R
Prai
rie R
Long
River
River
River
River
River
River
River
River
River
River
River
Rive
r
Rive
r
River
River
River
River
Mississippi
Mississippi River
Le Sueur River
Watonwan River
Ely
Lynd
Duluth
Austin
Melrose
Luverne
Eveleth
Williams
St. Paul
Marshall
Hinckley
Fairmont
Zimmerman
Rochester
Lake City
Litchfield
Hutchinson
Worthington
Sauk Centre
Grand Rapids
Spring Valley
Pelican Rapids
Lester Prairie
East Grand Forks
Base from the Minnesota Department of Natural Resources, 1:24,000Universal Transverse Mercator projection Zone 15
90° 89°91°92°93°94°95°96°97°98°
49°
48°
47°
46°
45°
44°
43°
0 60 90 120 MILES30
0 90 120 KILOMETERS30 60
EXPLANATION
Open water
Developed
Barren land (rock/sand/clay)
Forest
Grasslands
Cultivated crops
Wetlands
LAKE
SUPERIOR
Land-cover classification
Wastewater-treatment plant and site numbers
1,2,3
16,17,18
13,14,15
19,20,21
7,8,9
4,5,6
10,11,12
52,53,54
22,23,2425,26,27
31,32,33
55,56,57
37,38,39
34,35,36
43,44,45
40,41,42
71,71,73
67,68,69,70
46,47,48
46,47,48
64,65,66 61,62,63
58,59,60
IOWA
CANADA
UNITED STATES
WISCONSIN
MICHIGAN
NORTHDAKOTA
SOUTHDAKOTA
MINNESOTA

6
Endocrine Active Chem
icals, Pharmaceuticals, and O
ther Chemicals of Concern in Selected Stream
sTable 1. List of sampling sites, latitude, longitude, and sampling dates.—Continued
[USGS, U.S. Geological Survey; US, upstream from wastewater-effluent discharge; DS, downstream from wastewater-effluent discharge; WWTP, wastewater-treatment plant; Minn., Minnesota; latitude and longitude are in degrees, minutes, seconds, and decimal seconds format; --, not published]
Site number (fig. 3)
USGS station identification
numberUSGS station name Major river basin
Position in relation to
wastewater- effluent
discharge
Latitude LongitudeDate water
sampled
1 05137050 Williams Creek above WWTP at Williams, Minn. Lake of the Woods US 484626.53 945708.38 10/20/2009
2 484627094570801 Williams WWTP outflow at Williams, Minn. Lake of the Woods WWTP -- -- 10/20/2009
3 05137055 Williams Creek below WWTP at Williams, Minn. Lake of the Woods DS 484627.23 945708.80 10/20/2009
4 475504091545401 Shagawa Lake at mouth of Burntside River near Ely, Minn. Rainy River US 475505.23 915453.43 09/28/2009
5 475435091522601 Ely WWTP outflow at Ely, Minn. Rainy River WWTP -- -- 09/28/2009
6 475436091522501 Shagawa Lake near Ely WWTP outflow at Ely, Minn. Rainy River DS 475435.69 915226.35 09/28/2009
7 04018765 Elbow Creek above Eveleth WWTP at Eveleth, Minn. St. Louis River US 472737.50 923244.60 09/29/2009
8 472737092324501 Eveleth WWTP outflow at Eveleth, Minn. St. Louis River WWTP -- -- 09/29/2009
9 04018767 Elbow Creek below Eveleth WWTP at Eveleth, Minn. St. Louis River DS 472736.00 923246.40 09/29/2009
10 04024025 St. Louis River at Hwy. 23 above Fond Du Lac, Minn. St. Louis River US 463929.76 921702.14 10/01/2009
11 464538092072601 Western Lake Superior Sanitary District - WWTP at Duluth, Minn. St. Louis River WWTP -- -- 10/01/2009
12 464523092065501 Lake Superior in St. Louis Bay at Duluth, Minn. St. Louis River DS 464521.77 920715.42 10/01/2009
13 05040340 Pelican River above WWTP at Pelican Rapids, Minn. Red River of the North US 463411.89 960509.38 10/19/2009
14 463408096052401 Pelican Rapids WWTP outflow at Pelican Rapids, Minn. Red River of the North WWTP -- -- 10/19/2009
15 05040345 Pelican River below WWTP at Pelican Rapids, Minn. Red River of the North DS 463411.80 960534.00 10/19/2009
16 05082520 Red River of the North above WWTP at East Grand Forks, Minn. Red River of the North US 475831.78 970333.23 10/21/2009
17 475834097032002 Wastewater outflow at East Grand Forks, Minn. Red River of the North WWTP -- -- 10/21/2009
18 475854097032001 Red River of the North below WWTP at East Grand Forks, Minn. Red River of the North DS 475853.22 970321.79 10/21/2009
19 05211020 Mississippi River above WWTP at Grand Rapids, Minn. Mississippi River US 471357.60 933123.60 09/30/2009
20 471336093301801 Grand Rapids WWTP outflow at Grand Rapids, Minn. Mississippi River WWTP -- -- 09/30/2009
21 05211030 Mississippi River below WWTP at Grand Rapids, Minn. Mississippi River DS 471259.39 932917.10 09/30/2009
22 05270181 Sauk River above Sauk Centre WWTP at Sauk Centre, Minn. Mississippi River US 454308.18 945623.93 09/16/2009
23 454308094562601 Sauk Centre WWTP outflow at Sauk Centre, Minn. Mississippi River WWTP -- -- 09/16/2009
24 05270183 Sauk River below Sauk Centre WWTP at Sauk Centre, Minn. Mississippi River DS 454251.04 945617.75 09/16/2009
25 05270195 Sauk River above Melrose WWTP at Melrose, Minn. Mississippi River US 454037.14 944813.38 09/17/2009

Study Design
7Table 1. List of sampling sites, latitude, longitude, and sampling dates.—Continued
[USGS, U.S. Geological Survey; US, upstream from wastewater-effluent discharge; DS, downstream from wastewater-effluent discharge; WWTP, wastewater-treatment plant; Minn., Minnesota; latitude and longitude are in degrees, minutes, seconds, and decimal seconds format; --, not published]
Site number (fig. 3)
USGS station identification
numberUSGS station name Major river basin
Position in relation to
wastewater- effluent
discharge
Latitude LongitudeDate water
sampled
26 454040094480701 Melrose WWTP outflow at Melrose, Minn. Mississippi River WWTP -- -- 09/17/2009
27 05270197 Sauk River below Melrose WWTP at Melrose, Minn. Mississippi River DS 454045.20 944742.70 09/17/2009
28 05274850 Tibbets Brook above WWTP outflow at Zimmerman, Minn. Mississippi River US 452559.09 933454.50 09/03/2009
29 452559093345601 Zimmerman WWTP outflow at Zimmerman, Minn. Mississippi River WWTP -- -- 09/03/2009
30 05274855 Tibbets Brook below WWTP outflow at Zimmerman, Minn. Mississippi River DS 452558.54 933456.60 09/03/2009
31 05278080 Jewitts Creek at U.S. Hwy. 12 in Litchfield, Minn. Mississippi River US 450830.49 943122.53 10/08/2009
32 450833094311001 Litchfield WWTP outflow near Litchfield, Minn. Mississippi River WWTP -- -- 10/08/2009
33 05278083 Jewitts Creek near Litchfield, Minn. Mississippi River DS 450843.27 943059.71 10/08/2009
34 05278570 South Fork of the Crow River above WWTP at Hutchinson, Minn. Mississippi River US 445220.41 942124.86 09/14/2009
35 445220094212201 Hutchinson WWTP outflow at Hutchinson, Minn. Mississippi River WWTP -- -- 09/14/2009
36 05278580 South Fork of the Crow River below Hutchinson, Minn. Mississippi River DS 445202.91 942107.69 09/14/2009
37 05278650 South Fork Crow River above WWTP at Lester Prairie, Minn. Mississippi River US 445227.70 940303.70 09/15/2009
38 445243094020301 Lester Prairie WWTP outflow at Lester Prairie, Minn. Mississippi River WWTP -- -- 09/15/2009
39 05278655 South Fork Crow River below WWTP at Lester Prairie, Minn. Mississippi River DS 445251.93 940111.00 09/15/2009
40 05314985 Redwood River above Lynd WWTP near Lynd, Minn. Mississippi River US 442415.19 955231.69 11/23/2009
41 442415095523001 Lynd WWTP outflow near Lynd, Minn. Mississippi River WWTP -- -- 11/23/2009
42 05314988 Redwood River below Lynd WWTP near Lynd, Minn. Mississippi River DS 442419.29 955221.20 11/23/2009
43 05315045 Redwood River above WWTP below Marshall, Minn. Mississippi River US 442845.50 954633.79 10/07/2009
44 442846095463201 Marshall WWTP outflow at Marshall, Minn. Mississippi River WWTP -- -- 10/07/2009
45 05315050 Redwood River below WWTP near Marshall, Minn. Mississippi River DS 442912.10 954557.47 10/07/2009
46 05318170 Center Creek on Co. Rd. 143, at Fairmont, Minn. Mississippi River US 434021.78 942745.13 09/09/2009
47 434018094273301 Fairmont WWTP outflow at Fairmont, Minn. Mississippi River WWTP -- -- 09/09/2009
48 05318171 Center Creek below WWTP at Fairmont, Minn. Mississippi River DS 434022.72 942726.18 09/09/2009
49 05331005 Mississippi River at Industrial Mollasses, St. Paul, Minn. Mississippi River US 445511.04 930304.46 09/24/2009
50 445509093024301 Metro Plant (WWTP) outflow in St. Paul, Minn. Mississippi River WWTP -- -- 09/24/2009

8
Endocrine Active Chem
icals, Pharmaceuticals, and O
ther Chemicals of Concern in Selected Stream
sTable 1. List of sampling sites, latitude, longitude, and sampling dates.—Continued
[USGS, U.S. Geological Survey; US, upstream from wastewater-effluent discharge; DS, downstream from wastewater-effluent discharge; WWTP, wastewater-treatment plant; Minn., Minnesota; latitude and longitude are in degrees, minutes, seconds, and decimal seconds format; --, not published]
Site number (fig. 3)
USGS station identification
numberUSGS station name Major river basin
Position in relation to
wastewater- effluent
discharge
Latitude LongitudeDate water
sampled
51 05331400 Mississippi River at South St. Paul, Minn. Mississippi River DS 445405.90 930217.60 09/24/2009
52 05337003 Grindstone River above WWTP near Hinckley, Minn. Mississippi River US 460106.86 925433.46 09/02/2009
53 460107092543101 Hinckley WWTP near Hinckley, Minn. Mississippi River WWTP -- -- 09/02/2009
54 05337005 Grindstone River below Hinckley, Minn. Mississippi River DS 460048.40 925323.57 09/02/2009
55 05355260 Mississippi River (Lake Pepin) above Lake City, Minn. Mississippi River US 442821.60 921624.80 09/23/2009
56 442626092152201 Lake City WWTP outflow at Lake City, Minn. Mississippi River WWTP -- -- 09/23/2009
57 05355331 Mississippi River (Lake Pepin) at Mile 771 near Lake City, Minn. Mississippi River DS 442624.90 921516.00 09/23/2009
58 05372995 South Fork Zumbro River at Rochester, Minn. Mississippi River US 440345.29 922754.75 09/22/2009
59 440350092275501 Rochester WWTP outflow at Rochester, Minn. Mississippi River WWTP -- -- 09/22/2009
60 05373005 South Fork Zumbro River below WWTP near Rochester, Minn. Mississippi River DS 440433.34 922759.58 09/22/2009
61 05383820Spring Valley Creek above Spring Valley WWTP outflow at Spring
Valley, Minn.Mississippi River US 434120.07 922250.52 09/21/2009
62 434122092225001 Spring Valley WWTP outflow at Spring Valley, Minn. Mississippi River WWTP -- -- 09/21/2009
63 05383822Spring Valley Creek below Spring Valley WWTP outflow at Spring
Valley, Minn.Mississippi River DS 434122.38 922246.33 09/21/2009
64 05455975 Cedar River above treatment plant at Austin, Minn. Mississippi River US 433924.80 925829.47 09/08/2009
65 433913092581601 Austin WWTP outflow at Austin, Minn. Mississippi River WWTP -- -- 09/08/2009
66 05455978 Cedar River below treatment plant at Austin, Minn. Mississippi River DS 433858.56 925825.74 09/08/2009
67 05474883 Okabena Creek above WWTP outflow at Worthington, Minn. Mississippi River US 433838.60 953443.60 09/09/2009
68 433838095344201 Worthington WWTP outflow at Worthington, Minn. Mississippi River WWTP-Domestic -- -- 09/09/2009
69 433847095330001 Industrial WWTP outflow near Worthington, Minn. Mississippi River WWTP-Industrial -- -- 09/09/2009
70 05474884 Okabena Creek below WWTP outflow at Worthington, Minn. Mississippi River DS 433848.54 953257.78 09/09/2009
71 06483005 Rock River above WWTP near Luverne, Minn. Missouri River US 433855.77 961154.54 10/06/2009
72 433856096115801 Luverne WWTP outflow near Luverne, Minn. Missouri River WWTP -- -- 10/06/2009
73 06483010 Rock River below WWTP near Luverne, Minn. Missouri River DS 433851.83 961157.03 10/06/2009

Methods 9
Streams or lakes with differing basin land use and varying percentages of streamflow composed of effluent were selected. Additionally, the existence of previous data and potential to work cooperatively with ongoing sample collection efforts were considered.
Site Characterization
Landscape characteristics such as basin drainage area, percentage of forested land, population, and the number of animal feedlots were generated for each sampling site using a geographic information system (GIS). The drainage basin and drainage area characteristics for each sampling site were generated from the point delineation and basin characteris-tics tools found on Minnesota’s StreamStats Web site (U.S. Geological Survey, 2009). The sampling site drainage basin outlined the total upstream area that potentially contributes surface water to the sampling location. A GIS overlay of each drainage basin on land cover, feedlot, and population data was used to generate characteristics for each site.
Percentages of land-cover type were calculated for each drainage basin using 2001 National Land Cover Data (NLCD) (U.S. Geological Survey, 2006). The NLCD is a standard-ized nationwide dataset composed of 36 land-cover classes including cultivated crops, open water, and forested upland. In table 2, the 36 NLCD land-cover classes were consolidated into seven general categories: open water, developed, barren, forest, grassland, cropland, and wetland. The area of each consolidated land-cover category was summed and divided by the total drainage area to obtain percentages of each cat-egory within each drainage basin. The population per square kilometer was estimated by overlaying each drainage basin on the 2000 block-group population data (U.S. Census Bureau, 2002). The GIS was used to identify all block groups within each study basin and calculate the percentage of the total block-group area within each drainage area. Using GIS, the percentage value of the total block-group area was multiplied by the population of the block group to estimate the population of each block group within the drainage area. The population of all block groups represented within each drainage basin was then divided by the drainage area to calculate people per square kilometer within each basin (table 2).
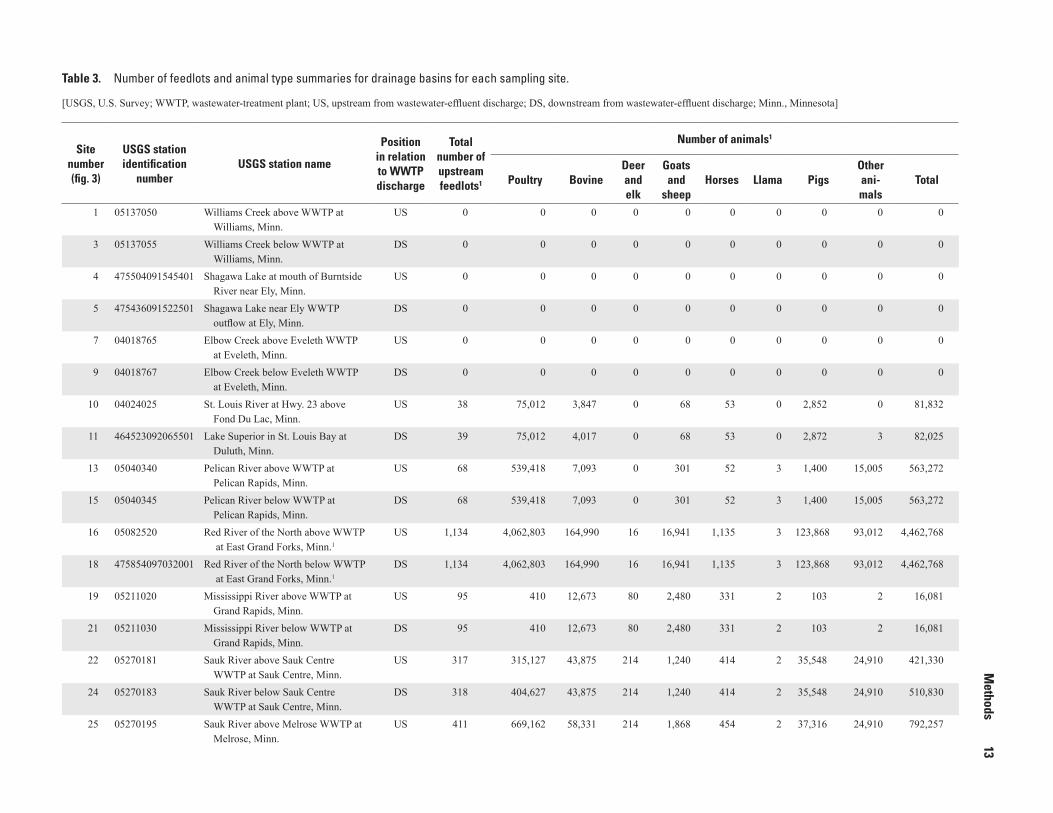
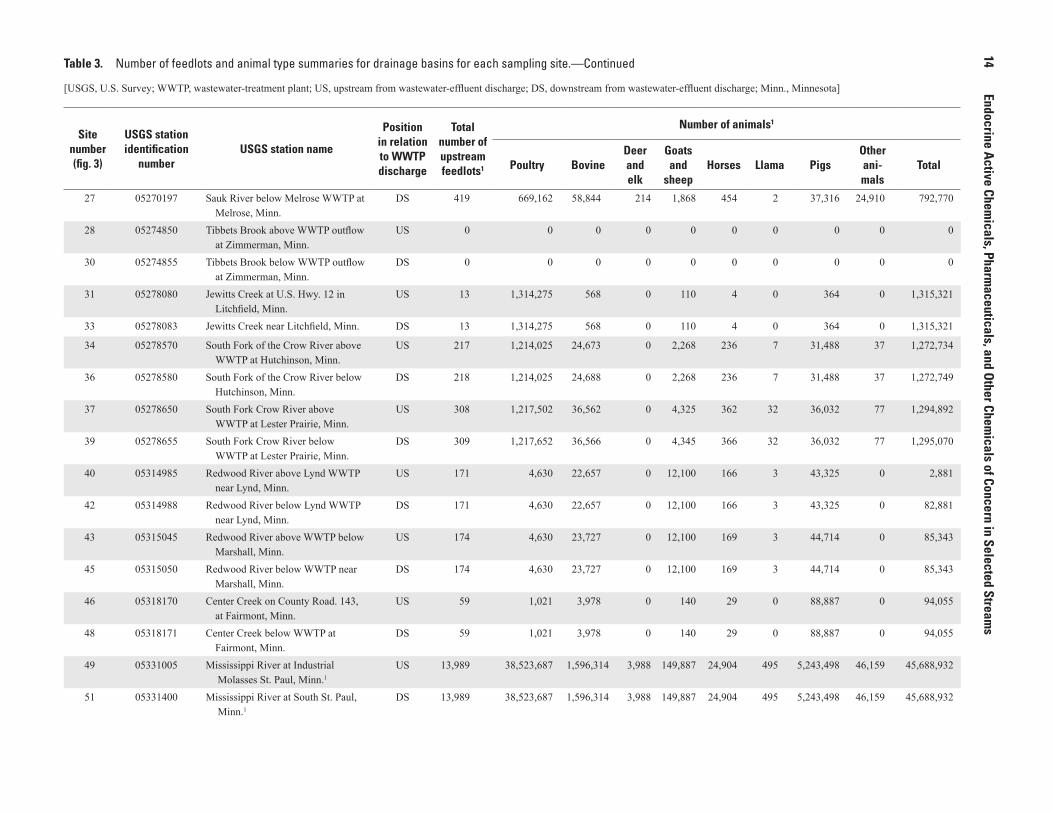
A GIS point dataset of animal feedlots that contained tab-ular information of animal type and number of animals at each location was obtained from the Minnesota Pollution Control Agency (Minnesota Pollution Control Agency, 2009) and from the Iowa Department of Natural Resources (Iowa Department of Natural Resources, 2007). A GIS overlay of each drainage basin on feedlot locations was used to identify all feedlots within each drainage basin. A summary listing of the number of feedlots, animal types, and the total number of animals within each drainage basin is provided in table 3. Six sites (station numbers 05355331, 05355260, 05331400, 05331005, 05040345, and 05082520) on the Mississippi and Red Rivers had drainage areas that included parts of North Dakota, South
Dakota, and Wisconsin. Information on animal feedlots was not available for these States, therefore, the overall number of animals for these drainage basins is likely greater than those provided in table 3.
Distances between the WWTP site and the upstream and downstream sampling sites were measured with a GIS by digitizing stream centerlines from 2008 aerial imagery (National Agriculture Imagery Program, 2008) at scales of 1:3,000–1:5,000. By study design, the characteristics of the WWTPs varied among the facilities sampled. A variety of WWTPs were selected to include those of differing treatment types (continuous flow or periodic releases), differing treat-ment processing steps (activated sludge or trickling filters), and plant design flows ranging from 0.002 to 10.9 m3/s (0.04 to 251 Mgal/d) (table 4). The WWTPs selected also varied in the population served and the distribution of incoming influent between industrial and domestic sources.
MethodsThis section of the report describes the data collection
methods for hydrologic measurements, water-sample col-lection, and bed-sediment sample collection. Deployment methods for the caged fish are described. Methods for sample processing and analyses also are described.
Data Collection
During this study, hydrologic, chemical, and biologi-cal measurements or sample collections were made. Field measurements and sample collections were completed from September 2 to November 23, 2009. The types of samples col-lected and collection procedures are described in this section.
Hydrologic Measurements Streamflow was measured at each stream site following
USGS protocols (Rantz and others, 1982a, b; Morlock and others, 2002). Daily effluent discharge values from WWTPs were obtained from each facility at the time of sampling. Basic water-quality properties (dissolved oxygen, pH, specific con-ductance, temperature, and turbidity) were measured at each site using a submersible YSI (Yellow Springs Instruments) data sonde (Yellow Springs, Ohio). The data sonde was cali-brated according to U.S. Geological Survey (variously dated) and manufacturer’s specifications before and after sampling.
The fraction of wastewater effluent (feff) in the receiving stream was estimated as follows:
fQ
Q Qeff
eff
eff us
=+ (1)

10
Endocrine Active Chem
icals, Pharmaceuticals, and O
ther Chemicals of Concern in Selected Stream
sTable 2. Population and land-cover percentages for drainage basins for sampling sites.—Continued
[USGS, U.S.Geological Survey; US, upstream from wastewater-effluent discharge; DS, downstream from wastewater-effluent discharge; WWTP, wastewater-treatment plant; Minn., Minnesota]
Site number(fig. 3)
USGS station identification
numberUSGS station name
Position in relation to
wastewater-effluent
discharge
Drainage area
(square kilometer)
Number of people
per square kilometer
Land-cover percentages
Open water
Developed Barren ForestGrass-land
Crop-land
Wet-land
1 05137050 Williams Creek above WWTP at Williams, Minn.
US 32.8 1 0 2 0 63 6 1 28
3 05137055 Williams Creek below WWTP at Williams, Minn.
DS 32.8 1 0 2 0 63 6 1 28
4 475504091545401 Shagawa Lake at mouth of Burntside River near Ely, Minn.
US 184.9 2 21 1 0 71 5 0 2
5 475436091522501 Shagawa Lake near Ely WWTP outflow at Ely, Minn.
DS 240.8 4 20 1 0 73 4 0 2
7 04018765 Elbow Creek above Eveleth WWTP at Eveleth, MN
US 4.45 238 1 32 9 46 11 0 1
9 04018767 Elbow Creek below Eveleth WWTP at Eveleth, Minn.
DS 4.48 237 1 32 9 46 11 0 1
10 04024025 St. Louis River at Hwy. 23 above Fond Du Lac, Minn.
US 9,253 11 4 3 1 62 10 0 21
11 464523092065501 Lake Superior in St. Louis Bay at Duluth, Minn.
DS 9,583 14 4 3 1 62 10 0 20
13 05040340 Pelican River above WWTP at Pelican Rapids, Minn.
US 892.8 20 21 6 0 29 23 15 5
15 05040345 Pelican River below WWTP at Pelican Rapids, Minn.
DS 894.8 20 21 6 0 29 23 15 5
16 05082520 Red River of the North above WWTP at East Grand Forks, Minn.
US 77,337 6 6 4 0 8 15 56 10
18 475854097032001 Red River of the North below WWTP at East Grand Forks, Minn.
DS 77,343 6 6 4 0 8 15 56 10
19 05211020 Mississippi River above WWTP at Grand Rapids, Minn.
US 8,475 8 16 3 0 57 8 1 16
21 05211030 Mississippi River below WWTP at Grand Rapids, Minn.
DS 8,486 8 16 3 0 57 8 1 16
22 05270181 Sauk River above Sauk Centre WWTP at Sauk Centre, Minn.
US 970.5 10 6 5 0 7 25 51 5
24 05270183 Sauk River below Sauk Centre WWTP at Sauk Centre, Minn.
DS 972.2 11 6 5 0 7 25 51 5

Methods
11
Table 2. Population and land-cover percentages for drainage basins for sampling sites.—Continued
[USGS, U.S.Geological Survey; US, upstream from wastewater-effluent discharge; DS, downstream from wastewater-effluent discharge; WWTP, wastewater-treatment plant; Minn., Minnesota]
Site number(fig. 3)
USGS station identification
numberUSGS station name
Position in relation to
wastewater-effluent
discharge
Drainage area
(square kilometer)
Number of people
per square kilometer
Land-cover percentages
Open water
Developed Barren ForestGrass-land
Crop-land
Wet-land
25 05270195 Sauk River above Melrose WWTP at Melrose, Minn.
US 1,124 12 5 5 0 7 26 51 5
27 05270197 Sauk River below Melrose WWTP at Melrose, Minn.
DS 1,134 12 5 5 0 7 26 51 5
28 05274850 Tibbets Brook above WWTP outflow at Zimmerman, Minn.
US 18.5 96 11 10 0 25 28 18 8
30 05274855 Tibbets Brook below WWTP outflow at Zimmerman, Minn.
DS 18.5 96 11 10 0 25 28 18 8
31 05278080 Jewitts Creek at U.S. Hwy. 12 in Litchfield, Minn.
US 67.5 57 9 13 0 7 10 55 5
33 05278083 Jewitts Creek near Litchfield, Minn. DS 67.9 58 9 13 0 7 10 55 5
34 05278570 South Fork of the Crow River above WWTP at Hutchinson, Minn.
US 1,160 23 7 6 0 3 8 74 3
36 05278580 South Fork of the Crow River below Hutchinson, Minn.
DS 1,162 23 7 6 0 3 8 74 3
37 05278650 South Fork Crow River above WWTP at Lester Prairie, Minn.
US 1,460 23 6 6 0 4 9 74 3
39 05278655 South Fork Crow River below WWTP at Lester Prairie, Minn.
DS 1,463 23 6 6 0 4 9 73 3
40 05314985 Redwood River above Lynd WWTP near Lynd, Minn.
US 660.5 5 4 6 0 1 19 67 3
42 05314988 Redwood River below Lynd WWTP near Lynd, Minn.
DS 660.5 5 4 6 0 1 19 67 3
43 05315045 Redwood River above WWTP below Marshall, Minn.
US 692 14 3 7 0 1 19 66 3
45 05315050 Redwood River below WWTP near Marshall, Minn.
DS 696.4 14 3 7 0 1 19 67 3
46 05318170 Center Creek on Co. Rd. 143, at Fairmont, Minn.
US 238.2 44 6 12 0 1 4 75 2
48 05318171 Center Creek below WWTP at Fairmont, Minn.
DS 238.5 44 6 12 0 1 4 75 2
49 05331005 Mississippi River at Industrial Molasses St. Paul, Minn.
US 95,703 35 6 6 0 20 14 45 9

12
Endocrine Active Chem
icals, Pharmaceuticals, and O
ther Chemicals of Concern in Selected Stream
sTable 2. Population and land-cover percentages for drainage basins for sampling sites.—Continued
[USGS, U.S.Geological Survey; US, upstream from wastewater-effluent discharge; DS, downstream from wastewater-effluent discharge; WWTP, wastewater-treatment plant; Minn., Minnesota]
Site number(fig. 3)
USGS station identification
numberUSGS station name
Position in relation to
wastewater-effluent
discharge
Drainage area
(square kilometer)
Number of people
per square kilometer
Land-cover percentages
Open water
Developed Barren ForestGrass-land
Crop-land
Wet-land
51 05331400 Mississippi River at South St. Paul, Minn.
DS 95,712 36 6 6 0 20 14 45 9
52 05337003 Grindstone River above WWTP near Hinckley, Minn.
US 206.7 9 4 0 40 32 3 19
54 05337005 Grindstone River below Hinckley, Minn.
DS 209.4 9 2 4 0 40 32 4 19
55 05355260 Mississippi River (Lake Pepin) above Lake City, Minn.
US 122,558 34 5 6 0 25 15 39 9
57 05355331 Mississippi River (Lake Pepin) at Mile 771 near Lake City, Minn.
DS 122,578 34 5 6 0 25 15 39 9
58 05372995 South Fork Zumbro River at Roches-ter, Minn.
US 778.9 106 0 15 0 8 23 52 1
60 05373005 South Fork Zumbro River below WWTP near Rochester, Minn.
DS 807.9 111 0 15 0 8 24 51 1
61 05383820 Spring Valley Creek above Spring Valley WWTP outflow at Spring Valley, Minn.
US 40.5 40 0 11 0 2 6 81 0
63 05383822 Spring Valley Creek below Spring Valley WWTP outflow at Spring Valley, Minn.
DS 40.6 41 0 11 0 2 6 81 0
64 05455975 Cedar River above treatment plant at Austin, Minn.
US 631 29 0 9 0 1 6 82 2
66 05455978 Cedar River below treatment plant at Austin, Minn.
DS 631.6 30 0 9 0 1 6 82 2
67 05474883 Okabena Creek above WWTP outflow at Worthington, Minn.
US 8.1 672 0 66 0 0 3 30 1
70 05474884 Okabena Creek below WWTP outflow at Worthington, Minn.
DS 15.06 386 0 46 0 0 3 49 1
71 06483005 Rock River above WWTP near Luverne, Minn.
US 1,085 6 0 6 0 1 17 76 1
73 06483010 Rock River below WWTP near Luverne, Minn.
DS 1,085 6 0 6 0 1 17 76 1
Methods
13
Table 3. Number of feedlots and animal type summaries for drainage basins for each sampling site.—Continued
[USGS, U.S. Survey; WWTP, wastewater-treatment plant; US, upstream from wastewater-effluent discharge; DS, downstream from wastewater-effluent discharge; Minn., Minnesota]
Sitenumber(fig. 3)
USGS station identification
numberUSGS station name
Position in relation to WWTP discharge
Total number of upstream feedlots1
Number of animals1
Poultry BovineDeer and elk
Goats and
sheepHorses Llama Pigs
Other ani-mals
Total
1 05137050 Williams Creek above WWTP at Williams, Minn.
US 0 0 0 0 0 0 0 0 0 0
3 05137055 Williams Creek below WWTP at Williams, Minn.
DS 0 0 0 0 0 0 0 0 0 0
4 475504091545401 Shagawa Lake at mouth of Burntside River near Ely, Minn.
US 0 0 0 0 0 0 0 0 0 0
5 475436091522501 Shagawa Lake near Ely WWTP outflow at Ely, Minn.
DS 0 0 0 0 0 0 0 0 0 0
7 04018765 Elbow Creek above Eveleth WWTP at Eveleth, Minn.
US 0 0 0 0 0 0 0 0 0 0
9 04018767 Elbow Creek below Eveleth WWTP at Eveleth, Minn.
DS 0 0 0 0 0 0 0 0 0 0
10 04024025 St. Louis River at Hwy. 23 above Fond Du Lac, Minn.
US 38 75,012 3,847 0 68 53 0 2,852 0 81,832
11 464523092065501 Lake Superior in St. Louis Bay at Duluth, Minn.
DS 39 75,012 4,017 0 68 53 0 2,872 3 82,025
13 05040340 Pelican River above WWTP at Pelican Rapids, Minn.
US 68 539,418 7,093 0 301 52 3 1,400 15,005 563,272
15 05040345 Pelican River below WWTP at Pelican Rapids, Minn.
DS 68 539,418 7,093 0 301 52 3 1,400 15,005 563,272
16 05082520 Red River of the North above WWTP at East Grand Forks, Minn.1
US 1,134 4,062,803 164,990 16 16,941 1,135 3 123,868 93,012 4,462,768
18 475854097032001 Red River of the North below WWTP at East Grand Forks, Minn.1
DS 1,134 4,062,803 164,990 16 16,941 1,135 3 123,868 93,012 4,462,768
19 05211020 Mississippi River above WWTP at Grand Rapids, Minn.
US 95 410 12,673 80 2,480 331 2 103 2 16,081
21 05211030 Mississippi River below WWTP at Grand Rapids, Minn.
DS 95 410 12,673 80 2,480 331 2 103 2 16,081
22 05270181 Sauk River above Sauk Centre WWTP at Sauk Centre, Minn.
US 317 315,127 43,875 214 1,240 414 2 35,548 24,910 421,330
24 05270183 Sauk River below Sauk Centre WWTP at Sauk Centre, Minn.
DS 318 404,627 43,875 214 1,240 414 2 35,548 24,910 510,830
25 05270195 Sauk River above Melrose WWTP at Melrose, Minn.
US 411 669,162 58,331 214 1,868 454 2 37,316 24,910 792,257
14
Endocrine Active Chem
icals, Pharmaceuticals, and O
ther Chemicals of Concern in Selected Stream
sTable 3. Number of feedlots and animal type summaries for drainage basins for each sampling site.—Continued
[USGS, U.S. Survey; WWTP, wastewater-treatment plant; US, upstream from wastewater-effluent discharge; DS, downstream from wastewater-effluent discharge; Minn., Minnesota]
Sitenumber(fig. 3)
USGS station identification
numberUSGS station name
Position in relation to WWTP discharge
Total number of upstream feedlots1
Number of animals1
Poultry BovineDeer and elk
Goats and
sheepHorses Llama Pigs
Other ani-mals
Total
27 05270197 Sauk River below Melrose WWTP at Melrose, Minn.
DS 419 669,162 58,844 214 1,868 454 2 37,316 24,910 792,770
28 05274850 Tibbets Brook above WWTP outflow at Zimmerman, Minn.
US 0 0 0 0 0 0 0 0 0 0
30 05274855 Tibbets Brook below WWTP outflow at Zimmerman, Minn.
DS 0 0 0 0 0 0 0 0 0 0
31 05278080 Jewitts Creek at U.S. Hwy. 12 in Litchfield, Minn.
US 13 1,314,275 568 0 110 4 0 364 0 1,315,321
33 05278083 Jewitts Creek near Litchfield, Minn. DS 13 1,314,275 568 0 110 4 0 364 0 1,315,321
34 05278570 South Fork of the Crow River above WWTP at Hutchinson, Minn.
US 217 1,214,025 24,673 0 2,268 236 7 31,488 37 1,272,734
36 05278580 South Fork of the Crow River below Hutchinson, Minn.
DS 218 1,214,025 24,688 0 2,268 236 7 31,488 37 1,272,749
37 05278650 South Fork Crow River above WWTP at Lester Prairie, Minn.
US 308 1,217,502 36,562 0 4,325 362 32 36,032 77 1,294,892
39 05278655 South Fork Crow River below WWTP at Lester Prairie, Minn.
DS 309 1,217,652 36,566 0 4,345 366 32 36,032 77 1,295,070
40 05314985 Redwood River above Lynd WWTP near Lynd, Minn.
US 171 4,630 22,657 0 12,100 166 3 43,325 0 2,881
42 05314988 Redwood River below Lynd WWTP near Lynd, Minn.
DS 171 4,630 22,657 0 12,100 166 3 43,325 0 82,881
43 05315045 Redwood River above WWTP below Marshall, Minn.
US 174 4,630 23,727 0 12,100 169 3 44,714 0 85,343
45 05315050 Redwood River below WWTP near Marshall, Minn.
DS 174 4,630 23,727 0 12,100 169 3 44,714 0 85,343
46 05318170 Center Creek on County Road. 143, at Fairmont, Minn.
US 59 1,021 3,978 0 140 29 0 88,887 0 94,055
48 05318171 Center Creek below WWTP at Fairmont, Minn.
DS 59 1,021 3,978 0 140 29 0 88,887 0 94,055
49 05331005 Mississippi River at Industrial Molasses St. Paul, Minn.1
US 13,989 38,523,687 1,596,314 3,988 149,887 24,904 495 5,243,498 46,159 45,688,932
51 05331400 Mississippi River at South St. Paul, Minn.1
DS 13,989 38,523,687 1,596,314 3,988 149,887 24,904 495 5,243,498 46,159 45,688,932

Methods
15
Table 3. Number of feedlots and animal type summaries for drainage basins for each sampling site.—Continued
[USGS, U.S. Survey; WWTP, wastewater-treatment plant; US, upstream from wastewater-effluent discharge; DS, downstream from wastewater-effluent discharge; Minn., Minnesota]
Sitenumber(fig. 3)
USGS station identification
numberUSGS station name
Position in relation to WWTP discharge
Total number of upstream feedlots1
Number of animals1
Poultry BovineDeer and elk
Goats and
sheepHorses Llama Pigs
Other ani-mals
Total
52 05337003 Grindstone River above WWTP near Hinckley, Minn.
US 9 0 1,078 0 0 10 0 0 0 1,088
54 05337005 Grindstone River below Hinckley, Minn.
DS 11 0 1,396 0 0 10 0 0 0 1,406
55 05355260 Mississippi River (Lake Pepin) above Lake City, Minn.1
US 16,035 41,163,689 1,794,522
4,974 163,778 29,066 585 5,571,698 87,257 49,115,569
57 05355331 Mississippi River (Lake Pepin) at Mile 771 near Lake City, Minn.1
DS 16,035 41,163,689 1,794,522
4,974 163,778 29,066 585 5,571,698 87,257 49,115,569
58 05372995 South Fork Zumbro River at Rochester, Minn.
US 220 99,599 21,747 0 1,154 394 0 63,428 0 86,322
60 05373005 South Fork Zumbro River below WWTP near Rochester, Minn.
DS 223 99,599 22,181 0 1,154 394 0 63,773 0 87,101
61 05383820 Spring Valley Creek above Spring Valley WWTP outflow at Spring Valley, Minn.
US 9 0 728 0 49 0 0 872 0 1,649
63 05383822 Spring Valley Creek below Spring Valley WWTP outflow at Spring Valley, Minn.
DS 9 0 728 0 49 0 0 872 0 1,649
64 05455975 Cedar River above treatment plant at Austin, Minn.
US 213 56,965 9,168 50 1,254 306 0 125,007 35 192,785
66 05455978 Cedar River below treatment plant at Austin, Minn.
DS 213 56,965 9,168 50 1,254 306 0 125,007 35 192,785
67 05474883 Okabena Creek above WWTP outflow at Worthington, Minn.
US 2 0 0 0 0 0 0 3,600 0 3,600
70 05474884 Okabena Creek below WWTP outflow at Worthington, Minn.
DS 3 0 150 0 0 0 0 3,600 0 3,750
71 06483005 Rock River above WWTP near Luverne, Minn.
US 447 71,066 65,950 0 6,247 228 1 178,376 3 321,871
73 06483010 Rock River below WWTP near Luverne, Minn.
DS 447 71,066 65,950 0 6,247 228 1 178,376 3 321,871
1Stations 05355331, 05355260, 05331400,05331005, 05040345, and 05082520 have contributing drainage areas in North Dakota, South Dakota, and Wisconsin. Specific location information for animal feedlots was not available for these States. Therefore, the overall numbers of animals for these stations are likely greater than those provided.

16
Endocrine Active Chem
icals, Pharmaceuticals, and O
ther Chemicals of Concern in Selected Stream
sTable 4. Characteristics of wastewater-treatment plants sampled.—Continued
[NPDES, National Pollutant Discharge Elimination System; USGS, U.S. Geological Survey; Mgal/d, million gallons per day; m3/s, cubic meters per second; Chl, chlorination; DEChl, dechlorination; UV, ultraviolet; WWTP, wastewater-treatment plant; Minn., Minnesota]
NPDES identification
number
Site number (fig. 3)
USGS station nameDesign
flow (Mgal/d)
Design flow
(m3/s)Type Treatment processes Disinfection1
Phosphorus limits exist?
Population served
Percent domestic
Percent industrial
MN0021679 2 Williams WWTP outflow at Williams, Minn.
0.08 0.0035 Continuous Activated sludge, extended aeration
UV Yes 865 100 0
MN0020508 5 Ely WWTP outflow at Ely, Minn.
1.5 .0657 Continuous Activated sludge, extended aeration; sand filters
Chl/DEChl Yes 3,900 100 0
MN0023337 8 Eveleth WWTP outflow at Eveleth, Minn.
1 .0438 Continuous Activated sludge, extended aeration; sand filters
Chl/DEChl Yes 3,900 99 1
MN0049786 11 Western Lake Superior Sanitary District —WWTP at Duluth, Minn
48.4 2.119 Continuous Activated sludge, pure oxy-gen; sand filters
Chl/DEChl Yes 111,203 55 45
MN0022225 13 Pelican Rapids WWTP outflow at Pelican Rapids, Minn.
.91 .0398 Continuous Trickling filter; rotating biological contactor
Chl/DEChl Yes 2,476 67 33
MN0021814 17 Wastewater outflow at East Grand Forks, Minn.
1.4 .0613 Controlled Stabilization ponds Chl/DEChl No 8,000 80 20
MN0022080 20 Grand Rapids WWTP outflow at Grand Rapids, Minn.
15.2 .6657 Continuous Activated sludge, contact stabilization, conven-tional, step feed
Chl/DEChl No 12,000 10 90
MN0024821 23 Sauk Centre WWTP outflow at Sauk Centre, Minn.
.88 .0385 Continuous Activated sludge, contact stabilization, conven-tional, step feed
Chl/DEChl Yes 4,111 100 0
MN0020290 26 Melrose WWTP outflow at Melrose, Minn.
3 .1314 Continuous Trickling filter; activated sludge, contact stabiliza-tion, conventional, step feed
Chl/DEChl Yes 3,400 20 80
MN0042331 29 Zimmerman WWTP outflow at Zimmerman, Minn.
.45 .0197 Continuous Activated sludge, conven-tional, sequencing batch reactors
UV Yes 5,000 100 0
MN0023973 32 Litchfield WWTP outflow near Litchfield, Minn.
2.4 .1051 Continuous Trickling filter; activated sludge, contact stabiliza-tion, convention, step feed
Chl/DEChl Yes 7,500 50 50
MN0055832. 35 Hutchinson WWTP outflow at Hutchinson, Minn.
5.4 .2365 Continuous Membrane bioreactor2 NA No 13,900 68 32
MN0023957 38 Lester Prairie WWTP outflow at Lester Prairie, Minn.
.36 .0157 Continuous Activated sludge, extended aeration, oxidation ditch
UV Yes 1,774 90 10
MNG580030 41 Lynd WWTP outflow near Lynd, Minn.
.045 .0019 Controlled Stabilization ponds Chl/DEChl No 410 90 10

Methods
17
Table 4. Characteristics of wastewater-treatment plants sampled.—Continued
[NPDES, National Pollutant Discharge Elimination System; USGS, U.S. Geological Survey; Mgal/d, million gallons per day; m3/s, cubic meters per second; Chl, chlorination; DEChl, dechlorination; UV, ultraviolet; WWTP, wastewater-treatment plant; Minn., Minnesota]
NPDES identification
number
Site number (fig. 3)
USGS station nameDesign
flow (Mgal/d)
Design flow
(m3/s)Type Treatment processes Disinfection1
Phosphorus limits exist?
Population served
Percent domestic
Percent industrial
MN0022179 44 Marshall WWTP outflow at Marshall, Minn.
4.5 0.1971 Continuous Trickling filter; activated sludge, contact stabiliza-tion, conventional, step fee; sand filter
UV Yes 13,000 40 60
MN0030112 47 Fairmont WWTP outflow at Fairmont, Minn.
3.9 .1708 Continuous Activated sludge, contact stabilization, conven-tional, step feed
UV Yes 10,889 82 18
MN0029815 50 Metro Plant (WWTP) out-flow in St. Paul, Minn.
251 10.99 Continuous Activated sludge, contact stabilization, conven-tional, step feed
Chl/DEChl Yes 1,800,000 na na
MN0023701 53 Hinckley WWTP near Hinckley, Minn.
.5 .0219 Continuous Activated sludge, extended aeration
UV Yes 1,438 100 0
MN0020664 56 Lake City WWTP outflow at Lake City, Minn.
1.52 .066576 Continuous Activated sludge, contact stabilization, conven-tional, step feed
UV Yes 5,300 75 25
MN0024619 59 Rochester WWTP outflow at Rochester, Minn.
19.1 .83658 Continuous Activated sludge, pure oxygen
Chl/DEChl Yes 100,000 50 50
MN0051934 62 Spring Valley WWTP outflow at Spring Valley, Minn.
.94 .041172 Continuous Activated sludge, extended aeration, oxidation ditch
Chl/DEChl No 2,561 95 5
MN0022683 65 Austin WWTP outflow at Austin, Minn.
8.5 .3723 Continuous Trickling filter Chl/DEChl No 23,000 67 33
MN0031186 68 Worthington WWTP outflow at Worthington, Minn.
4 .1752 Continuous Trickling filter Chl Yes 11,283 97 3
MN0031178 69 Industrial WWTP outflow near Worthington, Minn.
2.29 .0876 Continuous Anaerobic ponds; activated sludge extended aeration; sand filters
Chl Yes 0 0 100
MN0020141 72 Luverne WWTP outflow near Luverne, Minn.
1.5 .0657 Continuous Activated sludge; trickling filter
Chl/DEChl No 4,617 90 10
1 Minnesota WWTPs are required to disinfect seasonally according to State of Minnesota Rule 7053.0215 subpart 1 (Minnesota Office of the Revisor of Statutes, 2010). Disinfection was occurring during sampling.
2 Effluent that had passed through the activated sludge membrane bio-reactor was sampled.

18 Endocrine Active Chemicals, Pharmaceuticals, and Other Chemicals of Concern in Selected Streams
where Qeff (in cubic meters per second ) is the total
discharge of wastewater effluent on the day of sampling (provided by the wastewater operator) and
Qus (in cubic meters per second) is the measured streamflow at the upstream site on the day of the sampling using USGS protocols (Rantz and others, 1982a, b).
Tracer studies using rhodamine WT dye (20-percent active ingredient, Ben Meadows®, Janesville, Wisc.) were performed at selected WWTPs. Using methods developed by Kilpatrick and Wilson (1989), a pre-determined volume of rhodamine WT dye (Vs; in liters) was added to the effluent channel of the WWTP, based on an estimate of streamflow (Qm; in cubic feet per second), distance to the downstream sampling site (L; in miles), estimated stream velocity (uest; in feet per second), and a desired peak concentration of less than 100 µg/L of dye at the downstream monitoring site (Cp):
V x
Q L
uCm
estp
=
−3 4 10 4.
(2)
After the rhodamine WT dye was added to the effluent channel, relative fluorescence was measured at the down-stream site using either a YSI fluorometer (Yellow Springs, Ohio) or a Self-Contained Underwater Fluorescence Appa-ratus (SCUFA, Turner Designs, Sunnyvale, Calif.). Instru-ments were placed at 50 percent of the channel width. Median hydraulic transit times (tmed) were determined as the time when one-half of the measured mass of rhodamine WT dye (assum-ing constant streamflow) passed the observation point (Runkel, 2002).
Additionally, hydrologic properties such as downstream width, downstream depth and stream slope were measured at each site at which a tracer study was performed. Stream width and average stream depth at the downstream site were measured coincident with the streamflow measurement at each location. The wetted stream width was measured along the stream cross-section where the streamflow measurement was completed. Stream depths were measured at each location where stream velocities were recorded. Stream slope estimates were determined for each site by locating points where con-tour lines cross stream lines on USGS 1:24,000 topographic maps. The distance between contour crossings was measured using high-resolution national hydrography data (U.S. Geo-logical Survey, 2008). The distance between contour crossings was divided by the change in altitude to obtain stream slope.
These hydraulic properties were used to calculate the theoretical mixing distance (Lm; in meters) at which a side discharge would be completely mixed. The distance Lm is dependent upon the longitudinal dispersion coefficient (Elat; in meters squared per second; eq. 4), average velocity of the river (uest; in meters per second), and stream width (B; in meters) (Fisher and others, 1979). The shear velocity (U*; in
meters per second; eq. 5) defines these parameters, and can be computed from the gravitational constant (g; 9.8 meters per second per second), the depth of the river (H; in meters), and the stream slope (S; in meters per meter).
L
u B
Emlat
=0 1 2 2. ( )
(3)
E HUlat
= ( . ) *0 6 (4)
U gHS* = (5)
Water-Sample CollectionIntegrated width-and depth-sampling techniques were
used to collect water from streams (U.S. Geological Survey, variously dated). A modified approach was used to collect lake water samples including a depth integrated sample from 10 locations radiating from the effluent discharge location. Wastewater was collected directly from each WWTP effluent discharge channel. Following collection, water samples were composited into a Teflon® churn and chilled before processing. Chilled water samples were processed within 1 to 2 hours of collection before shipping to their respective laboratories.
USGS clean-sampling techniques were used to collect samples (U.S. Geological Survey, variously dated). In order to avoid contamination of samples, personnel avoided use of personal-care items such as insect repellent, sunscreen, cologne, aftershave, and perfume; and they did not consume caffeinated or tobacco products during (or immediately before) collection or processing of samples; and they wore powder-less, disposable gloves during sample collection. All samples were collected with inert materials such as Teflon®, glass, or stainless steel. All collection and processing equipment was cleaned between sampling sites with a succession of native water, soapy (liquinox) tap water, tap water, deionized water, methanol, and organic-free water rinses.
Bed-Sediment Sample CollectionBed-sediment samples were collected upstream and
downstream from each WWTP according to established proto-cols (U.S. Geological Survey, variously dated). Bed sediment was collected at 5–10 locations at each site using techniques that obtained the most recent bed-sediment deposition (top 10 centimeters (cm)). Samples were collected with a stainless steel Eckman grab sampler or other stainless steel coring equip-ment. The bed-sediment sample was discarded and resampled if it contained a large amount of vegetation or appeared to be disturbed. Bed-sediment samples were transferred to a glass

Methods 19
bowl and homogenized with a stainless steel spoon for 5 min-utes. Approximately 100–200 grams (g) of unsieved wet mate-rial was placed in wide-mouth, glass containers, and frozen. All but 25 samples were archived frozen at -4 degrees Celsius (oC) for potential future analyses; the subset of 25 samples underwent chemical analyses.
Caged Fish Deployment
Fathead minnows (Pimphales promelas) were obtained from a laboratory fish supplier (Environmental Testing and Consulting, Superior, Wisc.). The minnows were caged and deployed at 13 sites in three river systems during the fall of 2009. Cages were placed in the wastewater-effluent discharge channels from five WWTPs (Sauk Center, Melrose, Hutchin-son, Lester Prairie, and Litchfield) in three river systems (Sauk River, South Fork of the Crow River, and Jewitts Creek). For each site, fish were caged upstream from the effluent discharge location, in the effluent discharge, and in the mixing zone downstream from the effluent discharge location. At each site, two cages (wire-mesh, 10 cm by 10 cm by 24 cm) were deployed. One cage contained 15 male fathead minnows, and the second cage contained 15 female fathead minnows. Fish were caged for 14 days before retrieval. In addition, 15 male and 15 female fathead minnows were processed prior to deployment to serve as a pre-deployment baseline (control) group.
Sample Processing and Analyses
This section describes the methods used to process and analyze water and bed-sediment samples. Methods for biologi-cal analyses also are described. Six laboratories performed analyses for samples in this study: (1) the USGS National Water Quality Laboratory (USGS-NWQL) in Denver Colo., (2) the USGS National Research Program Laboratory (USGS-NRPL) in Boulder, Colo., (3) the USGS Iowa Sediment Labo-ratory (USGS-IASED) in Iowa City, Iowa, (4) the University of Colorado Center for Environmental Mass Spectrometry in Boulder, Colo., (5) the UST Laboratory, and (6) the SCSU Aquatic Toxicology Laboratory.
Surface-Water and Wastewater-Effluent Chemical Analyses
The surface-water and wastewater-effluent samples (water samples) were split into numerous fractions for analy-ses. The USGS-NWQL analyzed water samples for major ions, nutrients, and pharmaceuticals. The USGS-IASED analyzed water samples for suspended sediments. The USGS-NRPL analyzed water samples for trace elements, major ions, alkylphenols and other neutral organic compounds, carboxylic acid compounds, and steroidal hormones. Water samples were sent to the UST Laboratory for estimation of
total estrogenicity. Phytoestrogens, pharmaceuticals, and an antimicrobial compound were analyzed at the University of Colorado Center for Environmental Mass Spectrometry in Boulder, Colo.
Samples were analyzed for 2 major ions and 8 nutri-ents at the USGS-NWQL (table 5) using standard analytical techniques described in Patton and Truitt (1992), U.S. Envi-ronmental Protection Agency (1993), and Fishman and others (1994). Samples analyzed for dissolved major-ion and most nutrient concentrations were filtered using 0.45-micrometer (µm) pore-size encapsulated filters. Nutrient samples were preserved with 1 milliliter (mL) of 4.5 normal sulfuric acid and maintained at 4°C until analyzed at the USGS-NWQL. Samples analyzed to determine total nutrient concentrations were not filtered. Dissolved phosphorus was analyzed using U.S. Environmental Protection Agency method 365.1, low-level persulfate digestion (U.S. Environmental Protection Agency, 1993). Suspended-sediment samples were analyzed for particle size and concentrations at the USGS-IASED using methods described by Guy (1969).
Samples were analyzed for 54 trace elements and major ions (table 5). Samples were filtered (47-millimenter (mm) diameter, 0.4-µm polycarbonate filter, GE Waters and Process Technologies, Trevose, Penn.) and preserved by acidification with ultra-high purity nitric acid. Trace elements were deter-mined at the USGS-NRPL by inductively coupled plasma/mass spectrometry using a Perkin Elmer model Elan 6000 mass spectrometer (Garbarino and Taylor,1994; Taylor, 2001). Multiple internal standards (indium, iridium, and rhodium) were used to normalize the inductively coupled plasma/mass spectrometry system for drift. Major ions were determined at the USGS-NRPL using inductively coupled plasma atomic-emission spectrometry using a Perkin Elmer model DV3300 emission spectrometer (Garbarino and Taylor, 1979). Con-centrations were determined in triplicate for each sample and the results are an average of the three analyses. Interelement interference corrections were applied during post analysis data processing to optimize accuracy and precision.
Water samples were analyzed for 16 pharmaceuticals at the USGS-NWQL (table 5) using methods described by Furlong and others (2008). For this method, a water sample is filtered in the field using a 0.7-μm nominal pore-size glass-fiber filter, and then upon arrival at the laboratory the sample is amended with a method performance surrogate solution and passed through a solid-phase extraction (SPE) cartridge. Pharmaceuticals retained on the SPE bed are eluted from the cartridge sequentially with methanol followed by acidified methanol. The extract is reduced in volume using nitrogen evaporation, fortified with an internal standard solution, and analyzed using high-performance liquid chromatography/mass spectrometry to determine individual pharmaceutical concen-trations ranging from 0.005 to 1.0 µg/L, based on the lowest and the highest calibration standards routinely used.
Water samples were analyzed for 10 phytoestrogens (Ferrer and others, 2009), 1 antimicrobial, and 8 additional pharmaceuticals at the University of Colorado Center for

20 Endocrine Active Chemicals, Pharmaceuticals, and Other Chemicals of Concern in Selected Streams
Table 5. Properties and chemicals analyzed in water or bed-sediment samples. —Continued
[CASRN, Chemical Abstracts Services Registry Number; µS/cm, microsiemens per centimeter at 25 degrees Celsius (°C); mg/L, milligrams per liter; µg/L, micrograms per liter; nm, nanometers; ng/L, nanograms per liter; ng/g, nanograms per gram; g/kg, grams per kilogram; >, greater than; UV, ultraviolet; --, not applicable]
Property/chemical nameLaboratory reporting
levelCASRN1
Basic water-quality properties measured in the field
Air pressure (millimeters of mercury) -- --Air temperature (°C) -- --Discharge/streamflow (cubic meters per second; cubic feet per second) -- --Dissolved oxygen (mg/L) -- --pH -- --Specific conductance (µS/cm) -- --Water temperature (°C) -- --Turbidity (nephelometric turbidity units) -- --
Major ions and nutrients analyzed in water at the USGS National Water Quality Laboratory and suspended sediment analyzed at the USGS Iowa Sediment Laboratory (mg/L)
Filtered (dissolved) chloride 0.12 16887–00–6Filtered (dissolved) sulfate .18 14808–79–8Filtered (dissolved) ammonia plus organic nitrogen as nitrogen .1 17778–88–0Unfiltered (total) ammonia plus organic nitrogen as nitrogen .1 17778–88–0Filtered (dissolved) ammonia as nitrogen .02 7664–41–7Filtered (dissolved) nitrate plus nitrite as nitrogen .04 --Filtered (dissolved) nitrite as nitrogen .002 14797–65–0Filtered (dissolved) orthophosphate as phosphorus .008 14265–44–2Filtered (dissolved) phosphorus .006 7723–14–0Unfiltered (total)phosphorus .008 7723–14–0Suspended sediment -- --
Trace elements and major ions analyzed in water at the USGS National Research Program Laboratory (μg/L, unless noted)
Aluminum 0.07 7429–90–5Antimony .004 7440–36–0Arsenic .02 7440–38–2Boron 3.0 7440–42–8Barium .01 7440–39–3Beryllium .007 7440–41–7Bismuth .002 7440–69–9Cadmium .0007 7440–43–9Calcium (mg/L) .01 7440–70–2Cerium .0002 7440–45–1Cesium .002 7440–46–2Chromium .1 7440–47–3Cobalt .2 7440–48–4Copper .005 7440–50–8Dysprosium .0003 7429–91–6Erbium .0001 7440–52–0Europium .0001 7440–53–1

Methods 21
Table 5. Properties and chemicals analyzed in water or bed-sediment samples. —Continued
[CASRN, Chemical Abstracts Services Registry Number; µS/cm, microsiemens per centimeter at 25 degrees Celsius (°C); mg/L, milligrams per liter; µg/L, micrograms per liter; nm, nanometers; ng/L, nanograms per liter; ng/g, nanograms per gram; g/kg, grams per kilogram; >, greater than; UV, ultraviolet; --, not applicable]
Property/chemical nameLaboratory reporting
levelCASRN1
Trace elements and major ions analyzed in water at the USGS National Research Program Laboratory (μg/L, unless noted)—Continued
Gadolinium 0.0002 7440–54–2Holmium .0001 7440–60–0Iron 1.3 7439–89–6Lanthanum .0001 7439–91–0Lead .001 7439–92–1Lithium .01 7439–93–2Lutetium .00007 7439–94–3Magnesium (mg/L) .01 7439–95–4Manganese .01 7439–96–5Molybdenum .03 7439–98–7Neodymium .0005 7440–00–8Nickel .4 7440–02–0Phosphorus 12 7723–14–0Potassium (mg/L) .009 7440–09–7Praseodymium .0001 7440–10–0Rhenium .0001 7440–15–5Rubidium .002 7440–17–7Samarium .0006 7440–19–9Selenium .3 7782–49–2Silica (mg/L) .007 60676–86–0Sodium (mg/L) .1 7440–23–5Strontium .04 7440–24–6Sulfur (mg/L) .04 7704–34–9Tellurium .005 13494–80–9Terbium .00006 7440–27–9Thallium .007 7440–28–0Thorium .0005 --Thulium .00004 7440–30–4Tin .005 7440–31–5Titanium .2 7440–32–6Tungsten .003 7440–33–7Uranium .002 --Vanadium .1 7440–62–2Ytterbium .0002 7440–64–4Yttrium .0001 7440–65–5Zinc .4 7440–66–6Zirconium .003 7440–67–7

22 Endocrine Active Chemicals, Pharmaceuticals, and Other Chemicals of Concern in Selected Streams
Table 5. Properties and chemicals analyzed in water or bed-sediment samples. —Continued
[CASRN, Chemical Abstracts Services Registry Number; µS/cm, microsiemens per centimeter at 25 degrees Celsius (°C); mg/L, milligrams per liter; µg/L, micrograms per liter; nm, nanometers; ng/L, nanograms per liter; ng/g, nanograms per gram; g/kg, grams per kilogram; >, greater than; UV, ultraviolet; --, not applicable]
Property/chemical nameLaboratory reporting
levelCASRN1
Pharmaceuticals analyzed in water at the USGS National Water Quality Laboratory (μg/L)
Acetaminophen 0.08 103–90–2Albuterol .06 18559–94–9Caffeine .2 58–08–2Carbamazepine .04 298–46–4Codeine .04 76–57–3Cotinine .026 486–56–6Dehydronifedipine .08 67035–22–7Diltiazem .08 42399–41–71,7-Dimethylxanthine .12 611–59–6Diphenhydramine .04 58–73–1Fluoxetine .016 54910–89–3Sulfamethoxazole .16 723–46–6Thiabendazole .06 148–79–8Trimethoprim .02 738–70–5Warfarin .1 81–81–2Carbamazepine-d10 surrogate standard (percent) -- --Ethyl nicotinate-d4 surrogate standard (percent) -- --
Phytoestrogens, pharmaceuticals, and an antimicrobial analyzed at the University of Colorado Center for Environmental Mass Spectrometry (ng/L)
Biochanin A 5 491–80–5Bupropion 10 34911–55–2Carbamazepine 5 298–46–4Coumestrol 1 479–13–0Daidzein 1 486–66–8Daidzin (sugar) 1 552–66–9Equol 20 531–95–3Fluoxetine 10 54910–89–3Fluvoxamine 10 61718–82–9Formononetin 1 485–72–3Genistein 10 446–72–0Genistin (sugar) 5 529–59–9Glycitein 1 40957–83–3Hydroxy-bupropion 1 --Prunetin 5 552–59–0Sulfamethoxazole 5 723–46–6Triclocarban 20 101–20–2Trimethoprim 5 738–70–5Venlafaxine 5 93413–69–5

Methods 23
Table 5. Properties and chemicals analyzed in water or bed-sediment samples. —Continued
[CASRN, Chemical Abstracts Services Registry Number; µS/cm, microsiemens per centimeter at 25 degrees Celsius (°C); mg/L, milligrams per liter; µg/L, micrograms per liter; nm, nanometers; ng/L, nanograms per liter; ng/g, nanograms per gram; g/kg, grams per kilogram; >, greater than; UV, ultraviolet; --, not applicable]
Property/chemical nameLaboratory reporting
levelCASRN1
Alkylphenols and other neutral organic chemicals analyzed in water at the USGS National Research Program Laboratory (ng/L)
Acetyl hexamethyl tetrahydronaphthalene (AHTN) 5 21145–77–7Bisphenol A 20 80–05–74-tert-Butylphenol 5 98–54–4Caffeine 20 58–08–22,6-Di-tert-butyl-1,4-benzoquinone 300 719–22–21,3-Dichlorobenzene 5 541–73–11,4-Dichlorobenzene 5 106–46–7N,N-diethyl-meta-toluamide (DEET) 10 134–62–3Hexahydrohexamethylcyclopentabenzopyran (HHCB) 5 1222–05–55-Methyl-1H-benzotriazole 20 136–85–64-Nonylphenol (NP) 50 25154–52–34-Nonylphenolmonoethoxylate (NP1EO) 50 27986–36–34-Nonylphenoldiethoxylate (NP2EO) 50 9016–45–94-Nonylphenoltriethoxylate (NP3EO) 50 --4-Nonylphenoltetraethoxylate (NP4EO) 50 --4-tert-Octylphenol 5 140–66–94-tert-Octylphenolmonoethoxylate (OP1EO) 5 9036–19–54-tert-Octylphenoldiethoxylate (OP2EO) 5 --4-tert-Octylphenoltriethoxylate (OP3EO) 5 --4-tert-Octylphenoltetraethoxylate (OP4EO) 5 --4-tert-Octylphenolpentaethoxylate (OP5EO) 5 --4-tert-Pentylphenol 5 --Triclosan 5 3380–34–54-n-Nonylphenol surrogate standard (percent) -- 104–40–54-n-Nonylphenolmonoethoxylate surrogate standard (percent) -- --4-n-Nonylphenoldiethoxylate surrogate standard (percent) -- --Bisphenol A-d6 surrogate standard(percent) -- --Cholesterol-d7 surrogate standard (percent) -- --
Carboxylic acids analyzed in water at the USGS National Research Program Laboratory (μg/L)
Ethylenediaminetetraacetic acid (EDTA) 1 60–00–4Nitrilotriacetic acid (NTA) 1 139–13–94-Nonylphenolmonoethoxycarboxylate (NP1EC) 1 3115–49–94-Nonylphenoldiethoxycarboxylate (NP2EC) 1 106807–78–74-Nonylphenoltriethoxycarboxylate (NP3EC) 1 108149–59–34-Nonylphenoltetraethoxycarboxylate (NP4EC) 1 --4-n-Nonylphenolmonoethoxycarboxylate surrogate standard (percent) -- --
Steroidal hormones and other chemicals analyzed in water at the USGS National Research Program Laboratory (ng/L)
4-Androstene-3,17-dione2 0.8 63–05–8cis-Androsterone2 .8 53–41–8

24 Endocrine Active Chemicals, Pharmaceuticals, and Other Chemicals of Concern in Selected Streams
Table 5. Properties and chemicals analyzed in water or bed-sediment samples. —Continued
[CASRN, Chemical Abstracts Services Registry Number; µS/cm, microsiemens per centimeter at 25 degrees Celsius (°C); mg/L, milligrams per liter; µg/L, micrograms per liter; nm, nanometers; ng/L, nanograms per liter; ng/g, nanograms per gram; g/kg, grams per kilogram; >, greater than; UV, ultraviolet; --, not applicable]
Property/chemical nameLaboratory reporting
levelCASRN1
Steroidal hormones and other chemicals analyzed in water at the USGS National Research Program Laboratory (ng/L) —Continued
Bisphenol A 20 80–05–7Cholesterol 800 57–88–53-beta-Coprostanol 50 360–68–9Diethylstilbestrol .1 56–53–1Equilenin .1 517–09–9Equilin2 2 474–86–217-alpha-Estradiol .1 57–91–017-beta-Estradiol (E2) .2 50–28–2Estriol 0.1 50–27–1
Estrone2 2 53–16–7
17-alpha-Ethynylestradiol (EE2) .1 57–63–6
Mestranol .1 72–33–3
Norethindrone2 2 68–22–4
Progesterone2 2 57–83–0
Testosterone2 2 58–22–0
dihydro-Testosterone2 2 521–18–6
epi-Testosterone2 2 481–30–1
11-keto-Testosterone2 2 564–35–2
4-Androstene-3-17-dione-d7 isotope dilution standard (percent) -- --
Bisphenol A-d16 isotope dilution standard (percent) -- 96210–87–6
Cholesterol-d7 isotope dilution standard (percent) -- 83199–47–7
trans-Diethylstilbestrol-d8 isotope dilution standard (percent) -- 91318–10–4
17-beta-Estradiol-d4 isotope dilution standard (percent) -- --
Estriol-d3 isotope dilution standard (percent) -- --
Estrone-d4 isotope dilution standard (percent) -- --
17-alpha-Ethynylestradiol-2,4,16,16-d4 isotope dilution standard (percent) -- --
Mestranol-2,4,16,16-d4 isotope dilution standard (percent) -- --
Norethindrone-d6 isotope dilution standard (percent) -- --
Progesterone-d9 isotope dilution standard (percent) -- --
Testosterone-d5 isotope dilution standard (percent) -- --
Dihydrotestosterone-d4 isotope dilution standard (percent) -- --
Carbon and wastewater-indicator chemicals analyzed in bed-sediment samples at the USGS National Water Quality Laboratory (ng/g)
Total carbon (g/kg) -- --
Inorganic carbon (g/kg) -- --
Organic carbon (g/kg) -- --
Acetophenone3 150 98–86–2
Acetyl hexamethyl tetrahydronaphthalene (AHTN) 50 21145–77–7
Anthracene 50 120–12–7

Methods 25
Table 5. Properties and chemicals analyzed in water or bed-sediment samples. —Continued
[CASRN, Chemical Abstracts Services Registry Number; µS/cm, microsiemens per centimeter at 25 degrees Celsius (°C); mg/L, milligrams per liter; µg/L, micrograms per liter; nm, nanometers; ng/L, nanograms per liter; ng/g, nanograms per gram; g/kg, grams per kilogram; >, greater than; UV, ultraviolet; --, not applicable]
Property/chemical nameLaboratory reporting
levelCASRN1
Carbon and wastewater-indicator chemicals analyzed in bed-sediment samples at the USGS National Water Quality Laboratory (ng/g)—Continued
9,10-Anthraquinone 50 84–65–1
Atrazine 100 1912–24–9
Benzo[a]pyrene 50 50–32–8
Benzophenone 50 119–61–9
Bisphenol A3 50 80–05–7
Bromacil 500 314–40–9
3-tert-Butyl-4-hydroxyanisole (BHA) 150 25013–16–5
Camphor 50 76–22–2
Carbazole 50 86–74–8
Chlorpyrifos 50 2921–88–2
Cholesterol 250 57–88–5
3-beta-Coprostanol 500 360–68–9
p-Cresol (4-Methylphenol)3 250 106–44–5
4-Cumylphenol 50 599–64–4
Diazinon 50 333–41–5
1,4-Dichlorobenzene 50 106–46–7
Diethylhexyl phthalate5 250 117–81–7
Diethylphthalate5 100 84–66–2
2,6-Dimethylnaphthalene 50 581–42–0
Fluoranthene3 50 206–44–0
Hexahydrohexamethylcyclopentabenzopyran (HHCB) (galaxolide)3 50 1222–05–5
Indole3 100 120–72–9
Isoborneol 50 124–76–5
Isophorone3 50 78–59–1
Isopropylbenzene (cumene)3 100 98–82–8
Isoquinoline3 100 119–65–3
d-Limonene3 50 5989–27–5
Menthol 50 89–78–1
3-Methyl-1H-indole (skatol) 50 83–34–1
1-Methylnaphthalene 50 90–12–0
2-Methylnaphthalene 50 91–57–6
Metolachlor3 50 51218–45–2
Naphthalene 50 91–20–3
N,N-diethyl-meta-toluamide (DEET)3 100 134–62–3
4-Nonylphenol (NP) (all isomers)4 750 84852–15–3
4-Nonylphenoldiethoxylate (NP2EO)4 1000 --
4-Nonylphenolmonoethoxylate (NP1EO)4 500 --

26 Endocrine Active Chemicals, Pharmaceuticals, and Other Chemicals of Concern in Selected Streams
Table 5. Properties and chemicals analyzed in water or bed-sediment samples. —Continued
[CASRN, Chemical Abstracts Services Registry Number; µS/cm, microsiemens per centimeter at 25 degrees Celsius (°C); mg/L, milligrams per liter; µg/L, micrograms per liter; nm, nanometers; ng/L, nanograms per liter; ng/g, nanograms per gram; g/kg, grams per kilogram; >, greater than; UV, ultraviolet; --, not applicable]
Property/chemical nameLaboratory reporting
levelCASRN1
Carbon and wastewater-indicator chemicals analyzed in bed-sediment samples at the USGS National Water Quality Laboratory (ng/g)—Continued
4-n-Octylphenol 50 1806–26–4
4-tert-Octylphenol (TOP) 50 140–66–9
4-tert-Octylphenoldiethoxylate (OP1EO)4 50 --
4-tert-Octylphenolmonoethoxylate (OP2EO)4 250 --
Phenanthrene 50 85–01–8
Phenol3 50 108–95–2
Prometon 50 1610–18–0
Pyrene 50 129–00–0
beta-Sitosterol 500 83–46–5
beta-Stigmastanol 500 19466–47–8
2,2’,4,4’-Tetrabromodiphenylether (PBDE 47) 50 5436–43–1
Tributyl phosphate 50 126–73–8
Triclosan 50 3380–34–5
Triphenyl phosphate3 50 115–86–6
Tris(2-butoxyethyl) phosphate 150 78–51–3
Tris(2-chloroethyl) phosphate3 100 115–96–8
Tris(dichloroisopropyl) phosphate3 100 13674–87–8
Bisphenol A-d3 surrogate standard (percent) -- --
Decafluorobiphenyl surrogate standard (percent) -- --
Fluoranthene-d10 surrogate standard (percent) -- --
Steroidal hormones and other chemicals analyzed in bed sediment at the USGS National Water Quality Laboratory (ng/g)
4-Androstene-3,17-dione2 0.1 63–05–8
cis-Androsterone2 .1 53–41–8
Bisphenol A 12 80–05–7
Cholesterol 250 57–88–5
3-beta-Coprostanol 250 360–68–9
trans-Diethylstilbestrol .1 56–53–1
Dihydrotestosterone2 .1 521–18–6
Equilenin .26 517–09–9
Equilin2 .5 474–86–2
17-alpha-Estradiol .1 57–91–0
17-beta-Estradiol (E2) .1 50–28–2
Estriol .26 50–27–1
Estrone2 .1 53–16–7
17-alpha-Ethynylestradiol (EE2) .1 57–63–6
Mestranol .1 72–33–3
Norethindrone2 .1 68–22–4

Methods 27
Environmental Mass Spectrometry (Boulder, Colo.) (table 5) using high-performance liquid chromatography/tandem mass spectrometry. Each water sample was spiked with 100 micro-liters (µL) of a solution containing a mix of the internal standards. Analytical standards were purchased from Sigma-Aldrich (St. Louis, Mo.), Cole Parmer (Vernon Hills, Ill.), and Cerilliant (Round Rock, Texas). Labeled internal standards (carbamazepine-d10, daidzein-d4, fluoxetine-d6, genistein-d4, sulfamethoxazole-13C6 , triclocarban-13C6, and trimethoprim-13C3) were obtained from Cambridge Isotope Laboratories (Andover, Mass.). Individual pharmaceutical stock solutions
(approximately 1,000 micrograms per millilter) were prepared in pure acetonitrile or methanol depending on the solubility of each individual compound, and stored at -18ºC, and working standard solutions were prepared by dilution with acetonitrile and water. High-performance liquid-chromatography (HPLC) grade acetonitrile, methanol, and water were obtained from Burdick and Jackson (Muskegon, Mich.). Acetic acid was obtained from Sigma-Aldrich (St. Louis, Mo.).
Water samples for analyses of phytoestrogens, addi-tional pharmaceuticals, and an antimicrobial were extracted in the laboratory using SPE and eluted with methanol for
Table 5. Properties and chemicals analyzed in water or bed-sediment samples. —Continued
[CASRN, Chemical Abstracts Services Registry Number; µS/cm, microsiemens per centimeter at 25 degrees Celsius (°C); mg/L, milligrams per liter; µg/L, micrograms per liter; nm, nanometers; ng/L, nanograms per liter; ng/g, nanograms per gram; g/kg, grams per kilogram; >, greater than; UV, ultraviolet; --, not applicable]
Property/chemical nameLaboratory reporting
levelCASRN1
Steroidal hormones and other chemicals analyzed in bed sediment at the USGS National Water Quality Laboratory (ng/g)—Continued
Progesterone2 0.5 57–83–0
Testosterone2 .1 58–22–0
epi-Testosterone2 .5 366495–94–5
11-keto-Testosterone2 .26 564–35–2
4-Androstene-3,17-dione-2,2,4,6,6,16,16-d7 isotope dilution standard (percent) -- --
Bisphenol-A-d16 isotope dilution standard (percent) -- 96210–87–6
Cholesterol-d7 isotope dilution standard (percent) -- 83199–47–7
trans-Diethyl-1,1,1’,1’-d4-stilbesterol-3,3’,5,5’-d4 isotope dilution standard (percent) -- 91318–10–4
16-Epiestriol-2,4-d2 (percent) -- --
Dihydrotestosterone-1,2,4,5a-d4 isotope dilution standard (percent) -- --
Estriol-2,4,17-d3 isotope dilution standard (percent) -- --
Estrone-2,4,16,16-d4 isotope dilution standard (percent) -- --
Estrone-13,14,15,16,17,18-13C6 isotope dilution standard (percent) -- --
17-beta-Estradiol-d4 isotope dilution standard (percent) -- --
17-beta-Estradiol-13,14,15,16,17,18-13C6 isotope dilution standard (percent) -- --
17-alpha-Ethynylestradiol-2,4,16,16-d4 isotope dilution standard (percent) -- 350820–06–3
Medroxy-progesterone-d3 isotope dilution standard (percent) -- --
Mestranol-2,4,16,16-d4 isotope dilution standard (percent) -- --
Nandrolone-16,16,17-d3 surrogate (percent) -- --
Norethindrone-2,2,4,6,6,10-d6 isotope dilution standard (percent) -- --
Progesterone-2,2,4,6,6,17a,21,21,21-d9 isotope dilution standard (percent) -- --
Testosterone-2,2,4,6,6-d5 isotope dilution standard (percent) -- --1This report contains Chemical Abstract Service (CAS) Registry Numbers® (CASRNs), which is a Registered Trademark of the
American Chemical Society. CAS recommends the verification of the CASRNs through CAS Client ServicesSM.2Chemical that may have been affected by isotope dilution standard deuterium loss.3Concentration is estimated because recovery is less than 60 percent or precision is greater than 25 percent relative standard deviation. This can be caused by
instrumental or extraction difficulties.4Concentration is estimated because the reference standard is from a technical mixture.5Concentration is estimated because of potential blank contamination unless concentration is greater than 10 times the 95th percentile of all blank concentra-
tions.

28 Endocrine Active Chemicals, Pharmaceuticals, and Other Chemicals of Concern in Selected Streams
pre-concentration. The SPE was performed using an auto-mated extraction column system (GX-271 ASPEC, Gilson, Middleton, Wisc.) fitted with a 25-mL syringe pump for dispensing the water samples through the SPE cartridges. Water samples were extracted with Oasis HLB cartridges (200 milligrams, 6 mL) obtained from Waters (Milford, Mass.). The cartridges were conditioned with 4 mL of methanol fol-lowed by 6 mL of HPLC-grade water at a flow rate of 1 mL per minute. The solvent was evaporated to 0.5 mL by using a stream of nitrogen at a temperature of 45ºC in a water bath with a Turbovap concentration workstation (Caliper Life Sci-ences, Mountain View, Calif.). The samples were transferred to vials and analyzed by liquid chromatography/tandem mass spectrometry. Separation of the analytes was carried out with a reversed-phase carbon-18 analytical column (Agilent Series 1290, Agilent Technologies, Santa Clara, Calif.) and aceto-nitrile and water with 0.1-percent acetic acid mobile phases. Column temperature was maintained at 25ºC. The injected sample volume was 20 microliters (mL). The HPLC was connected to a triple quadrupole mass spectrometer (Model 6460; Agilent Technologies, Santa Clara, Calif.) equipped with electrospray interface with Jet Stream technology operating in positive and negative ion mode. Samples were analyzed in positive and negative ion modes.
The USGS-NRPL analyzed 23 alkylphenols (4-nonyl-phenol, 4-nonylphenolmonoethoxylate (NP1EO) to 4-nonyl-phenoltetraethoxylate (NP4EO), 4-tert-butylphenol, 4-tert-octylphenol, and 4-tert-octylphenolmonoethoxylate to 4-tert-octylphenolpentaethoxylate), and other neutral organic contaminants, and five surrogate standards in unfiltered water samples (table 5). The following surrogate standards were added to the water samples before extraction by this method: cholesterol-d7, bisphenol A-d6, 4-n-nonylphenol, 4-n-nonyl-phenolmonoethoxylate, and 4-n-nonylphenoldiethoxylate. Acidification with hydrochloric acid was used to preserve samples for continuous liquid-liquid extraction (CLLE) analy-ses (Barber and others, 2000), and the samples were stored at 4˚C. Chemicals were isolated using CLLE with methylene chloride at a pH of 2 following ionic strength adjustments with sodium chloride. The extract was then concentrated by evaporation under a stream of nitrogen gas for analysis by gas chromatography/mass spectrometry (GC/MS).
The USGS-NRPL analyzed unfiltered water samples (preserved in the field using 1-percent formalin volume per volume) for six carboxylic acids, including ethylenedi-aminetetraacetic acid (EDTA), nitrilotriacetic acid (NTA), and 4-nonylphenolmonoethoxycarboxylate (NP1EC) to 4-nonylphenolmonotetraethoxycarboxylate (NP4EC), and one surrogate standard (table 5). Internal standard (ethylene-diaminetetraacetic acid-d12) and surrogate (4-n-nonylphe-noldiethoxycarboxylate) were added to the samples prior to analysis. The acidic chemicals were isolated by evaporation and derivatized with acetyl chloride:propanol to form the propyl esters (Schaffner and Giger, 1984; Barber and others, 2000). The derivatized extracts were analyzed by GC/MS.
The CLLE and evaporation extracts were analyzed by electron impact GC/MS in the full-scan and selected ion moni-toring (SIM) modes. The following were the general chro-matographic conditions: Hewlett Packard (HP) 6890 GC gas chromatograph; column - HP Ultra II (5-percent phenylmethyl silicone), 25 meters (m) by 0.2 mm, 33-µm film thickness; car-rier gas, ultra-high purity helium with a linear-flow velocity of 27 centimeters per second; injection port temperature, 300oC; initial oven temperature, 50oC; split vent open, 0.75 minute; ramp rate, 6oC per minute to 300oC; and hold time, 15 min-utes at 300oC. The following were the mass spectrometer conditions: HP 5973 Mass Selective Detector; tuned with perflurotributylamine; ionization energy, 70 electron volts; source temperature, 250oC; and interface temperature, 280oC. Concentrations were calculated on the basis of SIM data using three diagnostic ions for each compound, which were identi-fied on the basis of matching of retention times (plus or minus (±) 0.05 minutes) and ion ratios (± 20 percent) determined from analysis of authentic standards. External calibration curves and internal standard procedures were used for calcu-lating concentrations.
The USGS-NRPL analyzed for 17 steroidal hormones and 3 other chemicals using 13 isotope dilution standards (IDSs) in unfiltered water samples (table 5). The following IDSs were added to samples prior to analysis: 4-androstene-3-17-dione-d7, bisphenol A-d16, cholesterol-d7, trans-dieth-ylstilbestrol-d8, 17-beta-estradiol-d4, estriol-d3, estrone-d4, 17-alpha-ethynylestradiol-d4, mestranol-2,4,16,16-d4, noreth-indrone-d6, progesterone-d9, testosterone-d5, and dihydrotes-tosterone-d4. Standards were obtained from Dr. Ehrenstorfer, GmbH (Augsburg, Germany), Cambridge Isotope Laborato-ries (Cambridge, Mass.), Sigma-Aldrich (Milwaukee, Wisc.), Supelco (Bellefonte, Pa.), and CDN Isotopes (Pointe-Claire, Canada). Samples were stored at 4°C, to reduce biodegra-dation before extraction by SPE within 14 days of spiking with the 13 IDSs. Steroidal hormones were isolated from the sample water using octadecylsilica SPE followed by elution with methanol (Barber and others, 2000; Barber, Furlong, and others, 2003; Furlong and others, 2010). The methanol extracts were cleaned up using Florisil, and the steroids were derivatized with N-methyl-N-(trimethylsilyl)-trifluoroacet-amide (MSTFA) activated with 2-(trimethylsilyl)ethanethiol and ammonium iodide (MSTFA II, Sigma Aldrich, Milwau-kee, Wisc.) before analysis with gas chromatography/tandem mass spectrometry (GC/MS/MS) (Barber, Furlong, and others, 2003; Furlong and others, 2010).
The SPE extracts were analyzed by GC/MS/MS using a Quattro-micro-GC® instrument (Waters Corp., Milford, Mass.) with an Agilent 6890 GC gas chromatograph. Chromatogra-phy was on a 30-m by 0.25-mm internal diameter Rxi XLB gas chromatography column with a 0.25-µm film thickness (Restek Corp., Bellefonte, Pa.) and a helium flow rate of 1 milliliter per minute (mL/min) with the injection port main-tained at 275°C. The gas chromatograph was programmed on a variable temperature gradient from 100°C to 310°C. For each target compound, the most abundant diagnostic ion in the

Methods 29
full-scan spectrum was selected as a precursor and appropri-ate conditions were selected to maximize the signal for three precursor-product transitions. All 20 chemicals were quanti-fied relative to a specific IDS using an isotope-dilution quan-tification procedure that automatically corrects for procedural losses in the reported chemical concentration based on the absolute method recovery of the IDS.
The basic premise of isotope dilution quantification is that deuterium labeled surrogate standards behave in a similar manner as the unlabeled chemical during sample preparation and instrumental analysis. As a result, quantitation by isotope dilution compensates for losses that occur during sample storage (sorption and biotransformation), sample transfer, and sample processing (isolation, extraction, clean-up, and derivatization). Multiple assumptions go into this quantitation method, the discussion of which is beyond the scope of this report. One of the basic assumptions is that the isotopically labeled analog is stable during the analytical procedure, and this assumption was not met for certain standards during this study (as described further in the “Bed-Sediment Chemical Analyses” section).
Bed-Sediment Chemical AnalysesBed-sediment samples were analyzed for 3 carbon types
(total, inorganic, and organic) (Wershaw and others, 1987), a suite of 57 organic wastewater-indicator chemicals, and 3 surrogate standards at USGS-NWQL (table 5) using method schedule 5433 according to Burkhardt and others (2006). Briefly, the method used accelerated solvent extraction (ASE), subsequent analyte isolation and extract cleanup by SPE, and analysis by GC/MS operated in electron-impact mode with full-scan ion monitoring. The method identified individual chemicals using chromatographic retention times and mass spectral matches, and quantified the analytes using multi-point standard calibration curves. Chemicals analyzed included alkylphenol ethoxylate nonionic surfactants and several degra-dates, food additives, fragrances, antioxidants, flame retar-dants, plasticizers, industrial solvents, disinfectants, fecal and plant sterols, polycyclic aromatic hydrocarbons, and high-use domestic pesticides, and three surrogate standards (bisphenol A-d3, decafluorobiphenyl, and fluoranthene-d10). The concen-trations of 20 chemicals are reported as estimated with the “E” remark code for one of three reasons: (1) unacceptably low-biased recovery (less than 60 percent) or highly variable method performance (greater than 25-percent relative standard deviation), (2) reference standards prepared from technical mixtures, or (3) potential blank contamination.
Custom analytical method 6434, which is under develop-ment at the USGS-NWQL, was used to analyze for 17 ste-roidal hormones and 3 other compounds in bed-sediment samples (table 5). Following receipt at the NWQL, samples were stored in a freezer at 5°C or less until the day preceding extraction when allowed to thaw at room temperature. Each sample was homogenized prior to sub-sampling for extrac-tion or for separate dry-weight determination. Dry weight
was obtained by weighing a sample aliquot, contained in a tarred aluminum pan, before and after heating at 130ºC for at least 16 hours. Amounts used for extraction of samples in this study ranged from 1.7 to 11.7 g of material (dry weight), with lesser amounts used for matrices anticipated to have high organic matter or method chemical concentrations. A sub-sample aliquot was placed in a tarred ASE cell (Dionex Corp., Sunnyvale, Calif.) and reweighed to determine the aliquot’s wet weight prior to extraction. Reagent sand (precleaned by heating at 450°C for a minimum of 4 hours) was added to the cell, as needed, based on cell and sample size. The aliquot was fortified with 10–10,000 nanograms (ng; compound depen-dent) of the isotopically labeled compounds shown in table 6 that were used as IDSs. The sample aliquot was extracted by pressurized solvent extraction using the ASE instrument with a mixture of water:isopropanol (50:50 volume per volume [v/v]) at 120ºC and water:isopropanol (20:80 v/v) at 200ºC using three static cycles (40 minutes total) at each temperature at a pressure of 10.3 megaPascals (1,500 pounds per square inch). The resultant ASE extract portions were diluted using 100 mL of a pH 7 potassium phosphate buffer solution and sequentially passed through an OASIS® HLB (Waters Corp., Milford, Mass.) SPE column to isolate the method compounds on the column using the procedure given in Burkhardt and others (2006). The SPE column was dried with nitrogen gas at a flow of 2 liters per minute of nitrogen for 15 minutes. Method compounds were eluted from the OASIS® column and passed through a cleanup column containing 2 g of Florisil overlain with 2.5 g of sodium sulfate by using 25 mL of a dichloromethane-methanol (95:5 v/v) mixture. The resultant extract was concentrated to 1–2 mL by using nitrogen gas evaporation, and transferred to a silanized 5-mL reaction vial by using a 1.5-mL rinse with the dichloromethane-methanol (95:5 v/v) mixture. The extract was evaporated to dryness using nitrogen gas. The method chemicals were derivatized to trimethylsilyl or trimethylsilyl-enol ether analogs to increase compound volatility or to minimize compound interactions with active sites in the gas chromatography system. Deriva-tion was accomplished by addition of 500 µL of MSTFA II, and heating of the MSTFA II solution to 65°C for 1 hour. The MSTFA solution also contains cholestane-d6 and chrysene-d12 as injection internal standards. The extract was transferred to a gas-chromatography vial and the method compounds were determined by GC/MS/MS using a Quattro-micro-GC® instrument (Waters Corp., Milford, Mass.). Compounds were separated by using a 30-m by 0.25-mm internal diameter Rxi XLB gas chromatography column with 0.25-µm film thickness (Restek Corp., Bellefonte, Pa.) and a multiple ramp tem-perature program. Chemicals were detected by tandem mass spectrometry by monitoring the product ions of three specific precursor-to-product ion transitions. Positive identification required the presence of at least two unique transition product ions, with ion ratios not deviating from those in a standard by more than specified tolerances (Antignac and others, 2003).
Similar to the water samples analyzed for hormones, all 20 method chemicals were quantified relative to a specific

30 Endocrine Active Chemicals, Pharmaceuticals, and Other Chemicals of Concern in Selected Streams
IDS compound by using an isotope-dilution quantification procedure that automatically corrects for procedural losses in the reported chemical concentration based on the absolute method recovery of the IDS. During this study, two sets of IDS compounds were used for the bed-sediment analyses. For 11 samples prepared in 2009, 13 deuterium-labeled IDS compounds were used for the bed-sediment analyses that were exact isotopic analogs of method chemicals (table 6). The remaining seven method chemicals in these samples were quantified relative to one of the IDS compounds that has simi-lar chemical functionality but is not a direct isotopic analog of the chemical (table 6).
Six of the original 13 IDS compounds—4-androstene-3,17-dione-d7, dihydrotestosterone-d4, estrone-d4, norethin-drone-d7, testosterone-d5, and progesterone-d9—were found to be susceptible to deuterium-hydrogen exchange (deuterium loss, D-loss) under non-routine sample preparation condi-tions (water bath temperatures above ambient temperature of 25°C) or prolonged IDS standard storage periods (months)
in methanol (Foreman and others, 2010). D-loss results in an underestimate of the IDS total mass in the sample extract and, thus, an underestimate of IDS absolute recovery, which produces a positive bias in the determined chemical concen-tration. Consequently, these six deuterium-labeled IDSs were removed from the method, and not used for the 14 samples prepared in 2010. Reported concentrations of chemicals nor-mally determined using these six IDSs were censored to the laboratory reporting level or a raised reporting level, if needed, or were quantified relative to 17-alpha-ethynylestradiol-d4 to eliminate risk of positive bias in chemical concentration for any of the 11 samples prepared in 2009 where D-loss was evident from follow-up GC/MS analysis or suspected based on comparison of recoveries of these six IDSs to three other IDSs in the sample that are not susceptible to D-loss.
The 14 samples prepared in 2010 were fortified with 10 deuterium- or carbon-13 (13C)-labeled compounds (table 6), five of which were unchanged from those used for the 11 sam-ples prepared in 2009. Nine of these compounds were used as
Table 6. Chemical and the corresponding isotope dilution standard (IDS) used for its quantification in bed sediment by U.S. Geological Survey National Water Quality Laboratory for custom analytical method 6434.
[The six chemicals with direct IDS analogs that were susceptible to deuterium loss (D-loss) are shown in bold italics. The four chemicals quantified with non-direct IDS analogs susceptible to D-loss are shown in bold. Six IDSs that contain ketone functional groups (keto-IDSs) that can undergo D-loss are shown in bold]
ChemicalIsotope dilution standard used for
11 samples prepared in 2009Isotope dilution standard used for
14 samples prepared in 20101
4-androstene-3,17-dione 4-androstene-3,17-dione-d7 estrone-13C6
cis-androsterone dihydrotestosterone-d4 estrone-13C6
bisphenol A bisphenol A-d16 no change3-beta-coprostanol cholesterol-d7 no changecholesterol cholesterol-d7 no changetrans-diethylstilbestrol trans-diethylstilbestrol-d8 no changedihydrotestosterone dihydrotestosterone-d4 estrone-13C6
epitestosterone testosterone-d5 estrone-13C6
equilenin 17-beta-estradiol-d4 17-beta-estradiol-13C6
equilin estrone-d4 estrone-13C6
17-alpha-estradiol 17-beta-estradiol-d4 17-beta-estradiol-13C6
17-beta-estradiol 17-beta-estradiol-d4 17-beta-estradiol-13C6
estriol estriol-d3 16-epiestriol-d2
estrone estrone-d4 estrone-13C6
17-alpha-ethynylestradiol 17-alpha-ethynylestradiol-d4 no change11-ketotestosterone testosterone-d5 estrone-13C6
mestranol mestranol-d4 no changenorethindrone norethindrone-d6 estrone-13C6
progesterone progesterone-d9 medroxyprogesterone-d3
testosterone testosterone-d5 estrone-13C61Nandrolone-16,16,17-d3 also was added to samples determined by custom analytical method 6434, but was used as a surrogate only and not as an isotope
dilution standard in analytical method 6434.

Methods 31
IDSs. Nandrolone-d3 was used as a surrogate only for samples analyzed by custom analytical method 6434. Replacement IDSs contained either carbon-13 or were non-direct analogs of the chemicals that have deuterium labels in positions not adja-cent to a ketone group and, thus, are not susceptible to D-loss. In addition, 17-beta-estradiol-13C6 replaced 17-beta-estradiol-d4, and 16-epiestriol-d2 replaced estriol-d3 to further minimize risk of IDS interference with the chemical’s parent ion at concentrations near the GC/MS/MS instrumental detection level. Six of the IDS compounds are exact isotopic analogs of method analytes. The remaining 14 method chemicals also were quantified by isotope dilution by using one of the IDSs that have similar related chemical functionality but are not direct isotopic analogs of the chemical (table 6).
Quality assurance was monitored in part by evaluation of IDS recoveries in each sample matrix, which represent abso-lute recoveries for the method. Quality-assurance sample types included at least one laboratory reagent blank sample and one laboratory reagent spike sample for each sample preparation set and were processed at the same time as the associated envi-ronmental samples. The laboratory reagent blank and labora-tory reagent spike samples were prepared using baked (450ºC) reagent sand. The laboratory reagent blank was used to moni-tor for interferences and the possible introduction of method chemicals during sample preparation or analysis. The labora-tory reagent spike was used to assess recovery performance for method chemicals. The IDS compounds are reported (in percent recovery) along with the chemicals’ concentrations in the environmental samples or the analytes’ recoveries in laboratory reagent-spike sample. However, these IDS mea-surements reflect absolute recoveries achieved during sample preparation, and are only corrected for injection variability by quantitation compared to chrysene-d12 or cholestane-d6. Reported chemical concentrations (or recoveries in quality-control spike samples) are automatically recovery-corrected by using this isotope dilution quantification procedure.
Bioassay for Total Estrogenicity Environmental water samples of surface water and
wastewater effluent were collected for analyses of total estrogenicity, stored at -40ºC, and thawed on the same day that cell-based analyses of estrogenic activity were conducted. To prepare sample extracts for the cell-based estrogenicity analyses, 150 mL of water sample was filtered through a 2-µm glass-fiber filter and then concentrated at flow rate of approxi-mately 5 mL/min, using a 6-mL high-capacity carbon-18 SPE column (Baker Bond, Phillipsburg, N.J.) that had been activated with 100-percent methanol and deionized water. The extract was eluted with 2 mL of 100-percent methanol. Positive controls were prepared by adding 12 or 50 nanograms (ng) of 17-beta-estradiol (E2) to 1 liter (L) of distilled water or matrix (Lake Superior water) frozen at -40ºC, and processed following the procedures for environmental sample prepara-tion. The distilled water sample and Lake Superior water
sample also were prepared in the same manner as environmen-tal samples, and acted as negative controls.
Total estrogenic activity of the environmental samples was measured using an estrogen receptor transcriptional assay. The T47D estrogen-dependent human breast-cancer line stably transfected with an estrogen-responsive luciferase reporter, named T47D-KBluc, was developed by Wilson and others (2004). This assay quantifies hormonal activity of environ-mental samples based on their ability to bind to the steroid receptor and to induce or attenuate subsequent responses. Although this is a mammalian-based assay, recent work (Wil-son and others, 2007) that compared properties of mammalian and fish estrogen receptor assays, indicated that the results obtained are comparable and that mammalian and fish receptor assays respond to the same chemicals.
T47D-KBluc cells were maintained in RPMI 1640 Media (GIBCO) supplemented with 1-percent Anti-Anti (antibiotic-antimycotic, GIBCO) and 10-percent fetal bovine serum (FBS; HyClone, Logan, Utah). Before conducting bioassays, the cells were cultured in RPMI 1640 media supplemented with 10-percent charcoal dextran filtered FBS (HyClone) and in the absence of antibiotics and antimycotics for 7 days, reaching approximately 90-percent confluence. The cells were removed from culture flasks by a 15-minute incubation in TrypLE™ Express (GIBCO) and transferred to assay media (RPMI supplemented with 5-percent charcoal dextran filtered FBS). The cells were then counted using a hemocytometer, diluted to 100,000 cells per milliliter in assay media, and seeded into 96 clear-bottomed well plates at 100 µL per well. Cells were allowed to attach for 1 hour at room temperature before being transferred to a 37°C, 5-percent carbon dioxide incubator for approximately 24 hours.
A standard curve using 17-beta-estradiol (E2), negative control (distilled water), and positive control (distilled water with E2 spike) were run with each plate and each assay. The E2 standard stock solutions were prepared in 100-percent methanol. The E2 standard curve with in-well concentrations ranging from 10-6 to 5 nanomolar was applied to the cells. The methanol eluates of the environmental samples were diluted in the assay media, and these diluted samples were used to dose the cells. All controls, standards, and samples were prepared so that the methanol concentrations in each plate well remained constant (0.25-percent solvent). All samples were analyzed in duplicate. All cell plating, dosing, and media preparation were conducted under a laminar flow hood to mitigate bacterial and fungal contamination.
After exposure to standard, sample, or control solu-tions, cells were incubated for 24 hours at 37°C and 5-percent carbon dioxide. Following the incubation period, the expo-sure medium was removed, and the cells were subjected to a cytotoxicity assay (Invitrogen Live/Dead® Viability/Cytotoxic-ity Kit, Eugene, Oreg.) using the protocol developed by the manufacturer. After the Live/Dead® reagent was removed, the cells were washed with 25 µL per well of Dulbecco’s phos-phate buffered saline (GIBCO, Grand Island, N.Y.) and lysed through a 45-minute room temperature incubation period in

32 Endocrine Active Chemicals, Pharmaceuticals, and Other Chemicals of Concern in Selected Streams
25 µL per well of Luciferase Cell Culture Lysis Reagent (Pro-mega, Madison, Wisc.). Luminescence, in relative light units, was determined with a luminometer (Biotek, Synergy 2, Win-ooski, Vt.; Gen5 Software) after the addition of 25 µL per well of reaction buffer (25 millimolar glycyglycine), 15 millimolar magnesium chloride, 5 millimolar adenosine triphosphate, 0.1 milligram per milliliter bovine serum albumin, pH 7.8) followed by 25 µL per well of luciferin (Promega, Madison, Wisc.).
Data from the in-vitro T47D-KBluc assays were used to estimate the total estrogenic equivalents in the effluent samples, relative to E2. The concentrations of the E2 stan-dards used in the cell assays were adjusted for dilutions in the assay media and transformed using the base-10 logarithm. The estrogenic activity of the test samples was interpolated by the least-squares means procedure from a nonlinear sigmoidal dose response curve fit to the relative luminescence units of the E2 standards (using Prism 5.02., Graph Pad Software Inc., La Jolla, Calif.). The interpolated sample values were adjusted back to concentrations in nanograms per liter and adjusted for sample dilutions in assay media.
Caged Fish ProcessingAt the end of the 14-day deployment, fish were retrieved
and returned to the laboratory in aerated coolers. Fish were sacrificed and sampled for blood and reproductive tissues within 15 hours of retrieval from the field sites. Animal use and care in all experiments was approved by the SCSU Animal Use and Care Committee. All fish (pre-deployment and caged fish) were assessed for morphological endpoints (total and standard length, weight, body condition factor) and plasma vitellogenin concentrations. Fish were deeply anesthetized in 0.1-percent MS-222 (Argent Laboratories, Redmond, Wash.) before all procedures. Fish were lightly blotted dry and then weighed to determine whole body weight (0.01-g precision, Acculab Vicon, Edgewood, N.Y.). Total and standard length was measured for each fish to the closest millimeter. Body weight in grams and total length in millimeters were used to calculate the body condition factor (BCF), which is a measure of the overall nutritional state of the animal:
BCF = [body weight/total length3] x100,000 (6)
Plasma vitellogenin levels were measured by using a competitive antibody-capture enzyme-linked immunosorbent assay. The polyclonal anti-fathead minnow vitellogenin anti-serum (1° antibody (Ab)) was provided by Gerald LeBlanc, North Carolina State University. The antiserum used in this study was produced in female New Zealand white rabbits by injecting plasma from estradiol-exposed fathead minnows. Specificity to vitellogenin was obtained by incubating anti-serum with plasma from unexposed male fathead minnows, followed by centrifugation to remove antibodies that recog-nized other plasma proteins (Parks and others, 1999). Standard
vitellogenin was purified by anion-exchange chromatography from estradiol-exposed fathead minnows. The standard curve was prepared as a seven-step two-fold serial dilution with a range of 0.075 to 4.8 microliters per milliliter. Microtiter wells were coated with the purified fathead minnow vitello-genin (200 µL of a 600-nanograms-per-milliliter solution) in a coating buffer of 0.35 molar sodium bicarbonate, 0.15 molar sodium carbonate, pH 9.6). Plasma samples/standards were pre-incubated in microcentrifuge tubes at a ratio of 1:1 sample dilution to 1° Ab (1:20,000 final dilution) at 25°C for 2 hours. Just before the completion of the pre-incubation, microtiter plates were washed three times with wash buffer in an auto-mated plate washer, then 200 µL of each pre-incubation mix (1° Ab plus sample or standard) was loaded into the microti-ter wells of the assay plate and incubated 1 hour at room temperature. Plates were washed and incubated for 1 hour at room temperature with 200 µL of horseradish peroxidase labeled anti-rabbit IgG 2° Ab (Sigma, St. Louis, Mo.). Plates were again washed and incubated with 200 µL of 3,3′,5,5′-tet-ramethylbenzidine substrate (Sigma, St. Louis, Mo.) for 15 minutes in the dark. Absorbance was read at 620 nanome-ters on a Multiskan EX (Thermo Electron). Standard curves were constructed and sample values were calculated using the accompanying Multiskan Ascent software. The standard curves produced were robust, with coefficient of determination (r2) values routinely greater than 0.99. The lowest standard was periodically removed from the curve to maintain linear-ity. The samples were diluted 1:75, 1:825 and 1:7,700 in 0.075 molar phosphate-buffered saline assay buffer, giving an assay quantitation range of 8 to 5,000 micrograms per milliliter.
Data for Endocrine Active Chemicals, Pharmaceuticals, Other Chemicals of Concern, and Biological Characteristics
This section of the report presents the environmental and quality-assurance data collected for the chemical and biological study of EACs, pharmaceuticals, other organic and inorganic chemicals of concern, and biological charac-teristics. Data are presented for water samples (surface water and wastewater effluent), bed-sediment samples, an in-vitro bioassay for estrogenicity, and fish plasma vitellogenin concentrations.
Quality-assurance samples are collected for all USGS methods as part of ongoing research and evaluation of poten-tial interferences and contamination sources, and were used to set or adjust laboratory reporting levels. Laboratory and field quality-assurance samples were collected as part of the study to assess potential sources of contamination and variabil-ity. Laboratory quality-assurance samples included distilled water blanks, distilled water spikes, and surrogate compounds

Data for Endocrine Active Chemicals, Pharmaceuticals, Other Chemicals of Concern, and Biological Characteristics 33
added to samples to monitor sample-specific performance during sample preparation and analysis. For the USGS-NRPL and USGS-NWQL hormone analytical methods, IDS com-pounds similarly were added to monitor performance and also to quantify the method chemicals. Field quality-assurance samples included blank, duplicate, and matrix-spike samples. The type and number of quality-assurance samples varied by laboratory and analytical method. Quality-assurance samples were used to review the environmental data and to censor the data if needed as described in the following sections of the report.
Water Data
Basic water-quality properties (dissolved oxygen, pH, specific conductance, temperature, and turbidity) are presented in appendix 1 for the surface-water and wastewater-effluent samples. Hydrologic properties measured or determined from the tracer studies are presented in table 7. Analytical results and quality-assurance data for water samples are presented in the following sections for major ions and nutrients, trace ele-ments, pharmaceuticals, phytoestrogens and pharmaceuticals, alkylphenols and other neutral organic chemicals, carboxylic acids, and steroid hormones.
Major Ions and NutrientsDuring this study, 73 environmental samples of surface
water and wastewater effluent, 6 field-blank samples, and 2 field-duplicate sample pairs were analyzed for 2 major ions and 8 nutrients at the USGS-NWQL. Analytical results of major ions and nutrients are presented in appendix 2 for the environmental and quality-assurance samples.
Sulfate and chloride were not detected in any of the six field-blank samples analyzed for major ions. Among the six field-blank samples that were analyzed for nutrients, dis-solved ammonia plus organic nitrogen was the only nutrient detected. Dissolved (filtered) ammonia plus organic nitrogen was detected in 50 percent of the blank samples at low esti-mated concentrations ranging from 0.05 to 0.07 milligram per liter (mg/L; table 8). Concentrations of filtered ammonia plus organic nitrogen in field-blank samples were much less than concentrations measured in environmental samples (0.18 to 13.0 mg/L).
Differences in duplicate sample pairs were assessed by calculating the average relative percent difference (RPD). The RPD was calculated as follows:
RPDENV FDUP
ENV FDUP=
−
+
2
x 100
(7)
where ENV is the concentration in an environmental
sample, and FDUP is the concentration in the corresponding field
duplicate sample. The average RPD values for the two duplicate sample
pairs analyzed for chloride and sulfate were 0.3 and 0.1 percent, respectively (table 8). The average RPD for all the nutrients analyzed in the two duplicate sample pairs was low at 3.1 ± 3.9 percent indicating good agreement between the two duplicate pairs that were analyzed.
Trace Elements and Major IonsDuring this study, 73 environmental samples of surface
water and wastewater effluent, 6 field-blank samples, and one field-duplicate pair were analyzed for dissolved concentra-tions of 54 trace elements and major ions at the USGS-NRPL (appendix 3). Laboratory measurements were made in tripli-cate for each trace element and concentrations in appendix 3 are averages of these three measurements. In addition, known standard reference materials were analyzed randomly with the environmental samples at a frequency of no less than 20 percent. These standard reference materials (including USGS Standard Reference Water Samples), were selected to simulate typical water sample matrices (Taylor, 2001). To establish a measure of accuracy, the difference between the most prob-able values and measured values during sample analysis with chemicals occurring at nominal natural water concentration levels typically was 4 percent or better (Barber, Keefe, and others, 2003). Approximately 25 percent of samples analyzed for trace elements and major ions consisted of laboratory-blank samples. Concentrations of trace elements in laboratory-blank samples generally were less than the method detection levels (Ron Antweiler, U.S. Geological Survey, oral commun., January 2010).
Among the six field-blank samples, 30 of the 54 trace elements or major ions analyzed were detected at least once at low concentrations. That frequency of detections indicates a potential source of field or laboratory contamination (table 9). For these 30 trace elements and all chemicals in this report, a conservative approach was used to flag environmental data using the field-blank concentrations in order to assure that reported concentrations were minimally affected by con-tamination. The mean and standard deviation of the blank sample concentrations for each of the 30 trace elements were calculated using a maximum likelihood estimation technique (Helsel, 2005). This technique is useful for statistical estima-tion for datasets with censored and non-censored data and for datasets with multiple censoring levels. The technique provides estimates of the sample mean and standard devia-tion that account for concentration data less than the detection limit. Statistics were calculated using the survReg routine in TIBCO© Spotfire S+ statistical analysis software (Palo Alto, Calif). As an example to describe the technique, cadmium was quantified in three blank samples at concentrations of 0.0044,

34
Endocrine Active Chem
icals, Pharmaceuticals, and O
ther Chemicals of Concern in Selected Stream
sTable 7. Hydrologic properties determined from tracer studies for selected sites.
[m/m, meter per meter; m/s, meters per second; m2/s, meters squared per second; +, plus; WWTP, wastewater-treatment plant]
Wastewater-treatment
plant location
Receiving water
Fraction of effluent1
(feff )
Date water sampled
Tracer study date
Volume RWT2 (Vs)
(liters)
Down-stream width
(B) (meters)
Down-stream depth
(H) (meters)
Slope3 (S)
(m/m)
Median hydraulic transit
time4 (tmed) (minutes)
Average velocity5
(uest)(m/s)
Longitudinal dispersion6
(Elat )(m2/s)
Theoretical mixing
distance7 (Lm) (meters)
Williams Williams Creek
0.06 10/20/2009 10/20/2009 0.01 2.5 0.21 0.002 10 0.02 0.01 6
Eveleth Elbow Creek .93 09/29/2009 09/29/2009 .03 1.59 .11 .008 7 .08 .01 10Pelican
RapidsPelican River .01 10/19/2009 10/19/2009 .5 9.82 .64 .00066 26 .26 .02 400
Sauk Center Sauk River .03 09/16/2009 09/16/2009 2 21.04 .49 .0036 118 .14 .04 700Melrose Sauk River .10 09/17/2009 09/17/2009 2+ 18.29 .45 .0007 99 .16 .02 1,000Zimmerman Tibbets
Brook.53 09/03/2009 09/02/2009 .2 1.16 .37 .002 6 .08 .02 2
Litchfield Jewitts Creek .18 10/08/2009 10/08/2009 .13 4.21 .51 .0021 29 .22 .03 50Hutchinson South Fork
Crow River
.16 09/14/2009 09/14/2009 .93 23.02 .24 .0005 73 .15 .01 6,000
Marshall Redwood River
.19 10/07/2009 10/07/2009 1.25 11.89 .44 .0005 115 .3 .01 1,000
Fairmont Center Creek .84 09/09/2009 09/08/2009 .4 14.63 .37 .0005 217 .03 .01 300Hinckley Grindstone
River.04 09/02/2009 09/01/2009 .4 7.93 .42 .002 296 .12 .02 100
Rochester Zumbro River
.27 09/22/2009 09/22/2009 4 15.24 .43 .008 170 .19 .05 400
Spring Valley
Spring Valley Creek
.08 09/21/2009 09/21/2009 .1 6.71 .22 .024 51 .08 .03 50
Austin Cedar River .12 09/08/2009 09/07/2009 1 18.6 .37 .0057 48 .18 .03 800Luverne Rock River .02 10/06/2009 10/06/2009 .24 13.41 .76 .0087 11 .19 .12 100
1Fraction of wastewater was determined as discharge from the WWTP divided by the sum of the discharge from the WWTP plus the streamflow at the upstream site. 2Rhodamine WT dye with 20-percent active ingredient.3Stream slope was determined for each site with a geographic information system by locating the points where contour lines cross blue stream lines on U.S. Geological Survey 1:24,000 topographic maps.
The distance between contour crossings was measured using high-resolution National Hydrography data (U.S. Geological Survey, 2008). The distance between contour crossings was divided by the change in altitude to obtain stream slope.
4Time for 50 percent of the rhodamine WT dye to pass the observation point. Two instruments were used at Rochester, Austin, Marshall, Litchfield, Luverne, Pelican Rapids, and Williams; the values for these sites were determined as the average of two instruments. One instrument was used at the other locations.
5Determined by dividing distance from the WWTP to downstream site by the median hydraulic transit time.6Longitudinal dispersion coefficient.7Theoretical lateral mixing point for a side discharge.

Data for Endocrine Active Chemicals, Pharmaceuticals, Other Chemicals of Concern, and Biological Characteristics 35
Table 8. Quality-assurance summary for major ions and nutrients in water samples analyzed at the U.S. Geological Survey National Water Quality Laboratory.
[Filtered analyses indicate dissolved concentrations, and unfiltered analyses indicate total concentrations. n, number; mg/L, milligrams per liter; nd, not detected; E, estimated concentration less than the laboratory reporting level]
Chemical
Field blank samples(n = 6)
Environmental samples (n = 73)
Field duplicate samples
(n = 2 pairs)
Range in detected
concentrations (mg/L)
Frequency of detection(percent)
Range in detected concentrations
(mg/L)
Average relative percent difference
(percent)
Filtered chloride nd 0 4.35–523 0.3Filtered sulfate nd 0 2.11–1,050 .1Filtered ammonia plus organic nitrogen as nitrogen E0.05–E0.07 50 0.18–13.0 2.0Unfiltered ammonia plus organic nitrogen as nitrogen nd 0 0.25–14.0 .8Filtered ammonia as nitrogen nd 0 0.021–13.2 9.0Filtered nitrate plus nitrite as nitrogen nd 0 E0.03–170 1.8Filtered nitrite as nitrogen nd 0 E0.001–1.09 2.1Filtered orthophosphate as phosphorus nd 0 E0.004–8.7 5.7
Filtered phosphorus nd 0 0.007–7.9 2.0Unfiltered phosphorus nd 0 0.012–8.41 1.2
0.0028, and 0.002 µg/L, and left-censored concentrations were <0.001, <0.001, and <0.0007 in the remaining three blank samples. The calculated mean and standard deviation of the blank sample concentrations using the maximum likelihood estimation technique were 0.001 and 0.0023, respectively. The mean plus two standard deviations for cadmium concentra-tions was 0.0057. All environmental sample concentrations of cadmium equal to or less than 0.0057 were flagged (marked with a “C” remark code preceding the value to indicate poten-tial contamination) in the dataset (appendix 3). This procedure resulted in flagging four cadmium concentrations in environ-mental samples with “C.” The same process was used for the other trace elements that were detected in blank samples. The average RPD for all trace elements in the one replicate pair was 34 ± 40 percent.
PharmaceuticalsDuring this study, 73 environmental samples of surface
water and wastewater effluent, 20 laboratory-blank samples, 20 laboratory-spike samples, 6 field-blank samples, 2 pairs of field-duplicate samples, and 2 field-spike samples were analyzed for 16 pharmaceuticals and 2 surrogate chemicals at the USGS-NWQL (appendix 4). Acetaminophen, caffeine, codeine, and diphenhydramine were detected in laboratory-blank samples (table 10). Concentrations of acetaminophen, caffeine, codeine, and diphenhydramine in laboratory-blank samples were used to flag environmental data that may have been affected by contamination. The mean and two stan-dard deviations of the blank-sample concentrations for each
chemical were calculated using maximum likelihood estima-tion techniques described in the “Trace Elements and Major Ions” section. Detected concentrations that were less than the calculated mean plus two standard deviations of the blank concentrations were flagged (a “C” qualifier code precedes the value) in the dataset (appendix 4); only detected environmen-tal concentrations of acetaminophen and caffeine had to be flagged in the dataset as all detected concentrations of codeine and diphenhydramine were greater than the calculated mean plus two standard deviations of the blank samples.
Percent recoveries for pharmaceuticals in the laboratory-spike samples ranged from 8 to 146 percent, with an average recovery of 63 ± 15 percent among all pharmaceuticals. The percent recoveries for individual samples vary from the aver-age making it important to look at individual results that are unusually high or low in subsequent analyses. Diltiazem and sulfamethoxazole in the laboratory-spike samples had the low-est average recoveries (less than 40 percent).
Two surrogate pharmaceuticals, carbamazepine-d10 and ethyl nicotinate-d4, were added to all the samples. The surrogate recoveries were greater than 80 percent for both surrogates in all field-blank samples (appendix 4). The percent recoveries for carbamazepine-d10 ranged from 1.7 to 82.1 percent among all environmental samples, and on average were 38 ± 15 percent. The average recovery for ethylnicotin-ate-d4 in the environmental samples was 60 ± 11 percent. No pharmaceuticals were detected in the six field-blank samples. The average RPD for all pharmaceuticals in the two repli-cate pairs was low at 9.9 ± 9.2 percent, indicating acceptable reproducibility.

36 Endocrine Active Chemicals, Pharmaceuticals, and Other Chemicals of Concern in Selected Streams
Table 9. Quality-assurance summary for trace elements and major ions in water samples analyzed at the U.S. Geological Survey National Research Program Laboratory. —Continued
[All concentrations are dissolved concentrations and represent the average of three analyses. n, number; µg/L, micrograms per liter; mg/L, milligrams per liter; nd, not detected; --, not applicable]
Chemical
Field blank samples(n = 6)
Environmental samples (n = 73)
Field duplicate samples (n = 1 pair)
Range in detectedconcentrations
Frequency of detection(percent)
Range in detected
concentrations
Relative percent difference(percent)
Aluminum (µg/L) 0.13–0.93 100 1.2–298 87Antimony (µg/L) 0.005 33 0.024–2.3 3Arsenic (µg/L) 0.06 17 0.3–5.1 4Barium (µg/L) 0.02–0.22 100 0.65–129 3Beryllium (µg/L) nd -- 0.02–0.03 --Bismuth (µg/L) 0.002 17 0.003–0.19 --Boron (µg/L) nd -- 7–562 1Cadmium (µg/L) 0.002–0.0044 50 0.006–0.34 52Calcium (mg/L) 0.02–0.10 50 9.3–143 1Cerium (µg/L) 0.0007–0.0013 67 0.002–0.36 93Cesium (µg/L) nd -- 0.003–8.6 6Chromium (µg/L) 0.1–0.2 33 0.3–2.1 --Cobalt (µg/L) nd -- 0.1–2 --Copper (µg/L) 0.08–0.51 100 0.46–30 --Dysprosium (µg/L) nd -- 0.0003–0.041 0Erbium (µg/L) nd -- 0.0004–0.045 --Europium (µg/L) 0.0001 17 0.0002–0.007 --Gadolinium (µg/L) nd -- 0.0004–0.82 24Holmium (µg/L) nd -- 0.0001–0.011 100Iron (µg/L) 4–9 33 13–1,090 --Lanthanum (µg/L) 0.0004–0.0005 67 0.0011–0.17 --Lead (µg/L) 0.005–0.026 67 0.027–0.62 37Lithium (µg/L) nd -- 0.9–78 8Lutetium (µg/L) nd -- 0.0001–0.013 --Magnesium (mg/L) nd -- 2.3–115 3Manganese (µg/L) 0.02–0.27 100 0.57–602 120Molybdenum (µg/L) 0.02 17 0.14–27 10Neodymium (µg/L) 0.0005–0.0006 33 0.0017–0.20 55Nickel (µg/L) nd -- 0.4–11 --Phosphorus (µg/L) 7 17 9–11,100 1Potassium (mg/L) nd -- 0.69–63 1Praseodymium (µg/L) 0.0001–0.0002 33 0.0003–0.048 --Rhenium (µg/L) nd -- 0.0011–0.20 5Rubidium (µg/L) 0.002–0.004 67 0.72–77 1Samarium (µg/L) nd -- 0.0007–0.043 --Selenium (µg/L) nd -- 0.1–7.0 --Silica (mg/L) 0.021 17 3.1–38 7Sodium (mg/L) nd -- 3.3–539 4

Data for Endocrine Active Chemicals, Pharmaceuticals, Other Chemicals of Concern, and Biological Characteristics 37
Phytoestrogens, Pharmaceuticals, and an Antimicrobial
During this study 73 environmental samples of surface water and wastewater effluent, 7 field-blank samples, and 2 field-duplicate pairs were analyzed for 10 phytoestrogens, 8 pharmaceuticals, and 1 antimicrobial (appendix 5) at the University of Colorado Center for Environmental Mass Spec-trometry. No chemicals were detected in field-blank samples. Eight of the nine pharmaceuticals analyzed were detected in field-duplicate samples. The average RPDs were low for all pharmaceuticals ranging from 0.9 to 15 percent (table 11).
The accuracy and precision of the method were assessed at two different concentration levels in spiked-deionized water with five replicate samples each. Accuracy, expressed as the mean from the five measurements, ranged from 88 to 105 percent for all chemicals. Intra-day precision was calcu-lated as the percent relative standard deviation from the five measurements and ranged between 2 and 5 percent. Inter-day precision was measured by analyzing spiked water extracts on five consecutive days and ranged from 4 to 11 percent relative standard deviation.
Standard solutions of chemicals were added to tap water at seven different concentrations of 5, 10, 20, 40, 80, 200, and 400 nanograms per liter (ng/L) to obtain the standard calibra-tion curves, all of which went through the SPE system and were treated in an identical manner as the environmental sam-ples. These internal standards were used to account for recov-ery losses during SPE and any suppression from the matrix of the samples. An aliquot of 100 μL of the mixture containing the surrogate-labeled standards was added to each calibration sample and to each environmental sample. For the calibration curves, only the area of the quantifying transition was taken into account. All the calibration curves were linear between the concentrations studied with correlation coefficients higher than 0.99 for all the chemicals analyzed. The method detection limit was defined as the lowest concentration of the chemical that yielded minimum ion signal-to-noise ratios of 3:1 for both the quantitation and the confirmatory ions.
Table 9. Quality-assurance summary for trace elements and major ions in water samples analyzed at the U.S. Geological Survey National Research Program Laboratory. —Continued
[All concentrations are dissolved concentrations and represent the average of three analyses. n, number; µg/L, micrograms per liter; mg/L, milligrams per liter; nd, not detected; --, not applicable]
Chemical
Field blank samples(n = 6)
Environmental samples (n = 73)
Field duplicate samples (n = 1 pair)
Range in detectedconcentrations
Frequency of detection(percent)
Range in detected
concentrations
Relative percent difference(percent)
Strontium (µg/L) 0.18 17 31–877 111Sulfur (mg/L) 0.05 17 1.4–372 109Tellurium (µg/L) nd -- 0.006–0.08 67Terbium (µg/L) nd -- 0.0001–0.007 40Thallium (µg/L) 0.002 17 0.004–0.03 --Thorium (µg/L) nd -- 0.0013–0.018 40Thulium (µg/L) nd -- 0.0001–0.009 --Tin (µg/L) 0.005–0.007 50 0.008–0.44 --Titanium (µg/L) nd -- 0.4–0.9 --Tungsten (µg/L) 0.0008 17 0.0015–1.6 --Uranium (µg/L) nd -- 0.009–19.1 8Vanadium (µg/L) 0.23 17 0.3–5.1 --Ytterbium (µg/L) nd -- 0.0004–0.067 96Yttrium (µg/L) 0.0002–0.0004 83 0.0023–0.27 10Zinc (µg/L) 0.4–1.2 50 1.2–167 --Zirconium (µg/L) 0.004–0.01 50 0.039–1.3 44

38
Endocrine Active Chem
icals, Pharmaceuticals, and O
ther Chemicals of Concern in Selected Stream
sTable 10. Quality-assurance summary for pharmaceuticals in water samples analyzed at the U.S. Geological Survey National Water Quality Laboratory.
[n, number; µg/L, microgram per liter; nd, not detected; E, estimated concentration less than the laboratory reporting level; ±, plus or minus]
Chemical
Laboratory-blank samples (n = 20)
Laboratory-spike samples (n = 20)
Field-blank samples
(n = 6)
Environmental samples (n = 73)
Field-duplicate samples
(n = 2 pairs)
Field-spike samples
(n = 2)
Range in detected concentrations
(µg/L)
Frequency of detection
(percent)
Average recovery and standard deviation
(percent)
Range in detected concentrations
(µg/L)
Range in detected concentrations
(µg/L)
Average relative percent difference
(percent)
Average recovery and standard deviation
(percent)
Acetaminophen (µg/L) E0.0012–E0.0322 15 57 ± 14 nd nd nd 9 ± 5Albuterol (µg/L) nd nd 57 ± 11 nd nd nd 16 ± 8Caffeine (µg/L) E0.0108–E0.0364 15 91 ± 15 nd E0.051–E11.5 4 49 ± 8Carbamazepine (µg/L) nd nd 77 ± 11 nd E0.002–0.393 2 35 ± 14Codeine (µg/L) E0.0013 5 65 ± 11 nd E0.006–0.079 4 47 ± 5Cotinine (µg/L) nd nd 77 ± 15 nd E0.009–0.22 nd 34 ± 2Dehydronifedipine (µg/L) nd nd 69 ± 14 nd E0.004 0 60 ± 3Diltiazem (µg/L) nd nd 36 ± 12 nd E0.011–E0.046 21 14 ± 41,7-Dimethylxanthine (µg/L) nd nd 93 ± 24 nd E0.073–E4.32 nd 30Diphenhydramine (µg/L) E0.002 5 66 ± 11 nd E0.009-0.127 24 15 ± 1Fluoxetine (µg/L) nd nd na nd E0.002–E0.066 nd 1 ± 0.3Ranitidine (µg/L) nd nd na nd E0.015–E0.13 nd 7 ± 2Sulfamethoxazole (µg/L) nd nd 32 ± 21 nd E0.004–E0.289 16 14 ± 10Thiabendazole (µg/L) nd nd 53 ± 11 nd nd nd 9Trimethoprim (µg/L) nd nd 82 ± 14 nd E0.006–E0.35 8 37 ± 5Warfarin (µg/L) nd nd 46 ± 13 nd nd nd 27 ± 1

Data for Endocrine Active Chemicals, Pharmaceuticals, Other Chemicals of Concern, and Biological Characteristics 39
Alkylphenols and Other Neutral Organic Chemicals
During the course of this study, 73 environmental samples of surface water and wastewater effluent, 24 field-duplicate samples, 20 field-spike samples, 7 field-blank samples, and 3 laboratory-blank samples were analyzed at the USGS-NRPL for 23 alkylphenols and other neutral organic chemicals (appendix 6). Laboratory reporting levels for the chemicals ranged from less than 5 to 300 ng/L (table 5), and were defined as the concentration equivalent to three times the mean value detected in method laboratory blanks or three times the baseline signal, whichever was greater.
In general, few chemicals were detected in field-blank samples confirming that the collection and processing tech-niques are appropriate for chemicals that were analyzed in this study (table 12). The chemical 4-nonylphenol was detected
in one field-blank sample, 4-nonylphenoltriethoxylate was detected in two field-blank samples, 4-tert-octylphenol was detected in one field-blank sample, and 4-tert-octylphenol- diethoxylate was detected in one field-blank sample. Three chemicals were detected in the field-blank sample from one site (station number 434122092225001) indicating that there was a particular contamination problem for that sample that was not a pervasive contamination problem among all sam-ples. The chemical N,N-diethyl-meta-toluamide (DEET) was detected in one of three laboratory-blank samples at a concen-tration of 14 ng/L. Concentrations of the chemicals detected in blank samples were used to flag environmental data that may have been affected by contamination. The mean and two stan-dard deviations of the blank-sample concentrations for each chemical were calculated using maximum likelihood estima-tion techniques described in the “Trace Elements and Major Ions” section. Detected environmental concentrations that
Table 11. Quality-assurance summary for phytoestrogens, pharmaceuticals, and an antimicrobial chemical in water samples analyzed at the University of Colorado Center for Environmental Mass Spectrometry.
[n, number; µg/L, microgram per liter; nd, not detected; ±, plus or minus]
Chemical
Field-blank samples (n = 7)
Environmental samples (n = 73)
Field-duplicate samples (n = 2 pairs)
Range in detected concentrations
Frequency of detection(percent)
Range in detected concentrations
(ng/L)
Average relative percent difference and
standard deviation (percent)
Biochanin A1 nd 0 nd ndBupropion2 nd 0 10.4–4,298 15 ± 4Carbamazepine2 nd 0 5.7–1,475 0.9 ± 0.3Coumestrol1 nd 0 1.4–6 ndDaidzein1 nd 0 4.1 ndDaidzin (sugar)1 nd 0 nd ndEquol1 nd 0 nd ndFluoxetine2 nd 0 10–76 2.11Fluvoxamine2 nd 0 16–21 ndFormononetin1 nd 0 1.0–4.6 ndGenistein1 nd 0 nd ndGenistin (sugar)1 nd 0 nd ndGlycitein1 nd 0 11.0–14.6 ndHydroxy-bupropion2 nd 0 1–1,975 9 ± 6Prunetin1 nd 0 nd ndSulfamethoxazole2 nd 0 5–4,166 4 ± 2Triclocarban3 nd 0 20–416 14 ± 4Trimethoprim3 nd 0 6–1,463 7 ± 6Venlafaxine2 nd 0 5–5,451 4 ± 5
1Phytoestrogen.2Pharmaceutical.3Antimicrobial.

40
Endocrine Active Chem
icals, Pharmaceuticals, and O
ther Chemicals of Concern in Selected Stream
sTable 12. Quality-assurance summary for alkylphenols and other neutral organic chemicals in water samples analyzed at the U.S. Geological Survey National Research Program Laboratory.
[n, number; ng/L, nanograms per liter; nd, not detected; --, not applicable; ±, plus or minus]
Chemical
Laboratory-blank samples (n = 3)
Field-blank samples (n = 7)
Environmental samples (n = 73)
Field-duplicate samples
(n = 24 pairs)
Field-spike samples (n = 20)
Range in detected
concentrations (ng/L)
Frequency of detection (percent)
Range in detected
concentrations (ng/L)
Frequency of detection (percent)
Range in detected
concentrations (ng/L)
Relative percent
difference (percent)
Average recovery and standard
deviation (percent)
Acetyl hexamethyl tetrahydronaphthalene (AHTN) nd -- nd -- 1–110 20 ± 17 --
Bisphenol A nd -- nd -- 23–22,000 33 ± 31 73 ± 27
4-tert-Butylphenol nd -- nd -- 6–110 23 ± 28 58 ± 20Caffeine nd -- nd -- 21–9,900 20 ± 21 61 ± 242,6-Di-tert-butyl-1,4-benzoquinone nd -- nd -- 400–2,200 34 ± 24 162 ± 751,3-Dichlorobenzene nd -- nd -- 26–30 nd 45 ± 141,4-Dichlorobenzene nd -- nd -- 8–280 24 ± 13 56 ± 18N,N-diethyl-meta-toluamide (DEET) 14 33 nd -- 16–780 24 ± 28 73 ± 19Hexahydrohexamethylcyclopentabenzopyran
(HHCB) nd -- nd -- 6–640 18 ± 14 --
5-Methyl-1H-Benzotriazole nd -- nd -- 24–1,000 74 ± 40 37 ± 254-Nonylphenol (NP) nd -- 110 14 100–10,000 21 ± 23 60 ± 194-Nonylphenolmonoethoxylate (NP1EO) nd -- nd -- 52–2,200 44 ± 39 61 ± 154-Nonylphenoldiethoxylate (NP2EO) nd -- nd -- 96–3,400 28 ± 29 65 ± 184-Nonylphenoltriethoxylate (NP3EO) nd -- 990–5,300 29 4300–4,900 nd 56 ± 154-Nonylphenoltetraethoxylate (NP4EO) nd -- nd -- 46–300 68 ± 3 41 ± 144-tert-Octylphenol (TOP) nd -- 18 14 14–430 29 ± 11 63 ± 214-tert-Octylphenolmonoethoxylate (OP1EO) nd -- nd -- 6–31 44 ± 37 66 ± 174-tert-Octylphenoldiethoxylate (OP2EO) nd -- 23 14 24–850 99 77 ± 214-tert-Octylphenoltriethoxylate (OP3EO) nd -- nd -- 29 nd 60 ± 204-tert-Octylphenoltetraethoxylate (OP4EO) nd -- nd -- 50–78 nd 48 ± 174-tert-Octylphenolpentaethoxylate (OP5EO) nd -- nd -- 220–4,100 174 34 ± 194-tert-Pentylphenol nd -- nd -- 9–51 nd 57 ± 19Triclosan nd -- nd -- 11–410 24 ± 25 60 ± 17

Data for Endocrine Active Chemicals, Pharmaceuticals, Other Chemicals of Concern, and Biological Characteristics 41
were less than the calculated mean plus two standard devia-tions of the blank concentrations were flagged (a “C” qualifier code precedes the value) in the dataset (appendix 6).
The average recovery of the five surrogate standards for this method was 56 ± 17 percent. Surrogate recoveries vary among samples because of sample matrix effects, losses due to analytical processing, and degradation during sample storage. The average RPD for alkylphenols and other neutral organic chemicals that were detected in field-duplicate samples was 29 ± 30 percent.
Average recovery for the alkylphenols and neutral organic chemicals from the field-spike samples was 63 ± 25 percent. The recoveries were less than 50 percent for 5-methyl-1H-benzotriazole, 4-nonylphenoltetraethoxylate, 4-tert-octylphenoltetraethoxylate, and 4-tert-octylphenolpen-taethoxylate. The recoveries for all chemicals in the field spike from one WWTP sample (station number 433856096115801) were consistently low, and the surrogate recoveries for this sample were low indicating a complex sample matrix or some other interference with quantitation.
Carboxylic Acids
During the course of this study 73 environmental samples of surface water and wastewater effluent, 13 field-duplicate samples, 7 field-blank samples, 3 laboratory-blank samples, 8 field-spike samples, and 1 laboratory-spike sample were analyzed at the USGS-NRPL for carboxylic acids by the evaporation method (appendix 7). Samples were preserved in the field with 1-percent formalin to limit biodegradation. The laboratory reporting level for ethylenediaminetetraacetic acid, nitrilotriacetic acid, and the NP1EC to NP4EC was 1 μg/L (table 5), and was defined as the concentration equal to three times the mean value detected in method blanks or three times the baseline signal, whichever was greater. No chemicals were detected in laboratory-blank samples, and ethylenediaminetetraacetic acid was the only carboxylic acid detected in the field-blank samples (table 13). Concentrations of ethylenediaminetetraacetic acid detected in blank samples were used to flag environmental data for this chemical that may have been affected by contamination. The mean and two standard deviations of the blank-sample concentrations for this chemical were calculated using maximum likelihood estima-tion techniques described in the “Trace Elements and Major Ions” section. Detected concentrations that were less than the calculated mean plus two standard deviations of the blank concentrations were flagged (a “C” qualifier code precedes the value) in the dataset (appendix 7).
Average percent recovery of the surrogate standard (4-n-nonylphenolmonoethoxycarboxylate) was 103 ± 31 per-cent. The average RPD for carboxylic acids detected in field-duplicate samples was 13 ± 16 percent indicating acceptable reproducibility. Average recovery for method compounds from the field- and laboratory-spike samples was 84 ± 13 percent.
Steroidal Hormones and Other ChemicalsDuring the course of this study, 73 environmental
samples of surface water and wastewater effluent, 23 field-duplicate samples, 15 field-spike samples, 3 laboratory-blank samples, and 7 field-blank samples were analyzed at the USGS-NRPL for 17 steroidal hormones and 3 other chemicals in unfiltered water by the SPE method (appendix 8). Labora-tory reporting levels for the 20 chemicals ranged from 0.1 to 2 ng/L (table 5), defined as the concentration equal to three times the mean value detected in method blanks or three times the baseline signal, whichever was greater.
There were potential analytical issues related to the loss of one or more deuterium atoms in IDSs. In order to correct a potential positive bias due to D-loss, a conservative approach was used. Reported concentrations of chemicals determined using these six IDSs potentially susceptible to D-loss were censored to the laboratory reporting level, if needed, or were quantified relative to 17-alpha-ethynylestradiol-d4 (sur-rogate standard recoveries less than 10 percent) for any of the 73 environmental samples where D-loss was evident or suspected.
Bisphenol A, cholesterol, coprostanol, 17-beta-estradiol, epitestosterone, and estriol were detected in either labora-tory- or field-blank samples (table 14). Concentrations of these chemicals detected in blank samples were used to flag environmental data that may have been affected by contamina-tion. The mean and two standard deviations of the blank-sam-ple concentrations for these chemicals were calculated using maximum likelihood estimation techniques described in the “Trace Elements and Major Ions” section. Detected concentra-tions that were less than the calculated mean plus two standard deviations of the blank concentrations were flagged (a “C” qualifier code precedes the value) in the dataset (appendix 8).
Average recovery of the 13 IDSs and surrogate standards was 28 ± 19 percent. The average RPD for target compounds that were detected in 23 duplicate samples was 16 ± 7 percent. The average RPD for the surrogate standards between dupli-cate pairs was 17 ± 24 percent. Average recovery for the 20 compounds from the field-spike samples was 51 ± 41 percent.
Bed-Sediment Data
Analytical results and quality-assurance data for bed-sediment samples are presented in the following sections. The bed-sediment samples were analyzed for three carbon types, organic wastewater-indicator chemicals, and steroidal hormones.
Carbon and Wastewater-Indicator ChemicalsDuring this study, 25 environmental samples of bed sedi-
ment, 4 laboratory-blank samples, and 4 laboratory-spike sam-ples were analyzed for 3 carbon types, 57 wastewater-indicator chemicals, and 3 surrogate standards at the USGS-NWQL

42
Endocrine Active Chem
icals, Pharmaceuticals, and O
ther Chemicals of Concern in Selected Stream
s
Table 13. Quality-assurance summary for carboxylic acids in water samples analyzed at the U.S. Geological Survey National Research Program Laboratory.
[n, number; µg/L, micrograms per liter; nd, not detected; --, not applicable; ±, plus or minus]
Chemical
Laboratory-blank samples (n = 3)
Field-blank samples (n = 7)
Environmental samples (n = 73)
Field-duplicate samples
(n = 13 pairs)
Field-spike samples
(n = 8)
Range in detected
concentrations (µg/L)
Frequency of detection
(percent)
Range in detected
concentrations (µg/L)
Frequency of detection
(percent)
Range in detected concentrations
(µg/L)
Relative percent difference (percent)
Average recovery and
standard deviation (percent)
Ethylenediaminetetraacetic acid (EDTA) nd -- 5–24 100 27–580 7.0 ± 4.1 82.5 ± 14Nitrilotriacetic acid (NTA) nd -- nd -- 2–10 7.7 ± 5.5 56.4 ± 34.34-Nonylphenolmonoethoxycarboxylate (NP1EC) nd -- nd -- 2–110 18.9 ± 12.1 93.2 ± 10.64-Nonylphenoldiethoxycarboxylate (NP2EC) nd -- nd -- 2–130 18.6 ± 29.3 83.2 ± 17.14-Nonylphenoltriethoxycarboxylate (NP3EC) nd -- nd -- 2–19 -- 82.4 ± 17.24-Nonylphenoltetraethoxycarboxylate (NP4EC) nd -- nd -- 2–7 -- 97.3 ± 17.4

Data for Endocrine Active Chemicals, Pharm
aceuticals, Other Chemicals of Concern, and Biological Characteristics
43
Table 14. Quality-assurance summary for steroidal hormones and other chemicals in water samples analyzed at the U.S. Geological Survey National Research Program Laboratory.
[n, number; ng/L, nanograms per liter; nd, not detected; ±, plus or minus; --, not applicable]
Chemical
Laboratory-blank samples (n = 3)
Field-blank samples (n = 7)
Environmental samples (n = 73)
Field-duplicate samples
(n = 23 pairs)
Field-spike samples (n = 15)
Range in detected concentrations
(ng/L)
Frequency of detection
(percent)
Range in detected concentrations
(ng/L)
Frequency of detection
(percent)
Range in detected concentrations
(ng/L)
Relative percent difference (percent)
Average recovery and standard
deviation (percent)
4-androstene-3,17-dione1 nd -- nd -- nd -- 19 ± 32cis-Androsterone1 nd -- nd -- 3.0–4.6 15 ± 14 0 ± 1Bisphenol A3 35 33 nd -- 46–6,200 5 38 ± 75Cholesterol2 1,600–2,000 66 2,400 14 2,500 –92,000 21 ± 30 49 ± 563-beta-Coprostanol2 52–210 66 65–82 29 230–14,000 25 ± 33 70 ± 90Diethylstilbestrol1 nd -- nd -- 0.1–1.0 -- 35 ± 56Equilenin1 nd -- nd -- 0.3–8.2 11 ± 3 37 ± 37Equilin1 nd -- nd -- nd -- 39 ± 3117-alpha-Estradiol1 nd -- nd -- 0.4–2.5 27 94 ± 77
17-beta-Estradiol1 nd -- 0.375 14 0.4–10.2 19 ± 28 64 ± 44
Estriol1 nd -- 0.4 14 0.2–11 -- 40 ± 31Estrone1 nd -- nd -- 2.1–38 7 ± 7 166 ± 11317-alpha-Ethynylestradiol1 nd -- 0.296 14 0.1–1.5 16 ± 9 118 ± 43Mestranol1 nd -- nd -- 0.2 -- 102 ± 57Norethindrone1 nd -- nd -- nd -- 75 ± 49Progesterone1 nd -- nd -- nd -- 8 ± 24Testosterone1 nd -- nd -- 0.6 -- 15 ± 33dihydro-Testosterone1 nd -- nd -- nd -- 18 ± 35epi-Testosterone1 nd -- 3.15 14 nd -- 18 ± 3611-keto-testosterone1 nd -- nd -- nd -- 17 ± 25
1Steroidal hormones.2Sterols.3Plastic component.
44 Endocrine Active Chemicals, Pharmaceuticals, and Other Chemicals of Concern in Selected Streams
(appendix 9). The average percent recovery for surrogate standards was 62 ± 36 percent. Eighteen of the 57 wastewater-indicator chemicals were detected in laboratory-blank samples (appendix 9) at low concentrations. The environmental sample sizes vary, and thus the reporting levels change (are scaled) on the basis of sample weight extracted relative to reporting lev-els that assume a default 10-g sample size. The blank samples are composed of a 10-g sample. Because blank-sample and environmental-sample size differ from each other, a compari-son of these samples was made on total mass of a chemical rather than on concentrations, which can be misleading. For example, a concentration of 0.14 ng/g for a 1-g environmental sample size is the same as a concentration of 0.014 ng/g for a 10-g laboratory-blank sample. The mass of all chemicals in laboratory-blank samples and environmental samples was calculated by multiplying the concentrations of the sample by the weight of the sample. The mean and two standard devia-tions of the blank-sample masses for these chemicals were calculated using maximum likelihood estimation techniques described in the “Trace Elements and Major Ions” section. There were no cases where the environmental sample concen-tration was less than the mean plus two standard deviations of the concentrations in the blank samples. The average percent recovery for the 57 organic wastewater-indicator chemicals among the four laboratory-spike samples was 77 ± 25 percent. The chemicals 2,2’,4,4’-tetrabromodiphenylether (PBDE 47), bisphenol A, isophorone, and tris(dichloroisopropyl) phos-phate all had recoveries less than 40 percent in the laboratory-spike samples (appendix 9).
Steroidal Hormones and other chemicalsDuring this study, 25 environmental samples of bed
sediment, 4 laboratory-blank samples, and 4 laboratory-spike samples were analyzed for 17 steroidal hormones and three othe chemicals at the USGS NWQL (appendix 10). For the 11 samples extracted in 2009, 13 IDSs were used (table 6). For the 14 samples extracted in 2010, 5 of the original 13 IDSs were used with 4 alternative chemicals substituted as described in the “Bed-Sediment Chemical Analyses” section, resulting in the use of 9 compounds as IDSs, plus nandrolone-d3 as a surrogate only (table 6). The average percent recovery for all 18 IDSs in environmental samples was 47 ± 35 percent. The standards 17-beta-estradiol-d4, cholesterol-d7, dihy-drotestoterone-d4, estriol-d3, nandrolone-d3, norethindrone-d6, progesterone-d9, and testosterone-d5 all had low average recoveries (less than 40 percent).
Similar to the analyses of steroidal hormones in water, there was a potential analytical performance issue that was related to the loss of one or more deuterium atoms for the six IDSs shown in table 6 for the subset of the environmen-tal samples extracted in 2009 (Foreman and others, 2010). Because chemical concentrations are recovery-corrected using the IDSs, low-biased recoveries of the IDSs due to D-loss could have resulted in a positive bias in concentrations for the following 10 chemicals: 4-androstene-3,17-dione,
cis-androsterone, dihydrotestosterone, equilin, estrone, norethindrone, progesterone, testosterone, epi-testosterone, 11-keto-testosterone. In order to correct this potential positive bias, a conservative approach was used. For affected samples, reported concentrations were quantified relative to 17-alpha-ethynylestradiol-d4 to eliminate positive concentration bias, or were censored (particularly those with detected concentra-tions less than the laboratory reporting level) to reduce the risk of false positives for the 6 of the 10 chemicals noted above that had direct IDS analogs (table 6). As a consequence, it is possible that selected chemicals such as estrone and possibly 4-androstene-3,17-dione were censored when they were actu-ally present in the sample at a concentration less than the “less than” value listed in appendix 10. A reported “less than” value does not always constitute a non-presence.
Bisphenol A, cholesterol, and 3-beta-coprostanol were routinely detected in the laboratory-blank samples at less than 10 nanograms per gram (ng/g) for a 10-g sample and, thus, have higher minimum reporting levels than other chemicals (William Foreman, U.S. Geological Survey, oral commun., January 2011). The remaining 17 analytes were detected in one or more laboratory-blank samples at low concentrations ranging from 0.004 to 0.046 ng/g. The mass of all laboratory-blank samples and environmental samples was calculated by multiplying the concentrations of the sample by the weight of the sample. The mean and two standard deviations of the blank-sample masses for these chemicals were calculated using maximum likelihood estimation techniques described in the “Trace Elements and Major Ions” section. The masses of the environmental samples were compared to the blank sample masses and bisphenol A was the only chemical (in one sample) that had a detected concentration less than the mean plus two standard deviations of the blank concentrations. This concen-tration was flagged with a “C” qualifier code that precedes the value (appendix 10). Percent recoveries for laboratory-spike samples in baked Ottawa reagent sand averaged 95 ± 27 percent.
Biological Characteristics
Analytical results and quality-assurance data for biologi-cal characteristics are presented in the following sections. Two biological measures are described: (1) in-vitro cellular assays of “total estrogenicity,” and (2) in-vivo caged fish experiments to measure whole-organism responses.
Total Estrogenicity
During the study, 56 environmental samples of surface water and wastewater effluent, four distilled water blanks, four distilled water samples spiked with 17-beta-estradiol, three distilled water samples spiked with a mixture of 17-beta-estradiol and antiestrogen receptor (ICI) (0.1 micromolar), two matrix samples with Lake Superior water (LSW), two 17-beta-estradiol matrix (LSW) spike samples, and two

References Cited 45
17-beta-estradiol matrix (LSW) spike samples treated with ICI (0.1 micromolar) were analyzed for total estrogencity in units of 17-beta-estradiol equivalents at the UST Labora-tory (appendix 11). The distilled water samples, LSW matrix samples, distilled water co-treated with 17-beta-estradiol and ICI, and LSW matrix samples co-treated with 17-beta-estra-diol and ICI did not exhibit any estrogenic activity in the cell assay. The average and standard deviation of the measured-to-expected ratio in the distilled water samples spiked with 17-beta-estradiol was 0.896 ± 0.06. In matrix (LSW) spikes, it was 0.72 ± 0.11. The quantification limit of the method was calculated by calculating the environmental concentration at which a chemical induces a response 10 percent above the baseline (EC10). The EC10 was calculated from a nonlinear sigmoidal dose response curve fit to the relative luminescence units of the 17-beta-estradiol standards (using Prism 5.02., Graph Pad Software Inc., La Jolla, Calif.). The quantification limit was 0.211 ng/L, which was similar to the results of Wil-son and others (2004), who developed and tested the T47D-KBluc assay for estrogenic activity. The detection limit of the assay was the equivalent of 0.03 ng of the 17-beta-estradiol standard.
Caged Fish DataFish length, weight, body condition factor, and plasma
vitellogenin concentrations were determined in fish (fathead minnows) from the caged fish study by the SCSU Aquatic Toxicology Laboratory (appendix 12). A total of 236 fish plasma samples were analyzed for vitellogenin (appendix 12). Biological samples for analysis of plasma vitellogenin concentrations were coded to ensure that the analyst was unaware of the sample location. Plasma samples were ana-lyzed by enzyme-linked immunosorbent assay. All plasma samples were analyzed at three dilutions in duplicate and referenced against a multi-point standard curve (acceptable standard curve r2 greater than 0.95). Each assay included an aliquot analyzed in duplicate from a composite blood sample to determine interassay variation.
SummaryThis report presents the study design, environmental
data, and quality-assurance data for an integrated chemical and biological study of selected streams or lakes that receive wastewater in Minnesota. Datasets for this study are located in appendixes 1 through 12. Data for appendixes 1–12 are available in Microsoft Excel format on the report’s Web page at http://pubs.usgs.gov/ds/575/downloads/.
This study was a cooperative effort of the U.S. Geo-logical Survey, the Minnesota Pollution Control Agency, St. Cloud State University, University of St. Thomas, and the University of Colorado. The objective of the study was to identify distribution patterns of chemicals of concern
including endocrine-active chemicals, pharmaceuticals, and other organic chemicals of concern input to streams and lakes, and to identify biological characteristics (estrogenicity and fish responses) in the same streams.
The U.S. Geological Survey collected and analyzed water samples (surface water and wastewater effluent), bed-sediment samples, and quality-assurance samples and measured or recorded streamflow once from September through November 2009. Twenty-five wastewater-treatment plants were selected to include those of differing treatment types (continuous flow or periodic releases), differing processing steps (activated sludge or trickling filters), and plant design flows ranging from 0.001 to 10.9 cubic meters second (0.04 to 251 million gallons per day) throughout Minnesota in varying land-use settings.
Water samples were collected from the treated effluent of 25 wastewater-treatment plants and at one point upstream from and one point downstream from wastewater-effluent discharges. Bed-sediment samples also were collected at each of the stream or lake locations. Water samples were analyzed for major ions, nutrients, trace elements, pharmaceuticals, phytoestrogens and pharmaceuticals, alkylphenols and other neutral organic chemicals, carboxylic acids, and steroidal hormones. A subset (25 samples) of the bed-sediment samples were analyzed for carbon, wastewater-indicator chemicals, and steroidal hormones; the remaining samples were archived.
Biological characteristics were determined by using an in-vitro bioassay to determine total estrogenicity in water samples and a caged fish study to determine characteristics of fish from experiments that exposed fish to wastewater effluent in 2009. St. Cloud State University deployed and processed caged fathead minnows at 13 stream sites during September 2009 for the caged fish study. Measured fish data included length, weight, body condition factor, and vitellogenin concentrations.
References Cited
Ahel, Marijan, Giger, Walter, and Koch, Markus, 1994a, Behaviour of alkylphenol polyethoxylate surfactants in the aquatic environment. I. Occurrence and transforma-tion in sewage treatment: Water Research, v. 28, no. 5, p. 1,131–1,142.
Ahel, Marijan, Giger, Walter, and Schaffner, Christian, 1994b, Behaviour of alkylphenol polyethoxylate surfactants in the aquatic environment. II. Occurrence and transformation in rivers: Water Research, v. 28, no. 5, p. 1,143–1,152.
Ankley, G., Francis, E., Gray, E., Kavlock, R., McMaster, S., Reese, D., Sayles, G., Sergeant, A., and Vallero, D., 1998, Research plan for endocrine disruptors: Research Triangle Park, N.C., Office of Research and Development, U.S. Environmental Protection Agency, EPA600/R–98/087, 47 p.
46 Endocrine Active Chemicals, Pharmaceuticals, and Other Chemicals of Concern in Selected Streams
Antignac, J.P., Le Bizec, B., Monteau, F., and Andre, F., 2003, Validation of analytical methods based on mass spectro-metric detection according to the “2002/657/EC” European decision—guideline and application: Analytica Chimica Acta, v. 483, p. 325–334.
Barber, L.B., Brown, G.K., and Zaugg, S.D., 2000, Potential endocrine disrupting organic chemicals in treated municipal wastewater and river water, in Keith, L.H., Jones-Lepp, T.L., and Needham, L.L., eds., Analysis of environmental endocrine disruptors: American Chemical Society Sympo-sium Series 747, Washington, D.C., p. 97–123.
Barber, L.B., Furlong, E.T., Keefe, S.H., Brown, G.K., and Cahill, J.D., 2003, Natural and contaminant organic com-pounds in the Boulder Creek Watershed, Colorado, during high-flow and low-flow conditions, 2000, in Murphy, S.F., Verplanck, P.L., and Barber, L. B., eds., Comprehensive water quality of the Boulder Creek Watershed, Colorado, during high-flow and low-flow conditions, 2000: U.S. Geological Survey Water-Resources Investigations Report 03–4045, p. 103–144.
Barber, L.B., Keefe, S.H., Brown, G.K., Taylor, H.E., Ant-weiler, R.C., Peart, D.B., Plowman, T.I., Roth, D.A., and Wass, R.D., 2003, Organic and trace element contaminants in water biota, sediment, and semipermeable membrane devices at the Tres Rios Treatment Wetlands, Phoenix, Arizona: U.S. Geological Survey Water-Resources Investi-gations Report 03–4129, 89 p.
Barber, L.B., Lee, K.E., Swackhammer, D.L., and Schoen-fuss, H.L., 2007, Reproductive responses of male fathead minnows exposed to wastewater-treatment plant effluent, effluent treated with XAD8 resin, and an environmentally relevant mixture of alkylphenol compounds: Aquatic Toxi-cology, v. 82, p. 36–46.
Barnes, K.K., Kolpin, D.W., Focazio, M.J., Furlong, E.T., Meyer, M.T., Zaugg, S.D., Haack, S.K., Barber, L.B., and Thurman, E.M., 2008, Water-quality data for pharmaceuti-cals and other organic wastewater contaminants in ground-water and in untreated drinking water sources in the United States, 2000–01: U.S. Geological Survey Open-File Report 2008–1293, 7 p. plus tables. (Also available at http://pubs.usgs.gov/of/2008/1293/pdf/OFR2008-1293.pdf.)
Bistodeau, T.J., Barber, L.B., Bartell, S.E., Cediel, R.A., Grove, K.J., Klaustermeier, Jacob, Woodard, J.C., Lee, K.L., and Schoenfuss, H.L., 2006, Larval exposure to envi-ronmentally relevant mixtures of alkylphenolethoxylates reduces reproductive competence in male fathead minnows: Aquatic Toxicology, v. 79, p. 268–277.
Burkhardt, M.R., Zaugg, S.D., Smith, S.G., and ReVello, R.C., 2006, Determination of wastewater compounds in sedi-ment and soil by pressurized solvent extraction, solid-phase extraction, and capillary-column gas chromatography/mass spectrometry: U.S. Geological Survey Techniques and Methods, book 5, chap. B2, 90 p.
Desbrow, C., Routledge, E.J., Brighty, G.C., Sumpter, J.P., and Waldock, M., 1998, Identification of estrogenic chemicals in STW effluent. 1. Chemical fractionation and in vitro bio-logical screening: Environmental Science and Technology, v. 32, p. 1,549–1,558.
Drewes, J.E., Hemming, J., Ladenburger, S.J., Schauer, J., and Sonzogni, W., 2005, An assesment of endocrine disrupting activity changes during wastewater treatment through the use of bioassays and chemical measurements: Water Envi-ronment Research, v. 77, p. 12–23.
Ferrer, I., Barber, L.B., and Thurman, E.M., 2009, Gas chromatographic-mass spectrometric fragmentation study of phytoestrogens as their trimethylsilyl derivatives—Iden-tification in soy milk and wastewater samples: Journal of Chromatography A, v. 1216, p. 6,024–6,032.
Fisher, H.B., List, E.J., Koh, R.C.Y., Imberger, J., and Brooks N.H., 1979, Mixing in inland and coastal waters: New York Academic Press, 483 p.
Fishman, M.J., Raese, J.W., Gerlitz, C.N., and Husband, R.A., 1994, U.S. Geological Survey approved inorganic and organic methods for the analysis of water and fluvial sedi-ment, 1954–94: U.S. Geological Survey Open-File Report 94–351, 55 p.
Folmar, L.C., Denslow, N.D., Kroll, K., Orlando, E.F., Enb-lom, J., Marcino, J., Metcalfe, C., and Guillette, L.J., Jr., 2001, Altered serum sex steroids and vitellogenin induction in walleye (Stizostedion vitreum) collected near a metro-politan sewage treatment plant: Archives of Environmental Contamination Toxicology, v. 40, p. 392–398.
Folmar, L.C., Denslow, N.D., Rao, V., Chow, M., Crain, D.A., Enblom, J., Marcino, J., and Guillette, L.J, Jr., 1996, Vitel-logenin induction and reduced serum testosterone concen-trations in feral male carp (Cyprinus carpio) captured near a major metropolitan sewage treatment plant: Environmental Health Perspectives, v. 104, p. 1,096–1,101.
Foreman, W.T., ReVello, R.C., and Gray, J.L., 2010, Deute-rium exchange complicates isotope dilution methods for steroid hormones: SETAC North America, 31st Annual Meeting, November 7–11, 2010, Portland, Oreg., abstract no. 670.

References Cited 47
Furlong, E.T., Werner, S.L., Anderson, B.D., and Cahill, J.D., 2008, Methods of analysis by the U.S. Geological Survey National Water Quality Laboratory—Determination of human-health pharmaceuticals in filtered water by chemi-cally modified styrene-divinylbenzene resin-based solid-phase extraction and high-performance liquid chromatogra-phy/mass spectrometry: U.S. Geological Survey Techniques and Methods, book 5, chap. B5, 56 p.
Furlong, E.T., Gray, J.L., Quanrud, D.M., Teske, S.E., Esposito, K., Marine, J., Ela, W.P., Phillips, P.J., Kolpin, D.W., and Stinson, B., 2010, Fate of estrogenic compounds during municipal sludge stabilization and dewatering: Water Environment Research Foundation Final Project Report No. 04–HHE–6, p. 178.
Gagnaire, B., Gagné, F., André, C., Blaise, C., Abbaci, K., Budzinski, H., Dévier, M.H., and Garric, J., 2009, Develop-ment of biomarkers of stress related to endocrine disruption in gastropods—alkali-labile phosphates, protein-bound lipids and vitellogenin-like proteins: Aquatic Toxicology, v. 5, p. 155–167.
Garbarino, J.R., and Taylor, H.E., 1979, An inductively coupled plasma-atomic emission spectrometric method for routine water quality testing: Applied Spectroscopy, v. 33, p. 220–226.
Garbarino, J.R., and Taylor, H.E., 1994, Inductively coupled plasma-mass spectrometric method for the determination of dissolved trace elements in natural water: U.S. Geological Survey Open-File Report 94–358, 88 p.
Goodbred, S.G., Gilliom, R.J., Gross, T.S., Denslow, N.D., Bryant, W.L., and Schoeb, T.R., 1997, Reconnaissance of 17-estradiol, 11-ketotestosterone, vitellogenin, and gonad histopathology in common carp of the United States streams—potential for contaminant-induced endocrine dis-ruption: U.S. Geological Survey Open-File Report 96–627, 47 p.
Guy, H.P., 1969, Laboratory theory and methods for sediment analysis: U.S. Geological Survey Techniques of of Water-Resources Investigations, book 5, chap. C1, 58 p.
Helsel, D.R., 2005, Nondetects and data analysis: New York, Wiley, 250 p.
Huang, C.H., and Sedlak, D.L., 2001, Analysis of estrogenic hormones in municipal wastewater effluent and surface water using enzyme-linked immunosorbent assay and gas chromatography/tandem mass spectrometry: Environmental Toxicology and Chemistry, v. 20, p. 133–139.
Iowa Department of Natural Resources, 2007, Open feed-lots listed in the Iowa Department of Natural Resources’ animal feeding operations database, March 2007, accessed June 2010 at ftp://ftp.igsb.uiowa.edu/gis_library/ia_state/agriculture/AFO_open_feedlots.zip.
Jobling, Susan, and Sumpter, J.P., 1993, Detergent components in sewage effluent are weakly estrogenic to fish—an in vitro study using rainbow trout (Oncorhynchus mykiss) hepato-cytes: Aquatic Toxicology, v. 27, p. 361–372.
Jobling, S., Sheahan, D., Osborne, J.A., Matthiessen, P., and Sumpter, J.P., 1996, Inhibition of testicular growth in rain-bow trout (Oncorhynchus mykiss), exposed to estrogenic alkylphenolic chemicals: Environmental Toxicology and Chemistry, v. 15, p. 194–202.
Johnson, A.C., and Sumpter, J.P., 2001, Removal of endocrine-disrupting chemicals in activated sludge treatment works: Environmental Science and Technology, v. 35, p. 4,697–4,703.
Kilpatrick, F.A., and Wilson, J.F., Jr., 1989, Measurement of time of travel in streams by dye tracing: U.S. Geological Survey Techniques of Water-Resources Investigations, book 3, chap. A9, 27 p.
Kime, D.E., 1998, Endocrine disruption in fish: Boston, Klu-wer Academic Publishers, 396 p.
Kolpin, D.W., Furlong, E.T., Meyer, M.T., Thurman, E.M., Zaugg, S.D., Barber, L.B., and Buxton, H.T., 2002, Pharma-ceuticals, hormones, and other organic wastewater contami-nants in U.S. streams, 1999–2000—A national reconnais-sance: Environmental Science and Technology, v. 36, p. 1,202–1,211.
Lajeunesse, A., Gagnon, C., and Sauve, S., 2008, Deter-mination of basic antidepressants and their n-desmethyl metabolites in raw sewage and wastewater using solid-phase extraction and liquid chromatography-tandem mass spectrometry: Analytical Chemistry, v. 80, p. 5,325–5,333.
Lee, K.E., and Blazer, V., 2005, Endocrine disruption in Min-nesota fish—a comparison of fish species Cyprinus carpio and Micropterus: Madison, Wisc., Society of Environmental Toxicology and Chemistry, v. 136, p. 381–388.
Lee, K.E., Barber, L.B., Furlong, E.T., Cahill, J.D., Kolpin, D.W., Meyer, M.T., and Zaugg, S.D., 2004, Presence and distribution of organic wastewater compounds in waste-water, surface, ground, and drinking waters, Minnesota, 2000–02: U.S. Geological Survey Scientific Investigations Report 2004–5138, 47 p. (Also available at http://pubs.usgs.gov/sir/2004/5138/.)
Lee, K.E., Blazer, V.S., Denslow, N.D., Goldstein, R.M., and Talmage, P.J., 2000, Use of biological characteristics of common carp (Cyprinus carpio) to indicate exposure to hor-monally active agents in selected Minnesota Streams: U.S. Geological Survey Water-Resources Investigation Report 00–4202, 47 p. (Also available at http://mn.water.usgs.gov/publications/pubs/00-4202.pdf.)

48 Endocrine Active Chemicals, Pharmaceuticals, and Other Chemicals of Concern in Selected Streams
Lee, K.E., Schoenfuss, H.L., Jahns, N.D., Brown, G.K., and Barber, L.B., 2008, Alkylphenols, other endocrine-active chemicals, and fish responses in three streams in Minne-sota—study design and data, February–September 2007: U.S. Geological Survey Data Series 405, 44 p., accessed August 14, 2009, at http://pubs.usgs.gov/ds/405/.
Lee, K.E., Yaeger, C.S., Jahns, N.D., and Schoenfuss, H.L., 2008, Occurrence of endocrine active compounds and biological responses in the Mississippi River—Study design and data, June–August 2006: U.S. Geological Survey Data Series 368, 27 p., accessed August 14, 2009, at http://pubs.usgs.gov/ds/368/.
Lee, K.E., Schoenfuss, H.L., Barber, L.B., Writer, J.H., Blazer, V.S., Kiesling, R.L., and Ferrey, M.L., 2010, Endocrine active chemicals and endocrine disruption in Minnesota stream and lakes—implications for aquatic resources, 1994–2008: U.S. Geological Survey Scientific Investiga-tions Report 2010–5107, 47 p. with appendixes (Also avail-able at http://pubs.usgs.gov/sir/2010/5107/.).
Martinovic, Dalma, Denny, J.S., Schmieder, P.K., Ankley, G.T., and Sorensen, P.W., 2008, Temporal variation in the estrogenicity of a sewage treatment plant effluent and its biological significance: Environmental Science and Tech-nology, v. 42, p. 3,421–3,427.
Miles-Richardson, S.R., Kramer, V.J., Fitzgerald, S.D., Ren-der, J.A., Yamini, B., Barbee, S.J., and Giesy, J.P., 1999, Effects of waterborne exposure of 17β-estradiol on sec-ondary sex characteristics and gonads of fathead minnows (Pimephales promelas): Aquatic Toxicology, v. 47, p. 129–145.
Minnesota Office of the Revisor of Statutes, 2010, Minnesota Administrative Rules 7053.0215, Requirements for point source discharges of sewage, accessed December 3, 2010, at https://www.revisor.mn.gov/rules/?id=7053.0215.
Minnesota Pollution Control Agency, 2009, Feedlots tracked by MPCA, Minnesota Pollution Control Agency Delta data-base, accessed November 2009 at ftp://files.pca.state.mn.us/pub/feedlots.
Morlock, S.E., Nguyen, H.T., and Ross, J.H., 2002, Feasibil-ity of acoustic doppler velocity meters for the production of discharge records from U.S. Geological Survey streamflow-gaging stations: U.S. Geological Survey Water-Resources Investigations Report 01–4157, 59 p.
National Agriculture Imagery Program, 2008, U.S. Depart-ment of Agriculture Farm Service Agency Color Aerial Photography [WMS Source], accessed November 2009, at http://www.mngeo.state.mn.us/chouse/wms/wms_image_server_description.html.
National Research Council, 1999, Hormonally active agents in the environment: Washington, D.C., National Academy Press, 429 p.
Nentwig, Gerrit, 2007, Effects of pharmaceuticals on aquatic invertebrates. Part II—the antidepressant drug fluoxetine: Archives of Environmental Contamination and Toxicology, v. 52, p. 163–170.
Painter, M.M., Buerkley, M.A., Julius, M.L., Vajda, A.M., Norris, D.O., Barber, L.B., Furlong, E.T., Schultz, M.M., and Schoenfuss, H.L., 2010, Antidepressants at environ-mentally relevant concentrations affect predator avoidance behavior of larval fathead minnows (Pimphales promelas): Environmental Toxicology and Chemistry, v. 28, p. 2,677–2,684.
Parks, L.G., Cheek, A.O., Denslow, N.D., Heppell, S.A., McLachlan, J.A., LeBlanc, G.A., and Sullivan, C.V., 1999, Fathead minnow (Pimephales promelas) vitellogenin—puri-fication, characterization and quantitative immunoassay for the detection of estrogenic compounds, Comparative bio-chemistry and physiology part C: Pharmacology, Toxicol-ogy and Endocrinology, v. 123, p. 113–125.
Patton, C.J., and Truitt, E.P., 1992, Methods of analysis by the U.S. Geological Survey National Water Quality Labo-ratory—Determination of total phosphorus by a Kjeldahl digestion method and an automated colorimetric finish that includes dialysis: U.S. Geological Survey Open-File Report 92–146, 39 p.
Rantz, S.E., and others, 1982a, Measurement and computation of streamflow. 1. Measurement of stage and discharge: U.S. Geological Survey Water-Supply Paper 2175, p. 1–284.
Rantz, S.E., and others, 1982b, Measurement and computation of streamflow. 2. Computation of discharge: U.S. Geologi-cal Survey Water-Supply Paper 2175, p. 285–631.
Richardson, M.L., and Bowron, J.M., 1985, The fate of phar-maceutical chemicals in the aquatic environment: Journal of Pharmacy and Pharmacology, v. 37, p. 1–12.
Runkel, R.L., 2002, A new metric for determining the impor-tance of transient storage: Journal North American Ben-thological Society, v. 21, p. 529–543.
Schaffner, C., and Giger, W., 1984, Determination of nitrolo-triacetic acid in water by high-resolution gas chromatogra-phy: Journal of Chromatography A, v. 312, p. 413–421.
Schoenfuss, H.L., Bartell, S.E., Bistodeau, T.B., Cediel, R.A., Grove, K.J., Zintek, L., Lee, K.E., and Barber, L.B., 2008, Impairment of the reproductive potential of male fathead minnows by environmentally relevant exposures to 4-nonyl-phenol: Aquatic Toxicology, v. 86, p. 91–98.

References Cited 49
Schultz, M.M., and Furlong, E.T., 2008, Trace analysis of antidepressant pharmaceuticals and their select degradates in environmental aquatic matrices by LC/ESI/MS/MS: Ana-lalytical Chemistry, v. 80, p. 1,756–1,762.
Streets, S., Ferrey, M., Solem, L., Preimesberger, A., and Hoff, P., 2008, Endocrine disrupting compounds—a report to the Minnesota Legislature: Minnesota Pollution Control Agency.
Stumpf, M., Ternes, T.A, Haberer, K., and Seel, P., 1996, Determination of pharmaceuticals in sewage plants and river water: Vom Wasser, v. 86, p. 291–303.
Taylor, H.E., 2001, Inductively Coupled Plasma-Mass Spec-trometry—Practices and techniques: San Diego, Calif., Academic Press, 294 p.
Ternes, T.A., 1998, Occurrence of drugs in German sewage treatment plants and rivers: Water Research, v. 32, no. 11, p. 3,245–3,260.
Ternes, T.A., Stumpf, M., Mueller, J., Haberer, K., Wilken, R.D., and Servos, M., 1999, Behavior and occurrence of estrogens in municipal sewage treatment plants. I. Inves-tigations in Germany, Canada, and Brazil: Science of the Total Environment, v. 225, p. 81–90.
U.S. Census Bureau, 2002, TIGER/Line data, U.S. 2000 Block Group vector digital data, accessed 2009, at ftp://hqwiftp.er.usgs.gov/pub/kjh/gis02/pop00.html.
U.S. Environmental Protection Agency, 1993, Methods for the determination of inorganic substances in environmental samples—Environmental Monitoring Systems Laboratory, Cincinnati, Ohio: U.S. Environmental Protection Agency EPA/600/R–93/100, variously paginated.
U.S. Geological Survey, 2006, National Land Cover Database Land Cover Layer 2001: U.S. Geological Survey [digital files], accessed October 2009, at http://www.mrlc.gov/nlcd_multizone_map.php.
U.S. Geological Survey, 2008, The National Hydrography Dataset, High Resolution, last accessed 2008 at http://nhd.usgs.gov/data.html.
U.S. Geological Survey, 2009, StreamStats for Minnesota Interactive map 2009, accessed November 2009 at http://water.usgs.gov/osw/streamstats/minnesota.html.
U.S. Geological Survey, variously dated, National field man-ual for the collection of water-quality data: U.S. Geologi-cal Survey Techniques of Water-Resources Investigations, book 9, chaps. A1–A9, accessed July 8, 2009, at http://pubs.water.usgs.gov/twri9A.
Vajda, A.M., Barber, L.B., Gray, J.L., Lopez, E.M., Woodling, J.D., and Norris, D.O., 2008, Reproductive disruption in fish downstream from an estrogenic wastewater effluent: Envi-ronmental Science and Technology, v. 42, p. 3,407–3,414.
Weishaar, J.L., Aiken, G.R., Bergamaschi, B.A., Fram, M.S., Fujii, R., and Mopper, K., 2003, Evaluation of specific ultraviolet absorbance as an indicator of the chemical com-position and reactivity of dissolved organic carbon: Envi-ronmental Science and Technology, v. 37, p. 4,702–4,708.
Wershaw, R.L., Fishman, M.J., Grabbe, R.R., and Lowe, L.E., eds., 1987, Methods for the determination of organic substances in water and fluvial sediments: U.S. Geological Survey Techniques of Water-Resources Investigations, book 5, chap. A3, 80 p.
Wilson, V.S., Bobseine, K., Gray, L.E.., Jr., 2004, Develop-ment and characterization of a cell line that stably expresses an estrogen-responsive luciferase reporter for the detection of estrogen receptor agonist and antagonists: Toxicological Sciences, v. 81, p. 69–77.
Wilson, V.S., Cardon, M.C., Gray, L.E., Jr., Hartig, P.C., 2007, Competitive binding comparison of endocrine-disrupting compounds to recombinant androgen receptor from fathead minnow, rainbow trout, and human: Environmental Toxicol-ogy Chemistry, v. 26, p. 1,793–1,802.
Writer, J.H., Barber, L.B., Brown, G.K., Taylor, H.E., Kies-ling, R.L., Ferrey, M.L., Jahns, N.D., Bartell, S.E., and Schoenfuss, H.L., 2010, Anthropogenic tracers, endocrine active chemicals, and endocrine disruption in Minnesota lakes: Science of the Total Environment, v. 409, no. 1, p. 100–111.

50 Endocrine Active Chemicals, Pharmaceuticals, and Other Chemicals of Concern in Selected Streams

Appendixes 1–12 51
Appendixes 1–12
These data files are included with the U.S. Geological Survey (USGS) Data Report 575 and are available for download at http://pubs.usgs.gov/ds/575/downloads. See report text for details about the study. The data tables are available for download in Microsoft© Excel (.xls) format. The first row of each data table contains information about the data. There are 12 appendixes included in this report.

52 Endocrine Active Chemicals, Pharmaceuticals, and Other Chemicals of Concern in Selected Streams
Appendix 1. Basic field properties and hydrologic characteristics of sampling sites
The Excel spreadsheet appendix_1.xls contains data on basic field properties and hydrologic characteristics for 73 sites sampled during September–November 2009. Instantaneous streamflow, effluent discharge, and basic water-quality properties of dissolved oxygen, pH, specific conductance, and water temperature are contained in the spreadsheet. This Excel file can be accessed at http://pubs.usgs.gov/ds/575/downloads/appendix_1.xls.
Appendix 2. Concentrations of major ions and nutrients in water samples and quality-assurance samples analyzed at the U.S. Geological Survey National Water Quality Laboratory, and suspended sediment analyzed at the U.S. Geological Survey Iowa Sediment Laboratory
The Excel spreadsheet appendix_2.xls contains concentration data for 2 major ions and 6 nutrients for which water samples in this study were analyzed. This spreadsheet contains separate worksheets for the analytical results of water samples collected from 73 sites during September–November 2009 (“Environmental” worksheet) and the analytical results of the associated quality-assurance samples (“Quality Assurance” worksheet). This Excel spreadsheet can be accessed at http://pubs.usgs.gov/ds/575/downloads/appendix_2.xls.
Appendix 3. Dissolved concentrations of trace elements and major ions in water samples and quality-assurance samples analyzed at U.S. Geological Survey National Research Program Laboratory.
The Excel spreadsheet appendix_3.xls contains dissolved concentration data for 54 trace elements and major ions for which water samples in this study were analyzed. This spreadsheet contains separate worksheets for the analytical results of water samples collected from 73 sites during September–November 2009 (“Environmental” worksheet) and the analytical results of the associated quality-assurance samples (“Quality Assurance” worksheet). This Excel file can be accessed at http://pubs.usgs.gov/ds/575/downloads/appendix_3.xls.
Appendix 4. Concentrations of pharmaceuticals in water samples and quality-assurance samples analyzed at the U.S. Geological Survey National Water Quality Laboratory
The Excel spreadsheet appendix_4.xls contains concentration data for 16 pharmaceuticals and 2 surrogate standards for which water samples in this study were analyzed. This spreadsheet contains separate worksheets for the analytical results of water samples collected from 73 sites during September–November 2009 (“Environmental” worksheet) and associated quality-assurance samples (“Quality Assurance” worksheet). This Excel file can be accessed at http://pubs.usgs.gov/ds/575/downloads/appendix_4.xls.
Appendix 5. Concentrations of phytoestrogens, pharmaceuticals, and an antimicrobial in water samples and quality-assurance samples analyzed by the University of Colorado Center for Environmental Mass Spectrometry
The Excel spreadsheet appendix_5.xls contains concentration data for 10 phytoestrogens, 8 pharmaceuticals, and 1 antimi-crobial for which water samples in this study were analyzed. This spreadsheet contains separate worksheets for the analytical results of water samples collected from 73 sites during September–November 2009 (“Environmental” worksheet) and associ-ated quality-assurance samples (“Quality Assurance” worksheet). This Excel file can be accessed at http://pubs.usgs.gov/ds/575/downloads/appendix_5.xls.

Appendixes 1–12 53
Appendix 6. Concentrations of alkylphenols and other neutral organic chemicals in water and quality-assurance samples analyzed at the U.S. Geological Survey National Research Program Laboratory
The Excel spreadsheet appendix_6.xls contains concentration data for 23 alkylphenols, other neutral organic chemicals, and 5 surrogate standards for which water samples in this study were analyzed. This spreadsheet contains separate worksheets for the analytical results of water samples collected from 73 sites during September–November 2009 (“Environmental” worksheet) and associated quality-assurance samples (“Quality Assurance” worksheet). This Excel file can be accessed at http://pubs.usgs.gov/ds/575/downloads/appendix_6.xls.
Appendix 7. Concentrations of carboxylic acids in water and quality-assurance samples analyzed at the U.S. Geological Survey National Research Program Laboratory
The Excel spreadsheet appendix_7.xls contains concentration data for six chemicals and one surrogate standard for which water samples in this study were analyzed. This spreadsheet contains separate worksheets for the analytical results of water samples collected from 73 sites during September–November 2009 (“Environmental” worksheet) and associated quality-assurance samples (“Quality Assurance” worksheet). This Excel file can be accessed at http://pubs.usgs.gov/ds/575/downloads/appendix_7.xls.
Appendix 8. Concentrations of steroidal hormones in water and quality-assurance samples analyzed at the U.S. Geological Survey National Research Program Laboratory
The Excel spreadsheet appendix_8.xls contains concentration data for 20 chemicals and 13 surrogate standards for which water samples in this study were analyzed. This spreadsheet contains separate worksheets for the analytical results of water samples collected from 73 sites during September–November 2009 (“Environmental” worksheet) and associated quality-assurance samples (“Quality Assurance” worksheet). This Excel file can be accessed at http://pubs.usgs.gov/ds/575/downloads/appendix_8.xls.
Appendix 9. Concentrations of carbon and organic wastewater-indicator chemicals analyzed in bed-sediment samples and quality-assurance samples at the U.S. Geological Survey National Water Quality Laboratory
The Excel spreadsheet appendix_9.xls contains concentration data for 3 carbon types, 57 organic wastewater-indicator chemicals, and 3 surrogate standards for which bed-sediment samples in this study were analyzed. This spreadsheet contains separate worksheets for the analytical results of bed-sediment samples collected from 25 sites during September–October 2009 (“Environmental” worksheet) and associated quality-assurance samples (“Quality Assurance” worksheet). This Excel file can be accessed at http://pubs.usgs.gov/ds/575/downloads/appendix_9.xls.
Appendix 10. Concentrations of steroidal hormones and other chemicals analyzed in bed-sediment samples at the U.S. Geological Survey National Water Quality Laboratory
The Excel spreadsheet appendix_10.xls contains concentration data for 17 steroid hormones, 3 other chemicals,and 18 isotope dilution standards for which bed-sediment samples in this study were analyzed. This spreadsheet contains separate work-sheets for the analytical results of bed-sediment samples collected from 25 sites during September–October 2009 (“Environmen-tal” worksheet) and associated quality-assurance samples (“Quality Assurance” worksheet). This Excel file can be accessed at http://pubs.usgs.gov/ds/575/downloads/appendix_10.xls.

54 Endocrine Active Chemicals, Pharmaceuticals, and Other Chemicals of Concern in Selected Streams
Publishing support provided by: Rolla Publishing Service Center
For more information concerning this publication, contact:Director, USGS Minnesota Water Science Center2280 Woodale DriveMounds View, Minnesota 55112(763) 783-3100
Or visit the Minnesota Water Science Center Web site at: http://mn.water.usgs.gov/
Appendix 11. Total estrogenicity in water samples analyzed at University of St. Thomas Laboratory
The Excel spreadsheet appendix_11.xls contains total estrogenicity data for selected water samples in this study. The “Envi-ronmental” worksheet contains the analytical results of water samples collected from 73 sites during September–November 2009. This Excel file can be accessed at http://pubs.usgs.gov/ds/575/downloads/appendix_11.xls.
Appendix 12. Length, weight, body condition factor, and vitellogenin concentrations in caged fathead minnows analyzed at the St. Cloud State University Aquatic Toxicology Laboratory
The Excel spreadsheet appendix_12.xls contains analyses of length, weight, body condition factor, and vitellogenin concen-trations in samples of caged fathead minnows collected from 13 sites during September 2009. This Excel file can be accessed at http://pubs.usgs.gov/ds/575/downloads/appendix_12.xls.

Appendixes 1–12 55

Lee and others—Endocrine A
ctive Chemicals, Pharm
aceuticals, and Other Chem
icals of Concern in Selected Streams, M
innesota, 2009 —Data Series 575