preprint version using time-driven activity-based · pdf filetdabc starts estimating the cost...
TRANSCRIPT

Library Quarterly: Information, Community, Policy, vol. 84, no. 1, pp. 1–23. © 2014 by The University of Chicago. All rights
reserved.
Preprint version
USING TIME-DRIVEN ACTIVITY-BASED COSTING TO SUPPORT
LIBRARY MANAGEMENT DECISIONS: A CASE STUDY FOR
LENDING AND RETURNING PROCESSES
Lorena Siguenza-Guzman1,2, Alexandra Van den Abbeele3, Joos Vandewalle4, Henry
Verhaaren5 and Dirk Cattrysse1
1 Centre for Industrial Management Traffic & Infrastructure, KU Leuven (BELGIUM) 2 Faculty of Engineering, University of Cuenca (ECUADOR)
3 Faculty of Business and Economics, KU Leuven (BELGIUM) 4 Department of Electrical Engineering ESAT/SCD, KU Leuven (BELGIUM)
5 Biomedical Library, Faculty of Medicine and Health Sciences, Ghent University (BELGIUM) 5 Centre for Industrial Management, Katholieke Universiteit Leuven (BELGIUM)
[email protected], [email protected],
[email protected], [email protected],
Abstract
With the rapid increase in demand of new digital services, the high cost of
information, and the dramatic economic slowdown, libraries have been
pressured to improve their services at lower costs. To cope with these
conditions, library managers must improve their knowledge and understanding
of cost behavior, as well as be aware of the different costs involved in the
library. Time-Driven Activity-Based Costing (TDABC) is a cost management
technique that allows developing accurate cost information on a wide range of
activities. Few case studies have been implemented in libraries regarding very
specific processes such as inter-library loan and acquisition processes. More
research is still needed to determine whether TDABC is useful and feasible to
implement for a more extensive set of library activities. Through an analysis
performed at an academic library in Belgium, this document introduces TDABC
as a useful method for supporting lending and returning processes.

Using Time-Driven Activity-Based Costing to Support Library Management Decisions 2
Library Quarterly: Information, Community, Policy, vol. 84, no. 1, pp. 1–23. © 2014 by The University of Chicago. All rights
reserved.
USING TIME-DRIVEN ACTIVITY-BASED COSTING TO SUPPORT
LIBRARY MANAGEMENT DECISIONS: A CASE STUDY FOR
LENDING AND RETURNING PROCESSES1
Due to the recent economic crisis, the high cost of information, and the rising
demand of services and information resources, libraries have been required to
shift budgeting and spending priorities. As a consequence, several decisions
have been made, such as cutting collection budgets, eliminating budgets for
travel or conferences, freezing salaries, finding new ways to fund programs,
and moving from physical to digital collections (Sudarsan 2006, McKendrick
2011). This evolution has forced libraries to prioritize their spending and
minimize their costs, concentrating on key success factors such as cost
efficiency, quality and innovations (Novićević and Ljilja 1999; Blixrud 2003,
15).
Library managers in these difficult circumstances are required to
increase their understanding of library activities and their related costs in
order to justify resource requirements and the creation of new services or face
budget reductions. To do so, they must rely on valid information about the
library processes and cost estimations, as well as differentiate the kind of
“products” or “services” libraries provide to customers. For instance, there are
no tangible products in libraries (except for scanning and photocopying) and
the primary products are a wide range of services. Several studies on cost
analysis and resource allocation for library services have been developed over
the past forty years (Rouse 1975, Kaplan and Cooper 1998), in which
traditional costing systems have been mainly used (Kaplan and Cooper 1998).
1 As our case study was mainly performed in 2010, we wish to thank the KU Leuven Arenberg Campus Library staff at that period, especially to Ludo Holans (Head of the Library) and Christophe Nassen (Circulation responsible) for their big support and commitment during the data collection. Special thanks to the Flemish Interuniversity Council (VLIR), the University of Cuenca, and the National Secretariat of Higher Education, Science, Technology and Innovation of Ecuador (SENESCYT) for supporting this research project.

Using Time-Driven Activity-Based Costing to Support Library Management Decisions 3
Library Quarterly: Information, Community, Policy, vol. 84, no. 1, pp. 1–23. © 2014 by The University of Chicago. All rights
reserved.
This article introduces Time-Driven Activity-Based Costing (TDABC) as a
useful costing system for librarians and library managers who want to perform
a cost analysis in a simple and accurate manner. TDABC, which was initially
developed for manufacturing processes to overcome the difficulties presented
by traditional costing systems, is gaining special attention in academic libraries.
This is because TDABC is a fast, accurate, and easy-to-understand method that
only requires two parameters: the unit cost of supplying resource capacity and
an estimated time required to perform an activity (Kaplan and Anderson
2007b). By implementing TDABC in libraries, key benefits are provided, such as
the possibility of disaggregating values per activity to identify non-value added
activities; benchmarking different scenarios to adapt best practices for
performance improvement; and justifying decisions and choices such as staff
recruitment, training and new service development (Siguenza-Guzman et al.
2013). This investigation presents a case study of the Loan and Return
processes at the Arenberg Library of the Katholieke Universiteit Leuven (KU
Leuven) to illustrate the applicability of TDABC in academic libraries with
special attention to large-scale libraries. The remainder of this article is
organized as follows. The next section presents the theoretical background of
TDABC and its main characteristics and limitations. Then, the implementation
of TDABC in a case study is analyzed, identifying key benefits and deployment
limitations faced during the process. Finally, some conclusions and
recommendations for future work are given in the last section.
Theoretical background: TDABC
The most well-known costing system is the so-called traditional costing, which
consists of a single and static cost rate for allocating indirect costs of different
processes to cost objects such as products or services (Kaplan and Cooper
1998). It works well when used in specific scenarios, such as in stable
environments with small or fixed indirect costs, but it leads to inaccurate total
product cost estimations in more complex environments (Kaplan and Cooper
1998, Tse and Gong 2009). As a result of the current wide offering of library
Using Time-Driven Activity-Based Costing to Support Library Management Decisions 4
Library Quarterly: Information, Community, Policy, vol. 84, no. 1, pp. 1–23. © 2014 by The University of Chicago. All rights
reserved.
products and services, these inaccuracies become critical in the ability to
accurately describe the complexity of the cost structure (Tse and Gong 2009).
Activity-Based Costing (ABC) is an alternative costing technique
specially promoted by Robert S. Kaplan and Robin Cooper (1988) in the mid-
1980s. In the case of libraries, ABC performs a more accurate and efficient
treatment of activity costs compared to traditional costing due to its accuracy in
allocating indirect costs to different activities (Ellis-Newman, Izan, and
Robinson 1996; Ellis-Newman and Robinson 1998; Goddard and Ooi 1998;
Ellis-Newman 2003; Ching et al. 2008; Novak, Paulos, and Clair 2011).
However, in practice, ABC is time consuming and costly, which is mainly a
result of data collection performed by means of interviews (Kaplan and
Anderson 2004). As a consequence, several companies have ceased updating
their systems, and in some cases they have substituted more efficient
approaches such as TDABC (Yilmaz 2008, 8; Wegmann and Nozile 2009).
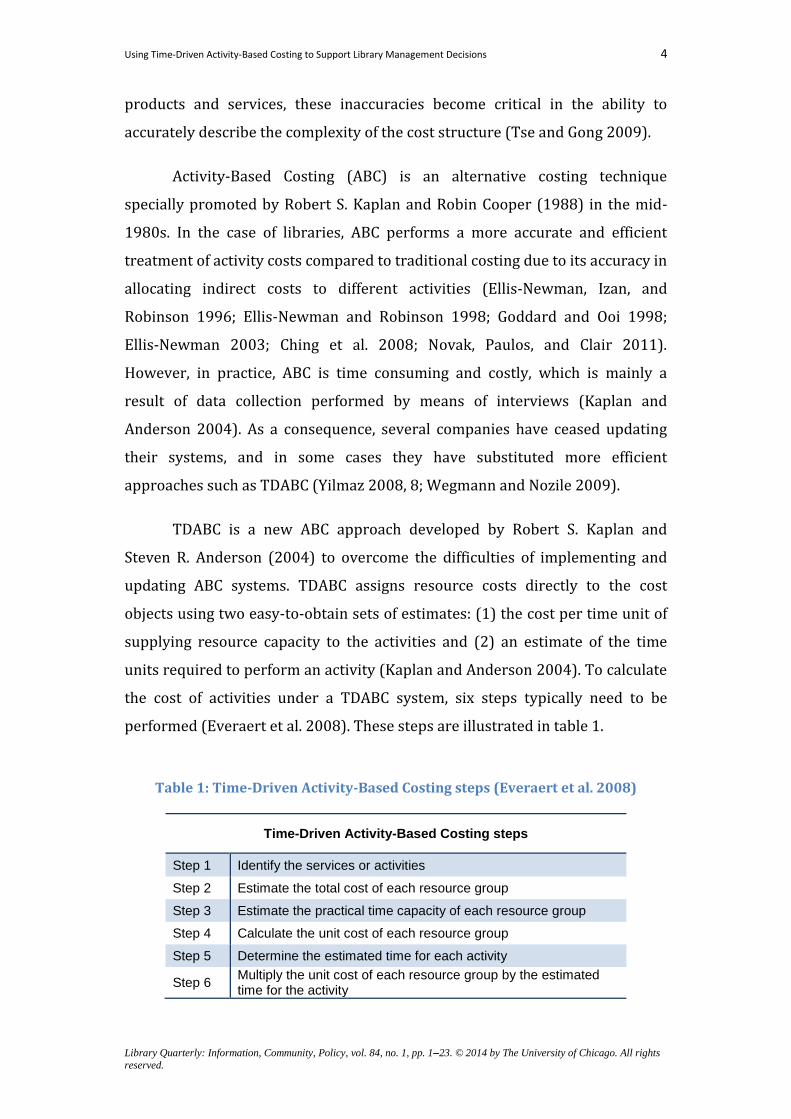
TDABC is a new ABC approach developed by Robert S. Kaplan and
Steven R. Anderson (2004) to overcome the difficulties of implementing and
updating ABC systems. TDABC assigns resource costs directly to the cost
objects using two easy-to-obtain sets of estimates: (1) the cost per time unit of
supplying resource capacity to the activities and (2) an estimate of the time
units required to perform an activity (Kaplan and Anderson 2004). To calculate
the cost of activities under a TDABC system, six steps typically need to be
performed (Everaert et al. 2008). These steps are illustrated in table 1.
Table 1: Time-Driven Activity-Based Costing steps (Everaert et al. 2008)
Time-Driven Activity-Based Costing steps
Step 1 Identify the services or activities
Step 2 Estimate the total cost of each resource group
Step 3 Estimate the practical time capacity of each resource group
Step 4 Calculate the unit cost of each resource group
Step 5 Determine the estimated time for each activity
Step 6 Multiply the unit cost of each resource group by the estimated time for the activity

Using Time-Driven Activity-Based Costing to Support Library Management Decisions 5
Library Quarterly: Information, Community, Policy, vol. 84, no. 1, pp. 1–23. © 2014 by The University of Chicago. All rights
reserved.
TDABC starts estimating the cost of supplying capacity by identifying the
different services or activities, their cost and their practical capacity. Then, the
unit cost of each resource group is gathered by dividing the total cost by the
practical capacity. The total cost of supplying resource capacity is defined as the
cost of all the resources supplied to this department or process (e.g., staff,
supervision, occupancy, equipment, technology, and infrastructure). Practical
capacity is defined as the amount of time that employees work without idle
time (Kaplan and Anderson 2007a). There are two ways to estimate practical
time capacity: (1) assuming an 80 percent of theoretical capacity for people
(excluding breaks, arrival and departure, communication, training, meetings,
chitchat, etc.), and an 85 percent capacity for machines (excluding maintenance,
repair, and scheduling fluctuations); and (2) calculating the real values adjusted
for the institution (e.g., available working hours, excluding holidays, meeting
and training hours; Kaplan and Anderson 2007b).
Once the cost of supplying capacity has been calculated, the estimated
time for each activity is determined. This value can be obtained through
interviews with employees or by direct observation; no additional surveys are
required. Authors argue that precision is not critical, that a rough accuracy is
sufficient because gross inaccuracies will be revealed either in unexpected
surpluses or shortages of committed resources (Kaplan and Anderson 2007b).
Unlike ABC, this value refers to the time that an employee spends doing an
activity and not the percentage of time that it takes to complete one unit of that
activity. In addition, through a simple time equation, it is possible to represent
all possible combinations of activities (e.g., different types of products do not
necessarily require the same amount of time to be produced). For each activity,
costing equations are calculated based on the time required to perform an
activity (Yilmaz 2008). This time is computed by time equations, which are the
sum of individual activity times. Using these equations, it is possible to combine
all the activities involved into one process with only one time equation. They
are represented with the following expression (Kaplan and Anderson 2007b):
𝑇𝑖𝑚𝑒 𝑟𝑒𝑞𝑢𝑖𝑟𝑒𝑑 𝑡𝑜 𝑝𝑒𝑟𝑓𝑜𝑟𝑚 𝑎𝑛 𝑎𝑐𝑡𝑖𝑣𝑖𝑡𝑦
= (𝛽0 + 𝛽1𝑋1 + 𝛽2𝑋2 + 𝛽3𝑋3 + 𝛽4𝑋4 + 𝛽5𝑋5 + ⋯ + 𝛽𝑖𝑋𝑖)

Using Time-Driven Activity-Based Costing to Support Library Management Decisions 6
Library Quarterly: Information, Community, Policy, vol. 84, no. 1, pp. 1–23. © 2014 by The University of Chicago. All rights
reserved.
Where 𝛽0 is the standard time to perform the basic activity (e.g., 5
minutes), 𝛽1 is the estimated time for the incremental activity 𝑖 (e.g. time
required for the hand-in-robot to allocate the item in the correct box = 0.5
minutes), and 𝑋𝑖 is the quantity of incremental activity 𝑖 (e.g., number of items
per loan = 2). Finally, costs are assigned to the cost object by multiplying the
cost per time unit of the resources by the estimate of the time required for
performing the activities.
TDABC in libraries
Little is known about applying TDABC in libraries. The first TDABC approach,
given by Eli Pernot, Filip Roodhooft, and Alexandra Van den Abbeele (2007),
uses TDABC for calculating interlibrary loan (ILL) costs. The paper offers a
useful technique to reduce ILL resource costs or renegotiate ILL service prices.
The authors conclude that TDABC could reduce the cost management of all
library services because librarians can take appropriate actions to decrease the
time needed for specific customer’s requests. On the other hand, Kristof
Stouthuysen and colleagues (2010) focus their analysis on the acquisition
process. They describe TDABC as a useful system for small- to medium-size
academic libraries. The authors define TDABC as a costing system that assists
library managers in visualizing the acquisition process efficiencies and capacity
utilization, leading to potential cost efficiencies. They also state that the study
can be applied to complex or digitalized acquisition environments. These initial
investigations show promising possibilities of using TDABC to provide accurate
information on library activities. However, these studies have been applied to
very specific settings, studying only particular processes with cases in small-
and medium-size academic libraries. More research is still needed to identify
whether the technique of TDABC is useful and feasible to implement for a more
extensive set of library activities. In this context, the main objective of this
article is to study whether TDABC can support loan and return processes in a
large academic library.

Using Time-Driven Activity-Based Costing to Support Library Management Decisions 7
Library Quarterly: Information, Community, Policy, vol. 84, no. 1, pp. 1–23. © 2014 by The University of Chicago. All rights
reserved.
Case Study of Loan and Return Processes
A case study using TDABC was performed in the Circulation Department at the
Arenberg Campus Library (CBA - Campusbibliotheek Arenberg) of the KU
Leuven in Belgium. We focus on this unit because it is considered one of the
most important departments of the library. Although nowadays digital libraries
are becoming stronger, physical processes such as loan and return processes
are still considered crucial activities within libraries because, as McKendrick
(2011, 4) states: “print still commands a lion’s share of annual budgets.” The
Circulation Department involves all the services related to lending processes,
such as loaning, returning, reserving, renewing, paying fines, and providing
basic reference services.
CBA is operated by approximately 20.5 full-time-equivalent employees
(FTE), who give support to about 10,000 potential customers (Dekeyser and
Holans 2003). To improve its cost efficiency, CBA has been obliged to use new
technologies and to automate repetitive processes. In the case of the Circulation
Department, the library has implemented lending and returning robots
(lending robots named "chicos," as in "check in, check out"). With each chico
robot, customers can borrow or return the items without any assistance.
Alternatively, customers can also return the materials with a “hand-in-robot”
that allows the return of items during hours the library is open without
entering the library. The technology used for interacting with the robots and
tagging the items is a Radio Frequency IDentification (RFID) system. Because of
this interesting automation to improve cost efficiency, the processes of lending
and returning have been selected to understand whether the decisions made at
that time were the most appropriate. In the next sections, we illustrate the
implementation of TDABC in the loaning and returning processes at CBA by
applying six steps identified by Patricia Everaert and colleagues (2008).

Using Time-Driven Activity-Based Costing to Support Library Management Decisions 8
Library Quarterly: Information, Community, Policy, vol. 84, no. 1, pp. 1–23. © 2014 by The University of Chicago. All rights
reserved.
Step 1: Identifying the services or activities
The first step is to identify the main activities of the Circulation Department
and the role that each staff member has in these activities. In order to do this, a
round of interviews with the head of the library and the main desk staff (i.e.,
people in charge of those processes) was conducted.
Three main activities in the Circulation Department, WBIB lending
(Wetenschappelijke BIBliotheek – scientific library), WMAG lending
(Wetenschappelijke MAGazijn – scientific warehouse), and returning, were
identified. Lending is the process of allowing users to borrow one or more
items temporarily from the library. In the case of the CBA, the lending
processes can be triggered with two types of materials: (1) WBIB items, which
are bibliographic material (e.g., books or journals) located in open shelves, are
directly available for customers without any assistance from the librarian. (2)
WMAG items are only accessible to the library staff, because they are stored in
compact shelves located in the basement. When a customer needs items from
this repository, an online request must be filled. Returning is the process
wherein customers return borrowed items to the library.
A second round of interviews was performed to obtain specific details
about the different sub-activities of each process. This additional information
was used to build flow charts of the activity sequences in the processes. It is
important to remark that the least accurate flow occurred when superiors
provided descriptions or when librarians presented a printed report of their
estimations, which supports the findings of Eddy Cardinaels and Eva Labro
(2008).
MS Visio and MS Excel were used to create a graphical representation of
the tabular information. In each of the following figures, the beginning of each
process is represented by a closed circle . Each figure is divided by horizontal
lines to represent each of the actors involved in the process (e.g., customer,
closed-stack responsible, main desk). These lines allow one to easily identify
the different actors and resources involved in every specific activity. A diamond

Using Time-Driven Activity-Based Costing to Support Library Management Decisions 9
Library Quarterly: Information, Community, Policy, vol. 84, no. 1, pp. 1–23. © 2014 by The University of Chicago. All rights
reserved.
depicts the different options that a process has in a specific moment, such as
the two possibilities to bring an item from the closed stack if it is an evening or
a day shift. The rounded rectangles Average
Time (min)0.11
€ 0.03
Print the receipt
represent the different activities, the
average time consumed as well as its inquired cost. The end of a process is
represented by the symbol .
In the case of WBIB items (fig. 1), the customer and the main desk are
the two actors involved. The process starts when a customer consults the
catalogue to get an item. It is possible to find the physical place of the item by
using the locator (i.e., a web system helps to locate library items); otherwise,
the customer can go directly to the corresponding shelf. If the customer decides
to borrow the item(s), the customer then puts them on the chico robot. If the
customer has outstanding fines, the transaction is not performed until the fine
is paid through an electronic transaction or in cash at the main desk. Finally, the
customer can also print a receipt, which includes the details of the borrowed
items.
Figure 1: WBIB Lending Process

Using Time-Driven Activity-Based Costing to Support Library Management Decisions 10
Library Quarterly: Information, Community, Policy, vol. 84, no. 1, pp. 1–23. © 2014 by The University of Chicago. All rights
reserved.
In the WMAG Lending Process (fig. 2), four actors are involved: the
customer, the main desk, a student library employee (SLE, i.e., a student hired
to perform reshelving and classification activities), and the closed stack
responsible. This process starts similarly to the previous one. However, in this
case, the locator does not appear because it is not an open-shelf item. The
customer requests the item online and receives it from the main desk. CBA has
two kinds of staff shifts. In the mornings, a librarian works in the closed stack
section and is responsible for sending the item to the main desk. During the
evenings, the closed stack area is closed. Hence, an SLE goes to the closed stack
and brings the item to the main desk. In any case, employees will ensure that
the item is tagged (RFID system) before giving it to the customer. At this
moment, the customer has two alternatives: (1) he or she can borrow the item,
which results in the same procedure as the WBIB Lending, or (2) he or she can
return the item, in which case the librarian deletes the request. If the item has
also been requested by another customer, the librarian sends an e-mail
message to the other customer, prints the request, and puts the item on a
special shelf. Otherwise, if there is not a request for the item, the librarian
returns the item to the closed stack in order to be reshelved.
The Returning Process (fig. 3) is triggered by the customer returning the
item. In this process, two actors are involved: the customer and an SLE. The
customer has two possibilities of returning: (1) He or she can return the item
by the chico robot and print the receipt as proof of the returning. The robot has
a plate where the customer puts on the borrowed items in order to make them
recognizable for the computer. The customer can place a maximum of five
items on the plate at one time. (2) He or she can return the item by hand in the
robot and print the receipt. Using this machine, the customer is required to put
the items one by one.
In the first case, during the evenings an SLE goes to the hand-in-robot
with the book truck and returns the items. The objective of this activity is to
accelerate the items’ classification by the corresponding cluster (i.e., book
collection divisions). In the second case, this activity is not necessary because
the items are already sorted when the customer puts the items in the hand-in-

Using Time-Driven Activity-Based Costing to Support Library Management Decisions 11
Library Quarterly: Information, Community, Policy, vol. 84, no. 1, pp. 1–23. © 2014 by The University of Chicago. All rights
reserved.
robot. In any case, once the items have been classified by the hand-in-robot, an
SLE will sort the items in the cluster; and then reshelf the items.
Figure 2: WMAG Lending Process

Using Time-Driven Activity-Based Costing to Support Library Management Decisions 12
Library Quarterly: Information, Community, Policy, vol. 84, no. 1, pp. 1–23. © 2014 by The University of Chicago. All rights
reserved.
Figure 3: Returning Process
Step 2: Estimating the total cost of each resource group
The total cost for the processes of lending and returning consists of four main direct
costs: staff costs, machines costs, library management systems (LMS) costs and SLE
costs. Due to differences in the staff salaries performing the activities, the average
salary is used for the staff cost. Each salary is calculated by the monthly gross salary
plus the social security contribution. This represents the full cost of an
employee. According to the head of the library, the total number of personnel
assigned to the three processes represents 1.5 FTE. This value corresponds to
several people working different percentages of their time as a comparable
number to full-time employees. It corresponds to about € 4,110 on a monthly
basis.
The cost of an SLE is about € 441.37 monthly. The head of the library
reported having an average of five students per month, each working forty
hours (total job students = 5 × 40h
m= 200
h
m). If we want to report the equivalence in
FTE, we should consider that a staff member works thirty-eight hours/week
(equals one FTE). If we assume four weeks per month, the corresponding FTE
for SLE is 1.32 (FTE = 200h
m÷ (38
h
w × 4
w
m) = 1.32 FTE), equivalent to € 582.60
monthly.

Using Time-Driven Activity-Based Costing to Support Library Management Decisions 13
Library Quarterly: Information, Community, Policy, vol. 84, no. 1, pp. 1–23. © 2014 by The University of Chicago. All rights
reserved.
Loans and returns are mainly done by machines and the yearly cost
associated with their maintenance, repair and inspection is about € 30,400
(including VAT [value added tax]). The value includes the costs associated with
the maintenance of the RFID robots (chico and hand-in-robot) and the gate
antennas (security). The yearly cost incurred with LMS is about € 17,050.
Based on the library accounting reports, there are two main types of
indirect costs: (1) € 3,000 for machine overhead costs on a yearly basis (e.g.,
computer supplies, hardware, software) and (2) € 191,060 for staff overhead
costs on a yearly basis (e.g., management, secretary, accounting, training,
meetings staff, stationery material).2 Because staff and SLE are associated with
the second overhead, this cost is divided by the total number of FTE
(FTE staff + FTE job student = 20.5 + 1.32 = 21.82), resulting in a yearly overhead of €
8,756 per FTE (€ 730 per month).
Step 3: Estimating the practical time capacity of each resource group
There are two ways to get the value of the practical time capacity of each
resource group: (1) a percentage of the theoretical capacity, assuming the
practical full capacity is about 80 percent for people and 85 percent for
machines; and (2) calculating or counting the real values according to the
library situation (Kaplan and Anderson 2007b). In order to simplify the study,
the first option has been selected.
In the case of the machines and LMS, the practical capacity is set equal
to the time that library is open, that is, for weekdays from 9 a.m. until 10 p.m.
and for Saturdays from 9 a.m. until 1 p.m. (Dekeyser and Holans 2003). This
means that on a theoretical basis machines and LMS are available during sixty-
nine hours per week. Assuming fifty-two weeks per year, the practical capacity
for machines and LMS is 182,988 minutes/year (85% × 69ℎ𝑜𝑢𝑟𝑠
𝑤𝑒𝑒𝑘× 60
𝑚𝑖𝑛
ℎ𝑜𝑢𝑟×
52𝑤𝑒𝑒𝑘𝑠
𝑦𝑒𝑎𝑟).
2 There are certain values that are not required to be included as indirect costs because they are
paid by the university and not charged to the library (e.g., electricity, heating, transportation, telephone; Ellis-Newman and Robinson 1998).

Using Time-Driven Activity-Based Costing to Support Library Management Decisions 14
Library Quarterly: Information, Community, Policy, vol. 84, no. 1, pp. 1–23. © 2014 by The University of Chicago. All rights
reserved.
For staff capacity, thirty-eight hours per week are accounted for the
theoretical capacity. This results in 7,296 minutes/month (80% × 38ℎ𝑜𝑢𝑟𝑠
𝑤𝑒𝑒𝑘 ×
4𝑤𝑒𝑒𝑘𝑠
𝑚𝑜𝑛𝑡ℎ× 60
𝑚𝑖𝑛
ℎ𝑜𝑢𝑟). Considering 1.5 FTE for the lending and returning processes,
the practical capacity for staff is 10,944 min/month.
Finally, regarding the SLE capacity, the theoretical capacity is forty
hours/month (according to regulations by the law); the practical capacity for
each SLE is 1,920 minutes/month (80% × 40ℎ𝑜𝑢𝑟𝑠
𝑚𝑜𝑛𝑡ℎ× 60
𝑚𝑖𝑛
ℎ𝑜𝑢𝑟). Considering 1.32
FTE for SLE, the practical capacity is 2,534.4 minutes/month.
Step 4: Calculate the unit cost of each resource group
The cost per unit time is calculated by dividing the total cost of the resource
(step 2) by the practical capacity (step 3). The machine overhead is added to
the machines costs and LMS, and the staff overhead is added to the staff and the
SLE costs. The resulting costs are presented in table 2.
Table 2: Unit cost per resource group
Unit cost per resource group
Cost Type Calculations
Cost per
Minute
(€/min)
Machines costs = (€ 30,400/182,988) + (€ 3,000/182,988)
= 0,17 + 0,01 0.18
Library Management System
= (€ 17,045/182,988) + (€ 3,000/182,988)= 0,09 + 0,01
0.10
Staff labor costs = (€ 4,110/10,944) + (€ 730/10,944)
= 0.38 + 0,07 0.45
SLE costs = (€ 582,60/2,534.4) + (€ 730/10,944)
= 0.23 + 0.07 0.30
Step 5: Determine the time estimation for each activity
The required time to perform an activity was gathered through direct
observation. The data collection was conducted multiple times using a

Using Time-Driven Activity-Based Costing to Support Library Management Decisions 15
Library Quarterly: Information, Community, Policy, vol. 84, no. 1, pp. 1–23. © 2014 by The University of Chicago. All rights
reserved.
stopwatch during several days at different hours in the first semester of 2010,
and the results were validated through a second data collection in the following
semester in order to avoid possible biases. Since we made a large number of
observations, the average time of each activity was taken as reference to
facilitate the calculations.
WBIB Lending Process
A customer consults the catalogue to get an item (1.36 minutes), and then the
physical place of the item can be identified by using the locator (0.83 minute). If
the customer decides to borrow the item(s), the customer puts it (them) on the
chico robot (0.38 minute). In case the customer has outstanding fines, the
transaction cannot be performed until the fine is paid by an electronic
transaction (0.71 minute) or in cash (0.84 minute) at the main desk. In any
case, the librarian will ask for the student card to check on the system the value
to be paid (0.46 minute), and will give a receipt to the customer as proof of
payment (0.62 minute). Finally, if the customer desires, he or she can also print
the borrow register (0.11 minute). The resulting equation is as follows:
𝑾𝑩𝑰𝑩 𝑳𝒆𝒏𝒅𝒊𝒏𝒈 𝑷𝒓𝒐𝒄𝒆𝒔𝒔
= 1.36 × (𝑛𝑢𝑚𝑏𝑒𝑟 𝑜𝑓 𝑖𝑡𝑒𝑚𝑠) + 0.83 × (𝑛𝑢𝑚𝑏𝑒𝑟 𝑜𝑓 𝑖𝑡𝑒𝑚𝑠) {𝑖𝑓 𝑙𝑜𝑐𝑎𝑡𝑜𝑟}
+ 0.38 + [(1.08 + 0.71{𝑖𝑓 𝑒𝑙𝑒𝑐𝑡𝑟𝑜𝑛𝑖𝑐} + 0.84{𝑖𝑓 𝑐𝑎𝑠ℎ}){𝑖𝑓 𝑓𝑖𝑛𝑒𝑠}]
+ 0.11{𝑖𝑓 𝑝𝑟𝑖𝑛𝑡 𝑟𝑒𝑐𝑒𝑖𝑝𝑡}
(1)
There are certain parameters that can influence the formula (e.g. if the
customer uses the locator or goes directly to the shelf). These situations are
represented by dummy variables (Boolean values; Everaert and Bruggeman
2007). The dummy variable is zero when the optional activity is not used in a
specific situation. Otherwise, the dummy is one when the activity is part of a
particular process. In equation (1), dummy variables are
{𝑖𝑓 𝑙𝑜𝑐𝑎𝑡𝑜𝑟}, {𝑖𝑓 𝑒𝑙𝑒𝑐𝑡𝑟𝑜𝑛𝑖𝑐}, {𝑖𝑓 𝑐𝑎𝑠h}, {𝑖𝑓 𝑓𝑖𝑛𝑒𝑠}, and {𝑖𝑓 𝑝𝑟𝑖𝑛𝑡 𝑟𝑒𝑐𝑒𝑖𝑝𝑡}.

Using Time-Driven Activity-Based Costing to Support Library Management Decisions 16
Library Quarterly: Information, Community, Policy, vol. 84, no. 1, pp. 1–23. © 2014 by The University of Chicago. All rights
reserved.
WMAG Lending Process
The WMAG Lending Process starts similarly to that shown in equation (1) (1.36
minutes). Subsequently, the customer requests the item (0.68 minute) which is
automatically printed by the main desk (2.00 minutes). In the morning shift, the
printed request is sent to the closed stack by the lift (0.30 minute), the closed
stack responsible gets the item from the stack (1.00 minute) and sends it back
to main desk (0.30 minute). In the evening shift, an SLE goes from the main
desk to the closed stack (0.50 minute), gets the item (1.07 minutes) and carries
it to the main desk (0.50 minute). If the item is not tagged, the employee will tag
it (0.67 minute) and then give it to the customer (0.17 minute). An individual
tag costs € 0.30, including VAT.
Then the customer has two alternatives: (1) Borrow the item: put the
item on the chico robot and perform the borrowing procedure (0.38 minute).
The transaction will not be made unless all outstanding fines are paid, similarly
to equation (1). The process finishes by printing the receipt as a proof to the
lending (0.11 minute). (2) Return the item: the librarian deletes the request
(0.32 minute). If the item has another request, the librarian sends an email
message to the customer (0.42 minute), prints the request (0.41 minute), and
puts the item in a special shelf (0.35 minute). Otherwise, the librarian returns
the item to the closed stack (0.35 minute) for it to be reshelved (0.53 minute).
𝑾𝑴𝑨𝑮 𝑳𝒆𝒏𝒅𝒊𝒏𝒈 𝑷𝒓𝒐𝒄𝒆𝒔𝒔 =
1.36 × (number of items) + 0.68 × (number of items) + 2.00 +
(0.30 + 1.00 × (number of items) + 0.30){𝑖𝑓 𝑚𝑜𝑟𝑛𝑖𝑛𝑔 𝑠ℎ𝑖𝑓𝑡} +
(0.50 + 1.07 × (number of items) + 0.50){𝑖𝑓 𝑒𝑣𝑒𝑛𝑖𝑛𝑔 𝑠ℎ𝑖𝑓𝑡} + 0.67 ×
(number of items){𝑖𝑓 𝑛𝑜𝑡 𝑡𝑎𝑔𝑔𝑒𝑑} + 0.17 +
(0.38 + [(1.08 + 0.84 {𝑖𝑓 𝑒𝑙𝑒𝑐𝑡𝑟𝑜𝑛𝑖𝑐 } + 0.71 {𝑖𝑓 𝑐𝑎𝑠ℎ}){𝑖𝑓 𝑓𝑖𝑛𝑒𝑠}] +
0.11{𝑖𝑓 𝑝𝑟𝑖𝑛𝑡 𝑟𝑒𝑐𝑒𝑖𝑝𝑡}){𝑖𝑓 𝑏𝑜𝑟𝑟𝑜𝑤} +
[0.32 + (0.42 + 0.41 + 0.35){𝑖𝑓 𝑠𝑡𝑖𝑙𝑙 𝑟𝑒𝑞𝑢𝑒𝑠𝑡𝑒𝑑} + (0.20 + 0.15 + 0.18 +
0.35){𝑖𝑓 𝑛𝑜𝑡 𝑛𝑒𝑤 𝑟𝑒𝑞𝑢𝑒𝑠𝑡}] × (number of items){𝑖𝑓 𝑢𝑛𝑏𝑜𝑟𝑟𝑜𝑤}
(2)

Using Time-Driven Activity-Based Costing to Support Library Management Decisions 17
Library Quarterly: Information, Community, Policy, vol. 84, no. 1, pp. 1–23. © 2014 by The University of Chicago. All rights
reserved.
Returning Process
There are two options to return item(s): (1) by the chico robot (0.38 minute),
printing the receipt as a proof to the return (0.11 minute), and leaving the item
in the book truck, or (2) by the hand-in-robot (0.08 minute) and printing the
receipt (0.11 minute). In the first case, during the evenings, an SLE goes to the
hand-in-robot with the book truck (0.03 minute) and returns every item (0.08
minute). In both cases, the hand-in-robot will classify the items by the
corresponding cluster, and an SLE will sort the items in the cluster (0.17
minute) and then reshelf the items (0.35 minute). The last two values are
calculated using an average batch of items that an SLE classifies per cluster.
𝑹𝒆𝒕𝒖𝒓𝒏𝒊𝒏𝒈 𝑷𝒓𝒐𝒄𝒆𝒔𝒔 =
0.38{𝑖𝑓 𝑐ℎ𝑖𝑐𝑜 𝑟𝑜𝑏𝑜𝑡} + 0.08(number of items){𝑖𝑓 ℎ𝑎𝑛𝑑 𝑖𝑛 𝑟𝑜𝑏𝑜𝑡} +
0.11{𝑖𝑓 𝑝𝑟𝑖𝑛𝑡 𝑟𝑒𝑐𝑒𝑖𝑝𝑡} +
[0.03 + 0.08 × (number of items)]{𝑖𝑓 𝑐ℎ𝑖𝑐𝑜′𝑠 𝑟𝑜𝑏𝑜𝑡} + (0.17 + 0.35) ×
(number of items)
(3)
Step 6: Multiply the unit cost of each resource group by the time estimate for the
activity
Eventually, a cost table is built by multiplying the unit cost per time and the
time needed for the activity. Tables 3-5 present the costs incurred in each
activity. The first column in each of these tables lists the activities identified in
the process, and the second column shows the average time for each event. The
third column indicates the accumulated costs of each resource group, and the
fourth column calculates the resulting cost incurred in the activity. The fifth
column describes the dummy variable conditioning the activity, and the sixth
column includes the resource group involved in each activity. Each table is
divided by standard and optional activities to separate the values influenced by
the dummy variables.

Using Time-Driven Activity-Based Costing to Support Library Management Decisions 18
Library Quarterly: Information, Community, Policy, vol. 84, no. 1, pp. 1–23. © 2014 by The University of Chicago. All rights
reserved.
Table 3: WBIB Lending Process Cost Table
WBIB Lending Process
Sta
nd
ard
A
cti
vit
ies
Activity Average
Time (min)
Cost (€/min)
Cost (€) Dummy Variable Resources #
Consult the catalogue 1.36 0.10 0.14
LMS a
Use chico robot 0.38 0.28 0.11
Chico robot + LMS b
Subtotal 1.74
0.25
Op
tio
nal
Acti
vit
ies
Use the locator 0.83 0.10 0.08 if locator LMS c
Print the receipt 0.11 0.28 0.03 if print receipt Chico robot + LMS d
Ask for the student card 0.16 0.45 0.07 if fines Main desk e
Check on the system 0.30 0.55 0.17 if fines Main desk + LMS f
Pay it 0.43 0.45 0.19 if fines, if cash Main desk g
Fill Cash Register 0.41 0.55 0.23 if fines, if cash Main desk + LMS h
Bank contact transaction 0.47 0.45 0.21 if fines, if electronic Main desk i
Fill Electronic Cash Register 0.24 0.55 0.13 if fines, if electronic Main desk + LMS j
Give receipt 0.62 0.55 0.34 if fines Main desk + LMS k
Subtotal ---
---
TOTAL ---
---
(A)
(B)
(C)
Table 4: WMAG Lending Process Cost Table
WMAG Lending Process
Sta
nd
ard
Acti
vit
ies
Activity Average
Time (min)
Cost (€/min)
Cost (€) Dummy Variable Resources
Consult the catalogue 1.36 0.10 0.14 LMS
Fill the request form 0.68 0.10 0.07
LMS
Print the request form 2.00 0.55 1.10
Main desk + LMS
Get the item from main desk 0.17 0.45 0.08
Main desk
Use chico robot 0.38 0.28 0.11
Chico robot + LMS
Subtotal 4.59
1.49

Using Time-Driven Activity-Based Costing to Support Library Management Decisions 19
Library Quarterly: Information, Community, Policy, vol. 84, no. 1, pp. 1–23. © 2014 by The University of Chicago. All rights
reserved.
Op
tio
nal
Acti
vit
ies
Get the item from stack 1.60 0.45 0.72 if morning shift Closed stack resp.
Get the item from stack 2.07 0.30 0.62 if evening shift SLE
Tag the item 0.67 1.03* 0.69 If not tagged Main desk + LMS + machines + tags*
Print the receipt 0.11 0.28 0.03 if borrow Chico robot + LMS
Ask for the student card 0.16 0.45 0.07 if fines Main desk
Check on the system 0.30 0.55 0.17 if fines Main desk + LMS
Pay it 0.43 0.45 0.19 if fines, if cash Main desk
Fill Cash Register 0.41 0.55 0.23 if fines, if cash Main desk + LMS
Bank contact transaction 0.47 0.45 0.21 if fines, if electronic Main desk
Fill Electronic Cash Register 0.24 0.55 0.13 if fines, if electronic Main desk + LMS
Give the receipt 0.62 0.55 0.34 if fines Main desk + LMS
Delete the Request 0.32 0.55 0.18 If un-borrow Main desk + LMS
Return the item to the closed stack
0.53 0.45 0.24 If un-borrow, if not new request
Closed stack resp.
Shelve the item 0.35 0.30 0.11 If un-borrow, if not new request
SLE
Send an email to the customer / Print the request
0.83 0.55 0.43 If un-borrow, if still requested
Main desk + LMS
Put item in a special shelf 0.35 0.45 0.16 If un-borrow, if still requested
Main desk
Subtotal ---
---
TOTAL ---
---
* € 1.03 = main desk + LMS + machines + tags = 0.45 + 0.10 + 0.18 + 0.30 (individual tag costs)
Table 5: Returning Process Cost Table
Returning Process
Sta
nd
ard
Acti
vit
ies Activity
Average Time (min)
Cost (€/min)
Cost (€) Dummy Variable Resources
Shelve the item 0.35 0.30 0.11
SLE
Subtotal 0.35
0.11
Op
tio
nal
Acti
vit
ies
Return item to chico robot 0.38 0.28 0.11 if chico robot Chico robot + LMS
Print the receipt 0.11 0.28 0.03 if chico robot or if hand-in-robot
Machines + LMS
Return item to the hand-in-robot
0.08 0.28 0.02 if hand-in-robot Machines + LMS
Go to the hand-in-robot 0.03 0.30 0.01 if book truck SLE
Return item to the hand-in-robot
0.08 0.58 0.05 if book truck SLE + Machines + LMS
Classify the item 0.17 0.30 0.05 if book truck SLE
Subtotal ---
---
TOTAL ---
---

Using Time-Driven Activity-Based Costing to Support Library Management Decisions 20
Library Quarterly: Information, Community, Policy, vol. 84, no. 1, pp. 1–23. © 2014 by The University of Chicago. All rights
reserved.
To calculate the total cost of a sub-process, one first identifies the
different activities that appear in this specific situation. The fifth column of the
costing tables that contains the dummy variables helps us to identify which
optional activities are going to be used for the calculation. In the bottom part of
table 3, three different examples of sub-processes are included to illustrate how
the total cost is calculated. Case A represents the most common situation of a
customer taking the item from the shelf, borrowing it, and finally printing the
receipt. Case B and C correspond to a customer who is trying to borrow an item,
but first he has to pay a fine of previous transactions. In case B, the customer
pays the fine through an electronic transaction, whereas in case C he pays the
fine in cash.
Based on these costing tables a costing analysis process, by means of a
what-if analysis, can be performed. For instance, it is possible to analyze the
cost of returning three items through all possible cases: (1) by the chico robot,
(2) by the hand-in-robot, and (3) manually with the assistance of a librarian.
If a customer returns the items through the chico robot, this value (0.38
minute) is not multiplied by the number of items because these machines allow
the customer to return up to five items at the same time on the plate. Then a
receipt could be printed as proof or returning (0.11 minute). Those values are
multiplied by the cost that represents the maintenance of the machines (€ 0.18)
and LMS (€ 0.10). Table 6 provides an overview of this example.
Table 6: Returning Process through the chico robot
Returning Process through the chico robot
Acti
vit
ies
Activity Average
Time (min)
Cost (€/min)
Cost (€) Resources
Shelve the item 0.35*3 0.30 0.32 SLE
Return item to chico robot 0.38 0.28 0.11 Chico robot + LMS
Print the receipt 0.11 0.28 0.03 Machines + LMS
Go to the hand-in-robot 0.03*3 0.30 0.03 SLE
Return item to the hand-in-robot 0.08*3 0.58 0.14 SLE + Machines + LMS
Classify the item 0.17*3 0.30 0.15 SLE
TOTAL 2.38
0.78

Using Time-Driven Activity-Based Costing to Support Library Management Decisions 21
Library Quarterly: Information, Community, Policy, vol. 84, no. 1, pp. 1–23. © 2014 by The University of Chicago. All rights
reserved.
If the items are returned by the hand-in-robot, the customer is required
to place the items one by one onto the machine. In this case, that time value
(0.08 minute) is multiplied by the number of items the customer returns. The
final receipt will be only one, even if the customer returns many more items.
The results can be seen in table 7.
Table 1: Returning Process through the hand-in-robot
Returning Process through the hand-in-robot
Acti
vit
ies
Activity Average
Time (min)
Cost (€/min)
Cost (€) Resources
Shelve the item 0.35*3 0.30 0.32 SLE
Print the receipt 0.11 0.28 0.03 Machines + LMS
Return item to the hand-in-robot 0.08*3 0.55 0.13 Machines + LMS
Classify the item 0.17*3 0.30 0.15 SLE
TOTAL 1.91
0.63
If the items are returned manually with a librarian, the customer gives
the items to the main desk. The librarian scans each item by hand to enter into
the system (0.20 minute) and then rewrites the RFID tag to specify that the
item is in the library again (0.32 minute). In order to do this the librarian places
the item in the RFID station. Finally, the employee leaves the items in the book
truck. Table 8 contains the results.
Table 2: Returning Process through the librarian staff
Returning Process through the library staff
Acti
vit
ies
Activity Average
Time (min)
Cost (€/min)
Cost (€) Resources
Return item manually into the
system 0.20*3 0.55 0.33 Main desk + LMS
Rewrite the RFID tag 0.32*3 0.73 0.70 Main desk + Machines + LMS
Print the receipt 0.11 0.55 0.06 Main desk + LMS
Leave the items in the book truck 0.10 0.45 0.05 Main desk
Go to the hand-in-robot 0.03*3 0.30 0.03 SLE
Return item to the hand-in-robot 0.08*3 0.58 0.14 SLE + Machines + LMS
Classify the item 0.17*3 0.30 0.15 SLE
TOTAL 2.61
1.46

Using Time-Driven Activity-Based Costing to Support Library Management Decisions 22
Library Quarterly: Information, Community, Policy, vol. 84, no. 1, pp. 1–23. © 2014 by The University of Chicago. All rights
reserved.
Implications
The TDABC analysis provides many insights into the costs of the lending and
returning processes. This, in turn, leads to several implications and
recommendations. From the example on the returning process, it is evident that
the time and cost of returning three items manually is very high in comparison
with the same activity performed by the robots. If the items are returned by the
chico robot, we obtain a reduction in costs of 47 percent. If this task is
performed through the hand-in-robot, the cost is 20 percent less in comparison
to the chico robot. Based on these figures it is recommended to automate as
much as possible the returning process, as this will lead to significant cost
reductions.
Although, most of the processes in the Circulation Department have
been automated, there are still some activities that can be improved. For
instance, in table 3 the total cost of a WBIB lending process is analyzed through
three different cases. The TDABC analysis shows that paying fines electronically
is slightly less expensive than paying in cash (6 percent), as in both cases the
assistance of a librarian is required. However, if a customer does not have to
pay a fine, the cost is reduced by 76 percent. Based on these findings, potential
improvements can be undertaken, such as performing awareness-raising
campaigns about returning items on time or paying fines at the time of
enrollment at the University.
Other what-if analysis can be done between the activities performed by
an SLE or a librarian, such as reshelving the materials. An interesting discussion
is also to analyze the most expensive activities, for instance, printing requests
in the WMAG process (€ 1.10). Taking into account the incurred costs for such
an activity and the environmental impact caused, one may consider automating
this activity by setting alerts to the system when a new request is performed.

Using Time-Driven Activity-Based Costing to Support Library Management Decisions 23
Library Quarterly: Information, Community, Policy, vol. 84, no. 1, pp. 1–23. © 2014 by The University of Chicago. All rights
reserved.
Conclusions
Because of the current economic conditions of our times and because of limited
resources, academic libraries are called to search for efficient methods to
balance their limited budgets with the services provided. Hence, the costs and
time consumed by activities, processes and resources are extremely important
and of high interest to library managers in identifying non-value-added
activities, finding and adapting best practices, and justifying decisions and
choices. In this article, a case study of the Time-Driven Activity-Based Costing
implementation on the loan and return processes at the Arenberg Campus
Library of the KU Leuven was conducted. This case study has illustrated
through six simple steps how this method can be used in carrying out a cost
analysis in a simple, easy-to-understand and accurate manner.
Several important insights have emerged from the case study. The first
important insight is that the amount of time required to collect the duration of
activities and to document the activity flows is relatively limited compared to
the insights gained from the analysis. The duration of activities was gathered by
direct observation since the most accurate data were collected when librarians
physically performed the tasks. Although in the beginning, this process is more
time consuming, nonetheless, the final model considers real and detailed values
about the library activities. Therefore, a trade-off between measurement time
and accuracy must be considered. To document the activity flows, rounds of
interviews with library managers and staff were done to identify the activities,
resources and responsibilities. A second important insight is that software tools
and the ease of presenting results help to decrease implementation time, and
allow for better communication and validation. MS Office suite programs, such
as Visio and Excel, were integrated to store, analyze and create graphical
representations of the activity flows. As a consequence of this clear graphical
representation, librarians were able to easily understand the sequences and
their responsibilities in each process, and consequently, this allowed us to
validate the collected information straightforwardly. Finally, a third important
insight is that the involvement and commitment of the library staff are critical

Using Time-Driven Activity-Based Costing to Support Library Management Decisions 24
Library Quarterly: Information, Community, Policy, vol. 84, no. 1, pp. 1–23. © 2014 by The University of Chicago. All rights
reserved.
to the data collection in increasing the acceptance of the model. Therefore,
motivation and an explanation of the measurement purpose are fundamental
for achieving the desired commitment with staff. In the case of a large library,
this requirement is even more critical since the number of employees gives rise
to different types of opinions and attitudes regarding the process. This case
study shows that TDABC is applicable to large libraries as well but that
involvement of library staff is crucial.
A real situation that libraries face is the decision to automate repetitive
processes. In this case study this is analyzed through three different situations
of the returning process. With a simple but interesting example, we compare
the costs of some specific activities performed by staff or machines. As we can
see, the use of robots is well justified to automate these repetitive processes,
especially in the cases of costly labor and in high number of activities.
This case study also illustrates some important benefits of TDABC such
as the following: (1) better understanding of the costs’ origins due to the
disaggregated cost, time and resources per activity and of activities to be
improved or discarded (e.g., including alerts in the LMS when a new request is
available instead of printing requests); (2) an improved alternative evaluation
for comparing different scenarios (e.g., manual activities vs. automated); (3)
enhanced communication to analyze the cause of specific problems with
stakeholders (librarians) that can easily understand the methodology applied;
at the same time, librarians can justify the increase of wages or the
development of the new services based on their responsibilities and the time
required to perform them; (4) adaptability when, for instance, it is required to
switch resources in busy periods, as when adding more staff to strengthen the
user attention process is required to cope with the increased demand at the
beginning of every semester; as demand increases (customers require extra
attention to get familiar with the library), a shift from other areas for a specific
period of time can be made; activities that were relegated for this cause can be
prioritized during periods of low demand (e.g. when classes have ceased).

Using Time-Driven Activity-Based Costing to Support Library Management Decisions 25
Library Quarterly: Information, Community, Policy, vol. 84, no. 1, pp. 1–23. © 2014 by The University of Chicago. All rights
reserved.
In summary, although at first glance, TDABC may seem more difficult to
implement and to require more intensive data collection compared to a
traditional costing system, our investigation shows that TDABC in practice is
simple and easy to understand when the six steps identified by Everaert and
colleagues (2008) are followed. Furthermore, the potential benefits accruing
from the TDABC implementation such as the accuracy to calculate the costs of
library services, the possibility of performing benchmarking analysis,
disaggregating values per activity, and justifying decisions and choices,
validates the effort required to collect the data. An interesting avenue for future
research is to perform a TDABC analysis on the user reference process.
Considering that this kind of task does not follow a structured and systematic
sequence (i.e., activities are addressed as they come in), as is in the case of our
study, we expect that this analysis requires more effort and expertise. As a
consequence, time analysis could be less accurate and more difficult to
interpret. Additionally, a benchmark study is an interesting project to be done
with libraries without fully automated loan and return processes.
References
Blixrud, Julia C. 2003. “Assessing library performance: new measures, methods,
and models.” In Proceedings of the IATUL Conferences, Paper 9. Ankara,
Turkey: Purdue e-Pubs.
Cardinaels, Eddy and Eva Labro. 2008. “On the determinants of measurement
error in time-driven costing.” The Accounting Review 83 (3): 735–756.
Ching, Steve H., Maria W. Leung, Margarret Fidow, and Ken L. Huang. 2008.
“Allocating costs in the business operation of library consortium: The case
study of super e-book consortium.” Library Collections, Acquisitions, and
Technical Services 32 (2): 97–103.
Cooper, Robin, and Robert S. Kaplan. 1988. “Measure costs right: Make the right
decision.” Harvard Business Review 66 (5): 96–103.
Dekeyser, Raf, and Ludo Holans. 2003. “Around the world to Katholieke
Universiteit Library, Leuven, Belgium.” Library Hi Tech News 20 (8): 1.
Ellis-Newman, Jennifer. 2003. “Activity-Based Costing in user services of an
academic library.” Library Trends 51 (3): 333–348.

Using Time-Driven Activity-Based Costing to Support Library Management Decisions 26
Library Quarterly: Information, Community, Policy, vol. 84, no. 1, pp. 1–23. © 2014 by The University of Chicago. All rights
reserved.
Ellis-Newman, Jennifer, Haji Izan, and Peter Robinson. 1996. “Costing support
services in universities: an application of activity-based costing.” Journal of
Institutional Research in Australasia 5 (1): 75–86.
Ellis-Newman, Jennifer, and Peter Robinson. 1998. “The cost of library services:
Activity-based costing in an Australian academic library.” The Journal of
Academic Librarianship 24 (5): 373–379.
Everaert, Patricia, and Werner Bruggeman. 2007. “Time-driven activity-based
costing: Exploring the underlying model.” Journal of Cost Management 21
(2): 16–20.
Everaert, Patricia, Werner Bruggeman, Gerrit Sarens, Steven R. Anderson, and
Yves Levant. 2008. “Cost modeling in logistics using time-driven ABC:
Experiences from a wholesaler.” International Journal of Physical
Distribution & Logistics Management 38 (3): 172–191.
Goddard, Andrew, and Kean Ooi. 1998. “Activity-based costing and central
overhead cost allocation in universities: A case study.” Public Money and
Management 18 (3): 31–38.
Kaplan, Robert S. and Steven R. Anderson. 2004. “Time-driven activity-based
costing.” Harvard Business Review (82): 131-138.
Kaplan, Robert S., and Steven R. Anderson. 2007a. “The innovation of time-
driven activity-based costing.” Journal of cost management 21 (2): 5–15.
Kaplan, Robert S., and Steven R. Anderson. 2007b. Time-driven activity-based
costing: a simpler and more powerful path to higher profits. Boston, MA,
USA: Harvard Business School Press.
Kaplan, Robert S., and Robin Cooper. 1998. Cost & effect: using integrated cost
systems to drive profitability and performance. Boston, MA, USA: Harvard
Business School Press.
McKendrick, Joseph 2011. “Funding and priorities: The library resource guide
benchmark study on 2011 library spending plans.” Chatham, NJ, USA:
Unisphere Research, a division of Information Today, Inc.
Novak, Denise D., Afeworki Paulos, and Gloria St. Clair. 2011. “Data-driven
budget reductions: A case study.” The Bottom Line: Managing Library
Finances 24 (1): 24–34.
Novićević, Blagoje M., and Antić Ljilja. 1999. “Total quality management and
activity-based costing,” Facta Universitatis 1 (7): 1–8.
Pernot, Eli, Filip Roodhooft, and Alexandra Van den Abbeele. 2007. “Time-
driven activity-based costing for inter-library services: A case study in a
University.” The Journal of Academic Librarianship 33 (5): 551–560.

Using Time-Driven Activity-Based Costing to Support Library Management Decisions 27
Library Quarterly: Information, Community, Policy, vol. 84, no. 1, pp. 1–23. © 2014 by The University of Chicago. All rights
reserved.
Rouse, William B. 1975. “Optimal resource allocation in library systems,”
Journal of the American Society for Information Science 26 (3): 157–165.
Siguenza-Guzman, Lorena, Alexandra Van den Abbeele, Joos Vandewalle, Henri
Verhaaren, and Dirk Cattrysse. 2013. “Towards a holistic analysis tool to
support decision-making in libraries.” In Proceedings of the IATUL
Conferences. Paper 29. Cape Town, South Africa: Purdue e-Pubs.
Stouthuysen, Kristof, Michael Swiggers, Anne-Mie Reheul, and Filip Roodhooft.
2010. “Time-driven activity-based costing for a library acquisition process:
A case study in a Belgian University.” Library Collections, Acquisitions, and
Technical Services 34 (2–3): 83–91.
Sudarsan, P. K. 2006. “A resource allocation model for university libraries in
India.” The Bottom Line: Managing Library Finances 19 (3): 103–110.
Tse, Michael S. C., and Maleen Z. Gong. 2009. “Recognition of idle resources in
time-driven activity-based costing and resource consumption accounting
models.” Journal of Applied Management Accounting Research 7 (2): 41–54.
Wegmann, Grégory and Stephen Nozile. 2009. “The activity-based costing
method developments: state-of-the art and case study.” The IUP Journal of
Accounting Research and Audit Practices 8 (1): 7–22.
Yilmaz, Rifat 2008. “Creating the profit focused organization using time-driven
activity based costing.” In EABR & TLC Conferences Proceedings, 8.
Salzburg, Austria: Clute Institute for Academic Research.
Lorena Siguenza-Guzman: lecturer at the Faculty of Engineering, University of
Cuenca, and doctoral candidate at the Centre for Industrial Management,
Traffic and Infrastructure, Katholieke Universiteit Leuven (KU Leuven).
Siguenza-Guzman holds an engineering degree in computer science and a
master’s degree in Telematics. Her doctoral research, under the
supervision of Dirk Cattrysse, centers on the resource allocation and
budgeting in libraries at the KU Leuven. For this project, she has worked
since 2009 with libraries of the KU Leuven, the biomedical library of the
University of Gent, and several academic libraries in Ecuador. Her research
interests are library management, and automation. Email:

Using Time-Driven Activity-Based Costing to Support Library Management Decisions 28
Library Quarterly: Information, Community, Policy, vol. 84, no. 1, pp. 1–23. © 2014 by The University of Chicago. All rights
reserved.
Alexandra Van den Abbeele: associate professor of accounting at the Faculty
of Business and Economics, KU Leuven. Van den Abbeele’s teaching and
research interests focus on management control systems in inter-firm
relationships. Other work explores how management control systems and
incentive compensation can stimulate creativity and knowledge transfer.
Besides this, she also studies cost accounting systems in nonprofit settings
(e.g. municipalities, libraries). Her work has been published in leading
journals, such as Organization Science, The Accounting Review,
Accounting, Organizations and Society. She serves as editorial board
member for the journals European Accounting Review and Behavioral
Research in Accounting. Email:
Joos Vandewalle: professor and the head of the SCD division at the
Department of Electrical Engineering, KU Leuven. He has been chairman of
ESAT, vice-dean of the Faculty of Engineering, member of the Group of
Science and Technology, and in this last capacity responsible for the
Library for Science and Technology. Vandewalle has authored or
coauthored more than 200 international journal papers. He is a member of
the editorial board of several international journals and fellow of IEEE, IET
and EURASIP. He is a member of the Academia Europaea and of the
Belgian Academy of Sciences. Email: [email protected].
Henri Verhaaren: emeritus professor at the Faculty of Medicine and Health
Sciences, Department of Pediatrics and Medical Genetics, Ghent University.
He is former director of the Biomedical Library of Ghent University and
Ghent University Hospital, and he is continuing his teaching of information
sciences to medical, dental and biomedical students at his faculty as
emeritus. He is fellow of the EAHIL (European Association of Health
Institution Libraries, the Medical Library Association, the Association for
European Pediatric Cardiology, and the American College of Cardiology.
Email: [email protected].

Using Time-Driven Activity-Based Costing to Support Library Management Decisions 29
Library Quarterly: Information, Community, Policy, vol. 84, no. 1, pp. 1–23. © 2014 by The University of Chicago. All rights
reserved.
Dirk Cattrysse: professor, Centre for Industrial Management, KU Leuven.
Cattrysse’s research focuses on the applications of OR models on logistic
problems such as distribution logistics (vehicle routing, location, and
reversed logistics) and (integrated) production planning and scheduling.
He researched applied operations as a visiting fellow at the Massachusetts
Institute of Technology Sloan School of Management (1988-1989) and
served part-time at the University of Stellenbosch (South-Africa),
Department of Industrial Engineering (1998-2004). He is member of the
board of the VLW (Traffic and logistics working group) and is one of the
founders of the new engineering master program “Traffic, Logistics and
Intelligent Transportation Systems.” Email: