presage® st2 assay - instructions for use · st2 in edta-plasma is not significantly affected by...
TRANSCRIPT
Presage® ST2 Assay - Instructions for Use
____________________________________________________________
Page 1 of 30
PN 201028 Rev 5
8/7/13
Name and Ordering Information
Presage® ST2 Assay Kit REF# BC-1065 or 1065X
Presage® ST2 Controls Kit REF# BC-1066
Indications for Use
The Critical Diagnostics Presage® ST2 Assay kit is an in vitro diagnostic device that
quantitatively measures ST2 in serum or plasma by enzyme-linked immunosorbant assay
(ELISA) in a microtiter plate format. The Presage® ST2 Assay is indicated to be used in
conjunction with clinical evaluation as an aid in assessing the prognosis of patients diagnosed
with chronic heart failure.
The Presage® ST2 Controls, Level 1 and Level 2, are designed to be used for monitoring the
performance of test procedures on the Critical Diagnostics Presage® ST2 Assay kit.
Summary and Explanation Heart failure is a chronic, progressive disease in which the ability of the heart to provide needed
cardiac output weakens, thus impeding the heart’s ability to pump enough blood to support the
body’s metabolic demands. The prevalence of heart failure is growing worldwide and is a major
burden on hospital care costs. (AHA, 2011). A major component to this burden is the fact that
patients afflicted with advanced heart failure have high rates of hospitalization and resource
utilization, and similarly have a high risk for death (Schappert et al. 2008). Clinicians continue
to seek improved methods to determine prognosis, and risk stratification in heart failure remain
inadequate. One method now available to clinicians for such assessment is biomarker testing.
ST2 (growth STimulation expressed gene 2; also known as IL1RL1, or Interleukin-1 Receptor-
Like 1) is a member of the interleukin-1 receptor family. The ST2 protein has two isoforms
directly implicated in the progression of cardiac disease: soluble ST2 and a cell membrane-
bound isoform, ST2L. When soluble ST2 levels are low, ST2’s ligand, IL-33, is available to bind
to ST2L and has a cardioprotective effect resulting in preserved cardiac function. However,
when soluble ST2 levels are high, soluble ST2 competitively binds to IL-33, making IL-33 less
likely to bind to ST2L and thereby making IL-33 unavailable for cardioprotective signaling. As a
result, the heart is subjected to greater stress in the presence of high levels of soluble ST2,
leading to cellular death and tissue fibrosis, reduced cardiac function, and an increase in the rate
of disease progression (Kakkar & Lee 2008; Seki et al. 2009). The Presage® ST2 Assay
quantitatively measures the concentration of soluble ST2, providing a physician with an accurate
tool to assess prognosis in patients with chronic heart failure.
Presage® ST2 Assay - Instructions for Use
____________________________________________________________
Page 2 of 30
PN 201028 Rev 5
8/7/13
Principles of the Procedure The Critical Diagnostics Presage® ST2 Assay is a quantitative sandwich monoclonal ELISA in a
96-well microtiter plate format for measurement of soluble ST2 in serum, EDTA plasma, or
heparin plasma.
The Presage® ST2 Assay utilizes two monoclonal antibodies against ST2. A mouse monoclonal
anti-human ST2 antibody is coated onto the surface of the microtiter plate wells and acts as the
capture antibody to bind ST2 molecules in solution. A second mouse monoclonal anti-human
ST2 antibody is provided in solution and functions as the tracer antibody for detecting ST2
molecules which have bound to the capture antibody. The microtiter plate is provided ready-to-
use.
Standards, quality control materials, and patient specimens are introduced in duplicate into the
wells and incubated for 60 minutes. During this incubation, the ST2 present in the standards and
specimens binds to the capture antibody coated onto the well surface. After incubation, a wash
step removes unbound material introduced with the samples.
The tracer antibody, an Anti ST2 Biotinylated Antibody is introduced into the well and incubated
for 60 minutes. During this time, an antibody-antigen-antibody complex is formed. After
incubation, a wash step removes unbound material.
Working Streptavidin-HRP Conjugate Reagent is then introduced into the wells and incubated
for 30 minutes. During this time, the Streptavidin-HRP Conjugate binds to the Anti ST2
Biotinylated Antibodies. After incubation, a wash step removes unbound material.
The Tetramethylbenzidine (TMB) substrate is added, which yields a blue color in the presence of
HRP. The color development is stopped after 20 minutes by the addition of Stop Solution, which
changes the color to yellow and which can be read at an absorbance of 450 nm within 15
minutes.
The absorbance is proportional to the ST2 levels in the specimens. The test results of the
specimens are read from the standard curve.
Materials Required but Not Provided with Assay Kit
Controls (lyophilized recombinant human ST2) are packaged separately and are available
from Critical Diagnostics.
Deionized water
Precision pipettes: 50 µl and 1.0 ml single channel pipettes and a 300 µl multichannel
pipette
Permanent ink pen
Disposable pipette tips

Presage® ST2 Assay - Instructions for Use
____________________________________________________________
Page 3 of 30
PN 201028 Rev 5
8/7/13
Microtiter plate shaker capable of shaking plate at 750 rpm
Non-binding 96-well U-bottom microtiter plate for use as a transfer plate
Mechanical microplate washer as defined in Table 1 or suitable wash buffer bottle for
manual plate washing:
Table 1: Minimum Recommended Plate Washer Requirements for the Presage® ST2 Assay:*
Plate Washer
Feature
Minimum Recommended Requirements for Use
in the Presage® ST2 Assay
Plate Size Support 96 well flat-bottomed plate in 1x8 strips
Number of Cycles Support at least 3 cycles/wash
Dispense Volume Support dispense volume of 350 µl/well
Fluid Reservoir
Capacity
Support at least 500 ml
Tip Adjustment Ability to adjust wash/aspirator tip height
*Each laboratory should ensure proper validation of their equipment and
software for use with the Presage® ST2 Assay.
Absorbent paper towels for plate blotting after washes
Microtiter well reader capable of reading absorbance at 450 nm and other characteristics
as defined in Table 2:
Table 2: Minimum Recommended Plate Reader Requirements for the Presage® ST2 Assay:
Plate Reader
Feature
Minimum Recommended Plate Reader
Requirements for the Presage® ST2 Assay
Detection method Absorbance
Wavelength range Able to measure at 450 nm
Band width ≤ 10 nm
Dynamic Range 0.000 to 3.000 OD
Resolution 0.001 OD
Accuracy ±1.0% or 0.010 from 0 to 2.0 OD; ≤2.0% to 3.0 OD
Reproducibility ±1.0% or 0.010 from 0 to 2.0 OD; ≤1.5% to 3.0 OD
Linearity ±1.0% from 0 to 2.0 OD; ±2.0% to 3.0 OD
Plate type Compatible with 96 well standard flat-bottom
microtiter plates
Read method Endpoint
Read temperature Able to achieve the above performance at room
temperature (20-25˚C)
*Each laboratory should ensure proper validation of their equipment and
software for use with the Presage® ST2 Assay.
Presage® ST2 Assay - Instructions for Use
____________________________________________________________
Page 4 of 30
PN 201028 Rev 5
8/7/13
Microsoft Excel® or a data graphing program such as Graphpad PRISM® or other
appropriate software to perform curve-fitting of the standard (calibration) curve. The
assay can be calibrated with a simple linear regression curve fit, but if available, a
second-order quadratic equation curve fit is recommended. Note that many microtiter
plate readers have curve-fitting software built-in; otherwise, separate curve-fitting
software should be obtained.
For additional information, please contact Customer Service at (877) 700-1250.
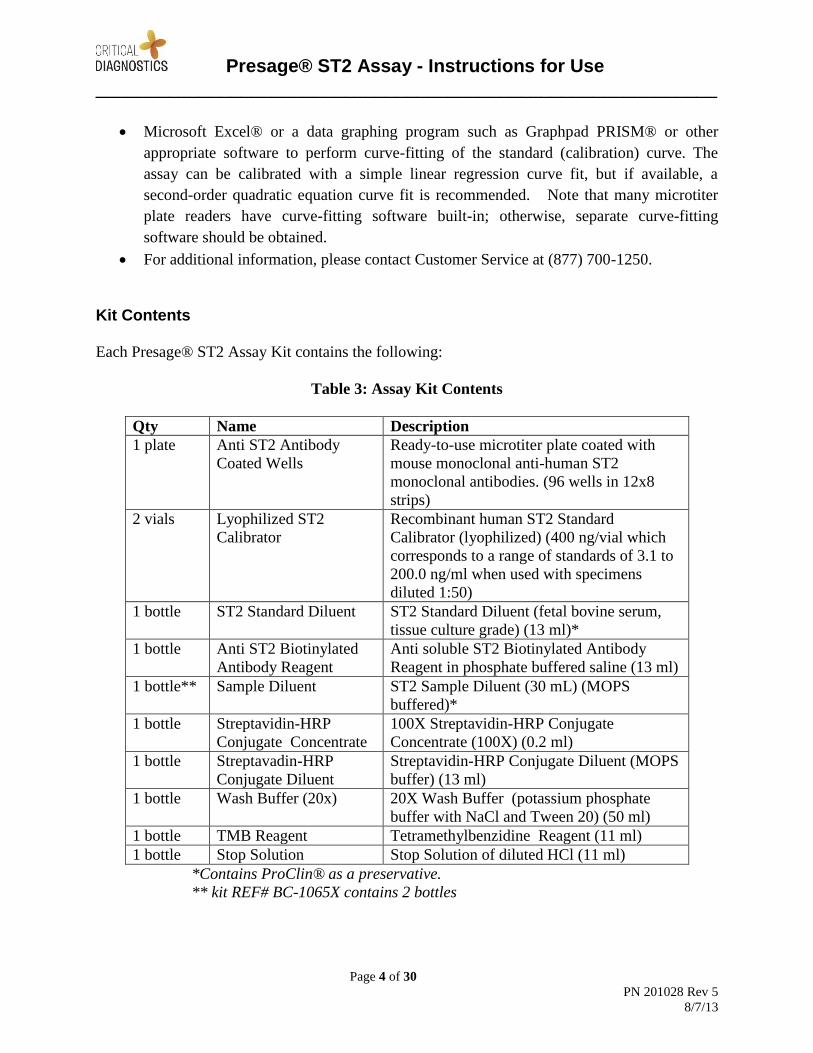
Kit Contents Each Presage® ST2 Assay Kit contains the following:
Table 3: Assay Kit Contents
Qty Name Description
1 plate Anti ST2 Antibody
Coated Wells
Ready-to-use microtiter plate coated with
mouse monoclonal anti-human ST2
monoclonal antibodies. (96 wells in 12x8
strips)
2 vials Lyophilized ST2
Calibrator
Recombinant human ST2 Standard
Calibrator (lyophilized) (400 ng/vial which
corresponds to a range of standards of 3.1 to
200.0 ng/ml when used with specimens
diluted 1:50)
1 bottle ST2 Standard Diluent ST2 Standard Diluent (fetal bovine serum,
tissue culture grade) (13 ml)*
1 bottle Anti ST2 Biotinylated
Antibody Reagent
Anti soluble ST2 Biotinylated Antibody
Reagent in phosphate buffered saline (13 ml)
1 bottle** Sample Diluent ST2 Sample Diluent (30 mL) (MOPS
buffered)*
1 bottle Streptavidin-HRP
Conjugate Concentrate
100X Streptavidin-HRP Conjugate
Concentrate (100X) (0.2 ml)
1 bottle Streptavadin-HRP
Conjugate Diluent
Streptavidin-HRP Conjugate Diluent (MOPS
buffer) (13 ml)
1 bottle Wash Buffer (20x) 20X Wash Buffer (potassium phosphate
buffer with NaCl and Tween 20) (50 ml)
1 bottle TMB Reagent Tetramethylbenzidine Reagent (11 ml)
1 bottle Stop Solution Stop Solution of diluted HCl (11 ml)
*Contains ProClin® as a preservative.
** kit REF# BC-1065X contains 2 bottles

Presage® ST2 Assay - Instructions for Use
____________________________________________________________
Page 5 of 30
PN 201028 Rev 5
8/7/13
Storage Instructions
Store the unopened kit refrigerated at 2-8°C upon receipt and when it is not in use, until the
expiration shown on the kit label. Refer to the package label for the expiration date. Return all
kit components to 2-8°C immediately after use. Reconstituted or diluted kit components may be
stored for a maximum of 7 days at 2-8°C.
Keep microtiter plate in a sealed bag with desiccant to minimize exposure to damp air.
Streptavidin-HRP conjugate concentrate should be diluted on an as-needed basis and diluted
conjugate should not be stored.
Note: The expiration dates of the reagents can only be assured if the reagents are stored
properly, and, in case of repeated use of one reagent, the reagent is not contaminated by a prior
handling.
Do not expose reagents to strong light (e.g. direct sunlight) during storage or use.
Specimen Collection and Storage The Presage® ST2 Assay is validated for use with human serum, EDTA-plasma, and heparin
plasma only. The Presage® ST2 Assay is not validated with citrated plasma. Blood should be
collected using standard collection techniques.
Centrifugation and separation of the serum or plasma from the cellular components should
occur as soon as possible following collection.
The recommended specimen volume for the Presage® ST2 Assay is 20 µl which is sufficient
volume for duplicate measurements following recommended sample dilution. If necessary,
serum or plasma may be stored for future analysis. Endogenous human ST2 has been tested and
shown to be stable under the following conditions:
Table 4: Specimen Storage and Stability
Storage Condition
(temperature)
Specimen Stability
20˚C 48 hours
4˚C 7 days
-20˚C and -80˚C 18 months
ST2 in EDTA-plasma is not significantly affected by sample freeze/thaw cycles and has been
shown to be stable for 15 freeze-thaw cycles.
Presage® ST2 Assay - Instructions for Use
____________________________________________________________
Page 6 of 30
PN 201028 Rev 5
8/7/13
Warnings and Precautions
For in vitro diagnostic use.
For use by healthcare professionals.
Results should be interpreted along with clinical findings and other laboratory test results.
The Presage® ST2 Assay is not indicated for detection, diagnosis, prognosis, or any other
uses in conditions not identified in the Intended Use.
Handle all controls and serum, heparin plasma, and EDTA plasma specimens as
potentially biohazardous material. Follow universal precautions and handle specimens as
potentially contaminated and as if capable of transmitting an infectious agent.
Dispose of waste in accordance with local requirements. A Material Safety Data Sheet is
available upon request.
Avoid contact of assay reagents or specimens with skin, eyes, or mucous membranes. In
the event of contact with skin or eyes, wash immediately with water.
Substrate (TMB) should be kept out of direct sunlight as it is photosensitive.
Some reagents contain the active ingredient ProClin® as a biocide preservative.
The Controls contain human serum derived material and should be handled as though
capable of transmitting infectious disease. Each serum, plasma or whole blood unit used
in the manufacture of this material was tested and found to be negative for antibodies to
HIV, HCV and nonreactive for HBsAg. Because no test method can completely assure
that infectious agents are absent, this material should be handled as though capable of
transmitting infectious disease, and disposed as biohazardous waste according to local
regulations.
The Controls contain less than 0.1% sodium azide, as a biocide preservative, that may
react with lead or copper plumbing to form potentially explosive metal azides. On
disposal, flush with a large volume of water to prevent azide build-up.
Quality Controls Presage® ST2 Assay Controls are packaged separately from the assay kit and are available from
Critical Diagnostics.
Description and Intended Use
The Presage® ST2 Controls Kit is designed for use with the Presage® ST2 Assay Kit. The two
controls (L1 and L2) are provided in a sealed, lyophilized vial format. Following reconstitution
in the specified volume of deionized water the controls will be analyzed using the same protocol
as a clinical test sample. The lower control (L1) is formulated with a target ST2 concentration
between 18.8 ng/ml and 30.0 ng/ml and corresponds to the normal concentration range. The
Presage® ST2 Assay - Instructions for Use
____________________________________________________________
Page 7 of 30
PN 201028 Rev 5
8/7/13
higher control (L2) is formulated with a target ST2 concentration between 65.0 ng/ml and 85.0
ng/ml and corresponds to the concentration range of patients with severe cardiac disease and
worse prognosis.
Assigned Values
The Presage® ST2 Assay Controls are assayed materials which are supplied with lot specific
assigned target values and QC ranges that are printed on the corresponding Certificate of
Analysis sheet. These values and associated ranges are provided as guidelines to the end user. It
is recommended that each clinical laboratory confirm the suitability of the assigned ranges or
establish their own ranges based on their own test system and criteria.
Composition and operating instructions
The base matrix for the Presage® ST2 Assay kit controls is delipidized human serum with
sodium azide (0.09%) added as a preservative. There are no known effects on the assay from this
matrix. Further, the control is produced at a concentration such that for use it will be diluted 50-
fold prior to analysis, exactly the same procedure used for clinical test samples, which may be
EDTA plasma, heparin plasma or serum.
Frequency for QC
It is recommended that both QC levels (L1 and L2) be prepared and analyzed for each analytical
run of the Presage® ST2 Assay. In addition, QC materials should be used in accordance with
local, state, and/or federal regulations or accreditation requirements.
Additional quality control (optional for users)
It is recommended that clinical laboratories consider additional quality control (QC) materials to
enhance their overall quality control strategy. Labs may use patient pools with ST2
concentrations at specific clinical decision levels or cut-points to supplement the ST2 controls
that are supplied with the kit. Users are referred to CLSI C24-A3 for additional information.
Test Procedure: (A) Reagent, Standard, Control, and Specimen Preparation
Note: All samples (patient specimens, controls and calibrators) must be diluted prior to the start
of the testing procedure. Samples dilution should never be performed in the wells of the
antibody-coated plate. In order to allow samples to react with the coated antibody for
approximately the same duration, sample transfer should be completed across the plate in five
minutes or less. In order to facilitate rapid sample transfer, use of a transfer plate and multi-
channel pipette is recommended.

Presage® ST2 Assay - Instructions for Use
____________________________________________________________
Page 8 of 30
PN 201028 Rev 5
8/7/13
1. ST2 Antibody Coated Wells: After opening the pouch, number the top surface of each
strip with permanent ink pen in case they are unintentionally separated from plate frame.
If partial use is desired, unneeded strips may be removed from the frame and returned to
the plate pouch for storage. Do not remove the desiccant from the pouch. Securely re-
seal the plate pouch and return to storage up until the expiration of labeled shelf life at 2-
8˚C. When the first partial plate assay is complete, save the plate frame for the second
partial run.
2. Prior to use, allow all kit components that will be used to equilibrate to room
temperature (18-25˚C) for a minimum of 30 minutes. Note: Return all kit components
to storage at 2-8˚C after use.
3. Wash Buffer: Each Wash Buffer bottle contains 20x concentrated wash buffer. Note:
any crystals that may be present due to high salt concentration must be redissolved at
room temperature prior to making the dilution. Add 50 ml of 20X Wash concentrate to
950 ml of deionized water to make diluted 1x Wash Buffer. 1x Wash Buffer may be
stored for a maximum of 7 days at 2-8˚C.
4. Streptavadin-HRP Conjugate Concentrate: Each Streptavidin-HRP Conjugate
Concentrate contains 100X Streptavidin-HRP Conjugate Concentrate. Dilute the 100X
Streptavidin-HRP Conjugate 100-fold in Streptavidin-HRP Conjugate Diluent before use.
For example, 100 µl of 100X Streptavidin-HRP Conjugate is added to 10 ml of
Streptavidin-HRP Conjugate Diluent. Only dilute the amount of working streptavidin-
HRP conjugate reagent that is needed for use. The combined solution is the Working
Streptavidin-HRP Conjugate Reagent. After use, discard the unused working
Streptavidin-HRP Conjugate Reagent.
5. Reconstitute Controls (L1 and L2): Controls are supplied with assigned reconstitution
volumes that are printed in the accompanying Certificate of Analysis. Ranges are lot-
specific and the user must confirm the appropriate range with each new lot of a Presage®
ST2 Assay Control.
Open vacuum sealed vial slowly to avoid loss of material due to aerosol formation. Note:
to avoid potential cross-contamination, write “L1” or “L2” on the stopper with
permanent ink. Reconstitute one vial of each lyophilized control, L1 and L2, with the
volume of deionized water stated on the vial label. Let reconstituted controls stand for a
minimum of 15 minutes with periodic vortexing and gentle inversion, ensuring that the
reconstitution solution wets the entire surface area inside the vial. Complete dissolution
of the controls is critical. Verify dissolution is complete prior to use. After use, remaining
reconstituted controls may be stored for a maximum of 7 days at 2-8˚C, if reuse is
desired.
6. Prepare Standards and Blank: The Presage® ST2 Assay is calibrated with a set of
standards and a blank that are prepared by serial dilution of the standard (S) that is
supplied with each kit. The measurement range is 3.1 ng/ml to 200.0 ng/ml.
Presage® ST2 Assay - Instructions for Use
____________________________________________________________
Page 9 of 30
PN 201028 Rev 5
8/7/13
Note: Because specimens will be diluted 1:50, actual concentrations of ST2 in the
Standards are 1/50th
of the calibration values given below. For example, Standard S0 is
labeled as “400 ng/ml,” since a specimen with a similar measurement would have an
ST2 concentration of 400.0 ng/ml; however, since the specimen is diluted 1:50 from its
original, the sample on the Plate has an ST2 concentration of 8.0 ng/ml. For consistency,
Standards are always referenced by value of an undiluted specimen that would be
comparable (e.g. S1 is referenced as “200 ng/ml”).
Open vacuum sealed vial slowly to avoid loss of material due to aerosol formation. Note:
to avoid potential cross-contamination, write “S0” on the stopper with permanent ink.
Before use, reconstitute the vial of lyophilized standard (S) with the volume of deionized
water stated on the vial label resulting in 400.0 ng/mL working concentration of standard
(S0). Let reconstituted standard stand for a minimum of 20 minutes with periodic
vortexing and gentle inversion, ensuring that the reconstitution solution wets the entire
surface area inside the vial. Complete dissolution of the standard is critical. Verify
dissolution is complete prior to use. After use, remaining reconstituted standard may be
stored for a maximum of 7 days at 2-8˚C, if reuse is desired.
Label 8 disposable test tubes with numbers S1 through S7 and “Blank” according to the
dilution scheme illustrated in Figure 1. For analysis of a single 96-well plate, perform a
series of 2-fold dilutions of the standard concentrate (S0) in the following steps:
a.) Deliver 0.4 ml of Standard Diluent into tubes S1 through S7 and the Blank.
b.) Transfer 0.4 ml from S0 to S1, repeat as illustrated below through S7. After each
transfer, gently mix the standard receiving the transfer by pipette aspiration,
vortexing, or inversion. Do not transfer diluted standard from S7 to Blank.
After use, remaining reconstituted or diluted standard material may be stored for a
maximum of 7 days at 2-8˚C, if reuse is desired.

Presage® ST2 Assay - Instructions for Use
____________________________________________________________
Page 10 of 30
PN 201028 Rev 5
8/7/13
Figure 1: Serial Dilution Scheme for Preparation of Standards
7. Prepare Patient Samples and Controls: Dilute controls (L1 and L2) and patient
samples, plasma or serum, 50-fold as follows using the included ST2 Sample Diluent
reagent to prepare a diluted sample plate (see Figure 2 for illustration):
a.) Prepare a 96-well U-bottom plate (“transfer plate”) with 0.180 ml of ST2 Sample
Diluent in columns 1-5 and 0.200 mL of ST2 Sample Diluent in columns 6-10.
b.) Pipette 0.020 ml of patient sample or Control to individual wells in columns 1-5 of
the sample diluent plate. After pipetting each sample, mix each dilution by
performing multiple aspiration and dispense cycles with the pipette.
c.) Transfer 0.050 ml of each diluted patient sample in column 1-5 of the sample diluent
plate to corresponding positions in columns 6-10 of the same sample diluent plate.
Figure 2: Illustration of sample dilution plate
Note: The Presage® ST2 Assay is designed to analyze samples (patient specimens and
Controls) that are diluted 50-fold in assay buffer prior to analysis. This provides the
proper sample to reagent ratio that yields optimal results within the measurement range of
3.1 to 200.0 ng/ml. Patient specimens that yield ST2 results lower than 3.1 ng/ml
should be reported as below limit of detection and if greater than 200.0 ng/ml should
be reported as >200 ng/ml or if desired can be diluted further and re-analyzed.
8. All other reagents are ready to use.
(B) Assay Procedure

Presage® ST2 Assay - Instructions for Use
____________________________________________________________
Page 11 of 30
PN 201028 Rev 5
8/7/13
1. Define a plate map and prepare plate:
Designate microtiter plate wells for each of the test specimens, controls, diluted
standards, and blank. All samples should be tested in duplicate (i.e. blank, diluted
standards, controls, specimens). Secure the desired number of Anti-ST2 Antibody Coated
Wells in the Plate frame.
2. Transfer Samples:
Transfer should be completed within 5 minutes.
Transfer 100 µl of patient samples, Controls, standards, and blank into appropriate Anti-
ST2 Antibody Coated Wells using a multi-channel pipette and according to the plate map
defined in Step 1 above.
3. Incubate:
Incubate the plate for 1 hour ± 5 minutes at 18-25˚C, with shaking at 750 rpm. The
incubation time at this step is critical. The plate should incubate for 1 hour ± 5
minutes. Use of a timer is strongly recommended.
4. Remove Incubation Mixture and Wash Plate:
Remove incubation mixture by emptying plate contents into waste container, and wash:
Mechanical Washer: 350 µl per well, 3 cycles with diluted 1x Wash Buffer. After the
third wash, empty wells by tapping on absorbent paper towel if necessary.
Note: Prior to mechanical washing, ensure wash / aspirator tips have been adjusted to be
close to the bottom of the wells but not touching or scratching the surface.
Manual wash: Empty wells, add 350 µl per well; empty wells by tapping on absorbent
paper towel. Repeat 2 more times for total of 3 wash cycles.
5. Anti-ST2 Biotinylated Antibody Reagent:
Dispense 100 µl of Anti-ST2 Biotinylated Antibody Reagent into each well. Incubate the
plate for 1 hour ± 5 minutes at 18-25˚C, with shaking at 750 rpm. The incubation time at
this step is critical. The plate should incubate for 1 hour ± 5 minutes. Use of a timer is
strongly recommended. Note: avoid pipetting directly from the anti-ST2 Biotinylated
Antibody Reagent bottle. Pour volume needed into intermediate 15 mL conical tube to
measure volume needed, then transfer to the reservoir.
6. Remove Incubation Mixture and Wash Plate:
Remove incubation mixture by emptying plate contents into waste container, and wash:
Mechanical Washer: 350 µl per well, 3 cycles with diluted 1x Wash Buffer. After the
third wash, empty wells by tapping on absorbent paper towel if necessary.

Presage® ST2 Assay - Instructions for Use
____________________________________________________________
Page 12 of 30
PN 201028 Rev 5
8/7/13
Note: Prior to mechanical washing, ensure wash / aspirator tips have been adjusted to be
close to the bottom of the wells but not touching or scratching the surface.
Manual wash: Empty wells, add 350 µl per well; empty wells by tapping on absorbent
paper towel. Repeat 2 more times for total of 3 wash cycles.
7. Working Streptavidin-HRP Conjugate:
Dispense 100 µl of Working Streptavidin-HRP Conjugate into each well. Incubate plate
for 30 minutes ± 5 minutes at 18-25˚C, with shaking at 750 rpm. The incubation time at
this step is critical. The plate should incubate for 30 minutes ± 5 minutes. Use of a
timer is strongly recommended.
8. Remove Incubation Mixture and Wash Plate:
Remove incubation mixture by emptying plate contents into waste container, and wash:
Mechanical Washer: 350 µl per well, 3 cycles with diluted 1x Wash Buffer. After the
third wash, empty wells by tapping on absorbent paper towel if necessary.
Note: Prior to mechanical washing, ensure wash / aspirator tips have been adjusted to be
close to the bottom of the wells but not touching or scratching the surface.
Manual wash: Empty wells, add 350 µl per well and soak for 15 seconds; empty wells by
tapping on absorbent paper towel. Repeat 2 more times for total of 3 wash cycles.
9. TMB Reagent and Incubate in the Dark:
Dispense 100 µl of TMB Reagent into each well. Incubate for 20 minutes ± 5 minutes at
18-25˚C, with shaking at 750 rpm in the dark. Note: avoid pipetting directly from the
TMB Reagent bottle. Pour volume needed into intermediate 15 mL conical tube to
measure volume needed, then transfer to the reservoir.
10. Add Stop Solution :
Pipette 100 µl of Stop Solution into each well. Mix gently for 30 seconds by gently
tapping the side of the plate. The contents of the well will turn from blue to yellow.
11. Remove Bubbles:
Check for and remove any bubbles from the liquid surface of each well. Remove any dirt
or liquid from the well exterior. Note: Bubbles may be removed by using a clean pipette
tip to gently touch and burst the air bubble; be sure to use a clean tip for each well.
12. Measure absorbance:
Read absorbance at 450 nm with a microtiter well reader within 15 minutes of adding
the stop solution.

Presage® ST2 Assay - Instructions for Use
____________________________________________________________
Page 13 of 30
PN 201028 Rev 5
8/7/13
Figure 3: Overview of the Presage® ST2 Assay Procedure
(C) Procedural Notes
All components in the kit must be at room temperature prior to use.
Do not pool reagents from different lots.
All samples should be assayed in duplicate, including blank, diluted standards, controls,
and all diluted patient specimens.
Controls (L1 and L2) should be treated exactly like patient specimens (i.e. diluted 1:50 in
Sample Diluent, assayed in duplicate, checked for agreement).
Do not use any reconstituted material without visually verifying complete dissolution
before sampling.
To avoid potential cross-contamination, labeling stoppers and Controls is recommended.
It is critical to keep the loading time of the diluted standards, blank, Controls, and test
specimens into the Presage® ST2 Assay plate within 5 minutes to reduce within plate
variability. Use of a transfer plate and multi-channel pipette are strongly advised.
Presage® ST2 Assay - Instructions for Use
____________________________________________________________
Page 14 of 30
PN 201028 Rev 5
8/7/13
Use clean, dedicated reagent trays and pipette tips for dispensing the conjugate and
substrate reagents.
After each loading step, check for and remove any bubbles from the liquid surface of
each well. Note: Bubbles may be removed by using a clean pipette tip to gently touch and
burst the air bubble; be sure to use a clean tip for each well.
If partial plate is desired, retain plate frame for reuse.
Discard all consumed reagent upon completion of procedure in compliance with local
biohazardous waste regulations.
Exposure to acids will inactivate the conjugate.
Calculation of Results The Presage® ST2 Assay is based on traditional spectrophotometry and a multi-point standard
(calibration) curve. After completing the assay steps, the absorbance of each specimen is read at
450 nm using the microplate reader. The absorbance is proportional to the concentration of ST2
in the specimens. ST2 concentrations in the specimens are based on the relationship of the
absorbance of the specimens compared to that of the standards, which have a known
concentration of ST2 and should be assigned using the following procedure:
Calculate means of duplicate samples for each standard, specimen, controls, and the
blank. These means are used for all of the following calculations.
Verify the mean absorbance of the blank is less than the mean absorbance of the lowest
standard. If the mean absorbance of the blank exceeds the mean absorbance of the lowest
standard (e.g. the low standard absorbance is negative when the blank absorbance is
subtracted), the entire plate should be repeated.
Use the mean absorbance of each standard to generate the standard curve using a linear
standard curve equation. It is recommended to use Microsoft Excel® or a data graphing
program such as Graphpad PRISM® or other appropriate graphing software. The assay
can be calibrated with a simple linear regression curve fit, but if available, a second-order
quadratic equation curve fit is suggested. See ‘Materials Required But Not Provided’
section above for more details.
Calculate concentrations for each of the duplicate measurements of unknown test
specimens and controls based on the selected curve fit equation using the corresponding
absorbances.
Do NOT multiply the measured concentration of specimens and controls by 50 (dilution
factor of specimens) since Standards have been pre-diluted to match dilution factor of
specimens.
Calculate the average, standard deviation, and coefficient of variation (CV) of the
assigned concentration for each set of duplicate standards, controls, and specimens.
The coefficient of variation (CV) of the duplicate measurements of the test specimens
should be within 10%. Specimens with duplicate CVs greater than 10% should be
reanalyzed.

Presage® ST2 Assay - Instructions for Use
____________________________________________________________
Page 15 of 30
PN 201028 Rev 5
8/7/13
If either control has a duplicate CV greater than 10%, or if a control result is determined
to be out of range, then all specimens should be reanalyzed.
Verify that the average concentration of the duplicate measurement for each control is
within the corresponding acceptable range. If the duplicate measurement of either control
is out of the acceptable range, then the assay should be repeated.
Report the average concentration of the duplicate measurement of each test specimen as
the ST2 concentration.
For reference, a representative standard curve is shown in Figure 4 and representative values for
the absorbance of each diluted standard are shown in Table 5. Note: The figure and table are
shown for informational purposes only and should not be used to derive test results.
Figure 4: A representative standard curve
Note: The standard curve in Figure 4 is for illustration only. Do not use to derive test
results. A new standard curve should be established for each assay.
y = 0.0125x + 0.131 R² = 0.9967
0
0.5
1
1.5
2
2.5
3
0 100 200 300
Ab
s 4
50
ST2 (ng/ml)
ST2 Standard Curve
Series1
Linear (Series1)

Presage® ST2 Assay - Instructions for Use
____________________________________________________________
Page 16 of 30
PN 201028 Rev 5
8/7/13
Table 5: A representative standard curve and typical absorbance values at 450 nm
ST2
(ng/ml)
A450
Blank 0 0.092
S7 3.1 0.139
S6 6.3 0.182
S5 12.5 0.280
S4 25.0 0.464
S3 50.0 0.808
S2 100.0 1.463
S1 200.0 2.567
Note: This standard curve is for illustration only. Do not use to derive test results.
A new standard curve should be established for each assay.
Measuring Range of the Assay The assay is calibrated with seven standards spanning the range of 3.1 to 200.0 ng/ml. Each test
sample (specimen) is pre-diluted 1:50 prior to assay, allowing the measurement to occur within
the range bracketed by the calibrators.
Limitations
The Presage ST2 Assay is intended to be used only in patients with chronic heart failure
and should not be used for diagnosis of heart failure.
There is a possibility that factors such as technical or procedural errors, as well as
additional substances in blood specimens that are not listed below, may interfere with the
test and cause erroneous results.

Presage® ST2 Assay - Instructions for Use
____________________________________________________________
Page 17 of 30
PN 201028 Rev 5
8/7/13
Clinical Evidence and Interpretation of Results
Clinical performance of the Presage ST2 Assay was established in an analysis of the HF-
ACTION (Heart Failure: A Controlled Trial Investigating Outcomes of Exercise TraiNing)
study. HF-ACTION was a multicenter, randomized, controlled, blinded trial of 2,331 patients
with heart failure that compared patients in the exercise training group vs. patients in the usual
care group. Patients were randomized from April 2003 through February 2007 within the United
States, Canada, and France. A complete description of the design of HF-ACTION has been
published previously (Whellan et al. 2007). Plasma samples from a total of 912 patients from this
cohort were available for biomarker analysis. Sensitivity analysis was performed comparing the
set of 912 HF-ACTION subjects having evaluable ST2 values with all other HF-ACTION
participants, and it was found that the clinical validation results based on the evaluable set of
subjects were robust and representative of the larger study population. Cox proportional hazards
analysis validated that ST2 values are informative as a predictor and risk stratifier of all-cause
mortality, mortality due to cardiovascular disease (CVD), all-cause hospitalization, and
hospitalization due to CVD in patients with heart failure, aiding the assessment of their prognosis
in conjunction with clinical assessment.
Reference Group
Soluble ST2 concentrations representative of the general population were determined from 490
individuals (245 women and 245 men) in a reference group of donors from two sources selected
for this purpose (Lu et al. 2010). Donor group one was comprised of 240 individuals from
employees at ARUP Laboratories in Salt Lake City Utah under a protocol approved by the
University of Utah Institutional Review Board. Donor group two was comprised of 250
individuals recruited by ProMedDx (Norton, MA) under IRB approved protocols at collection
sites under contract to ProMedDx. All donors were self declared to be healthy with no history of
heart disease. No other inclusion or exclusion criteria were applied. Demographic information
collected on these donors is summarized in Tables 6-8 below. In summary this population
included apparently healthy individuals, selected without regard to diabetes, hypertension,
pulmonary disease, and renal insufficiency status.
Table 6: Reference Group
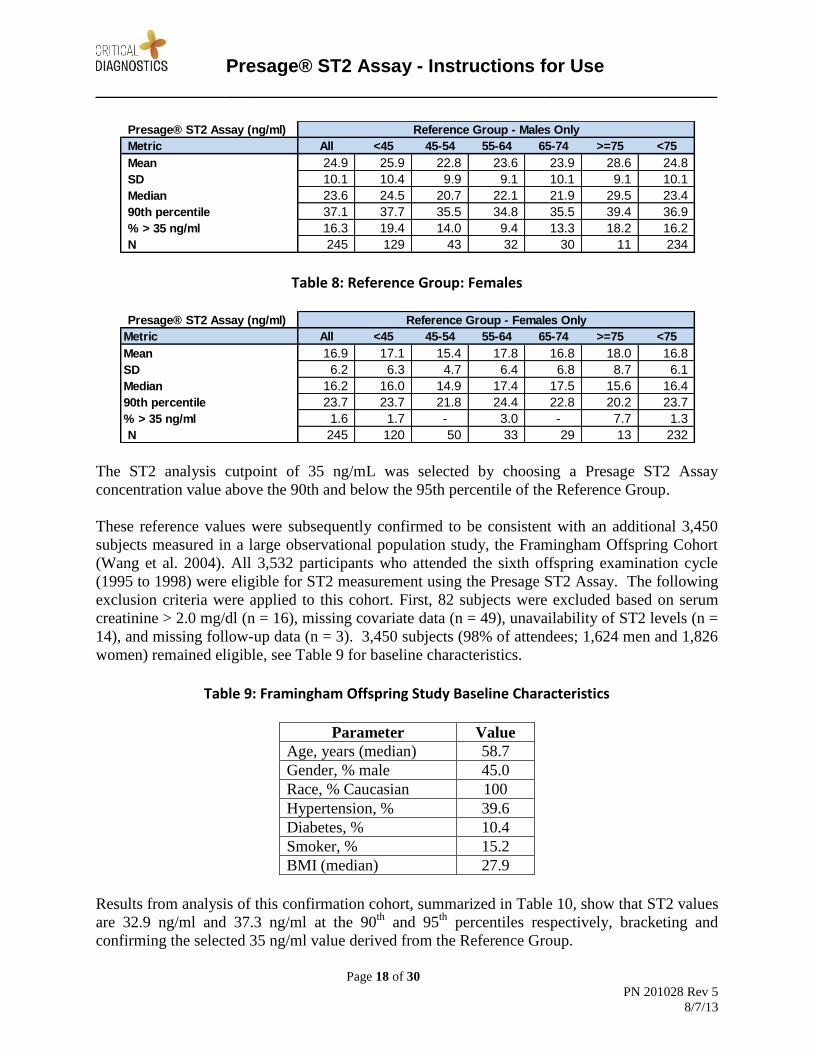
Table 7: Reference Group: Males
Presage® ST2 Assay (ng/ml)
Metric All <45 45-54 55-64 65-74 >=75 <75
Mean 20.9 21.7 18.8 20.7 20.4 22.8 20.8
SD 9.3 9.7 8.4 8.3 9.3 10.2 9.3
Median 18.8 20.0 17.4 18.8 18.9 19.3 18.8
90th percentile 34.2 35.4 30.0 32.5 33.9 37.4 34.2
% > 35 ng/ml 9.0 10.8 6.5 6.2 6.8 12.5 8.8
N 490 249 93 65 59 24 466
Reference Group - All
Presage® ST2 Assay - Instructions for Use
____________________________________________________________
Page 18 of 30
PN 201028 Rev 5
8/7/13
Table 8: Reference Group: Females
The ST2 analysis cutpoint of 35 ng/mL was selected by choosing a Presage ST2 Assay
concentration value above the 90th and below the 95th percentile of the Reference Group.
These reference values were subsequently confirmed to be consistent with an additional 3,450
subjects measured in a large observational population study, the Framingham Offspring Cohort
(Wang et al. 2004). All 3,532 participants who attended the sixth offspring examination cycle
(1995 to 1998) were eligible for ST2 measurement using the Presage ST2 Assay. The following
exclusion criteria were applied to this cohort. First, 82 subjects were excluded based on serum
creatinine > 2.0 mg/dl (n = 16), missing covariate data (n = 49), unavailability of ST2 levels (n =
14), and missing follow-up data (n = 3). 3,450 subjects (98% of attendees; 1,624 men and 1,826
women) remained eligible, see Table 9 for baseline characteristics.
Table 9: Framingham Offspring Study Baseline Characteristics
Parameter Value
Age, years (median) 58.7
Gender, % male 45.0
Race, % Caucasian 100
Hypertension, % 39.6
Diabetes, % 10.4
Smoker, % 15.2
BMI (median) 27.9
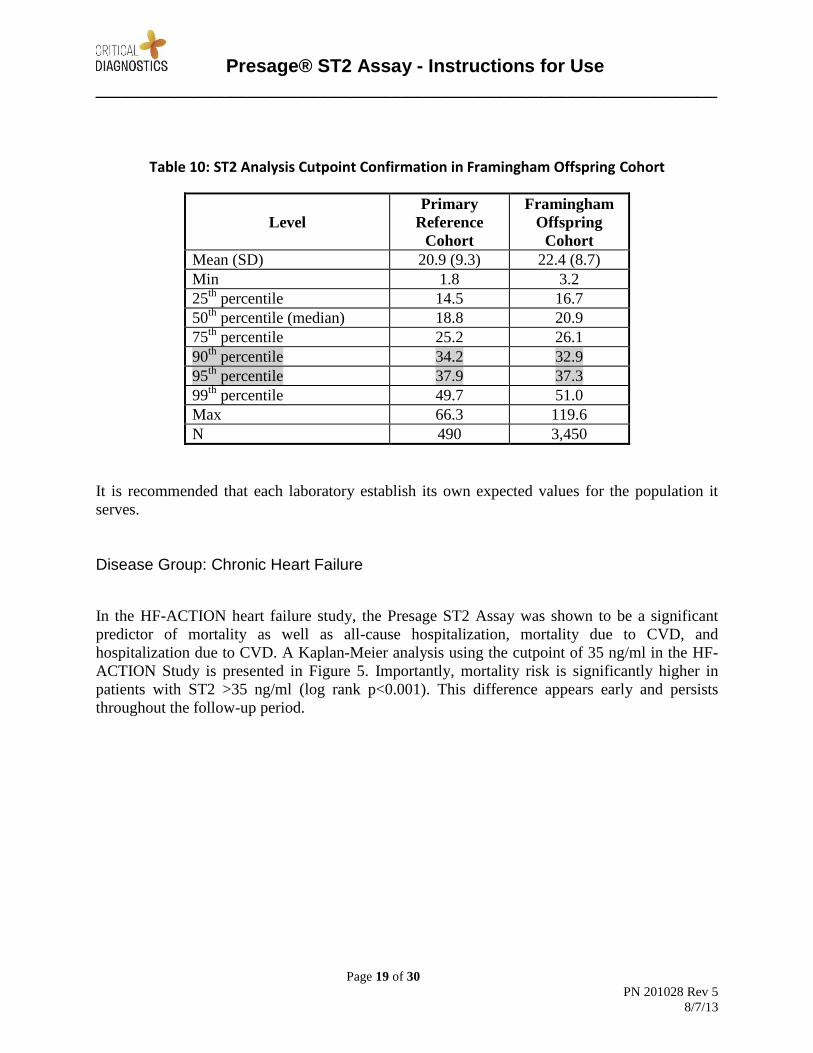
Results from analysis of this confirmation cohort, summarized in Table 10, show that ST2 values
are 32.9 ng/ml and 37.3 ng/ml at the 90th
and 95th
percentiles respectively, bracketing and
confirming the selected 35 ng/ml value derived from the Reference Group.
Presage® ST2 Assay (ng/ml)
Metric All <45 45-54 55-64 65-74 >=75 <75
Mean 24.9 25.9 22.8 23.6 23.9 28.6 24.8
SD 10.1 10.4 9.9 9.1 10.1 9.1 10.1
Median 23.6 24.5 20.7 22.1 21.9 29.5 23.4
90th percentile 37.1 37.7 35.5 34.8 35.5 39.4 36.9
% > 35 ng/ml 16.3 19.4 14.0 9.4 13.3 18.2 16.2
N 245 129 43 32 30 11 234
Reference Group - Males Only
Presage® ST2 Assay (ng/ml)
Metric All <45 45-54 55-64 65-74 >=75 <75
Mean 16.9 17.1 15.4 17.8 16.8 18.0 16.8
SD 6.2 6.3 4.7 6.4 6.8 8.7 6.1
Median 16.2 16.0 14.9 17.4 17.5 15.6 16.4
90th percentile 23.7 23.7 21.8 24.4 22.8 20.2 23.7
% > 35 ng/ml 1.6 1.7 - 3.0 - 7.7 1.3
N 245 120 50 33 29 13 232
Reference Group - Females Only
Presage® ST2 Assay - Instructions for Use
____________________________________________________________
Page 19 of 30
PN 201028 Rev 5
8/7/13
Table 10: ST2 Analysis Cutpoint Confirmation in Framingham Offspring Cohort
Level
Primary
Reference
Cohort
Framingham
Offspring
Cohort
Mean (SD) 20.9 (9.3) 22.4 (8.7)
Min 1.8 3.2
25th
percentile 14.5 16.7
50th
percentile (median) 18.8 20.9
75th
percentile 25.2 26.1
90th
percentile 34.2 32.9
95th
percentile 37.9 37.3
99th
percentile 49.7 51.0
Max 66.3 119.6
N 490 3,450
It is recommended that each laboratory establish its own expected values for the population it
serves.
Disease Group: Chronic Heart Failure
In the HF-ACTION heart failure study, the Presage ST2 Assay was shown to be a significant
predictor of mortality as well as all-cause hospitalization, mortality due to CVD, and
hospitalization due to CVD. A Kaplan-Meier analysis using the cutpoint of 35 ng/ml in the HF-
ACTION Study is presented in Figure 5. Importantly, mortality risk is significantly higher in
patients with ST2 >35 ng/ml (log rank p<0.001). This difference appears early and persists
throughout the follow-up period.

Presage® ST2 Assay - Instructions for Use
____________________________________________________________
Page 20 of 30
PN 201028 Rev 5
8/7/13
Figure 5: Kaplan-Meier Analysis ST2 Value >35 ng/ml As a Predictor of All Cause Mortality (HF-ACTION)
As noted above ST2 is also prognostic for clinically important outcomes in addition to all-cause
mortality. Figures 6 through 9 summarize a quantitative analysis of ST2 at 35 ng/ml as a
predictor of all-cause mortality, all-cause hospitalization, mortality due to cardiovascular disease
(CVD), and hospitalization due to CVD respectively.

Presage® ST2 Assay - Instructions for Use
____________________________________________________________
Page 21 of 30
PN 201028 Rev 5
8/7/13
Figure 6: ST2 Relationship to Time of All Cause Mortality Event
Figure 7: ST2 Relationship to Time to All Cause Hospitalization Event

Presage® ST2 Assay - Instructions for Use
____________________________________________________________
Page 22 of 30
PN 201028 Rev 5
8/7/13
Figure 8: ST2 Relationship to Time of CVD Mortality Event
Figure 9: ST2 Relationship to Time to Cardiovascular Hospitalization Event
Presage® ST2 Assay - Instructions for Use
____________________________________________________________
Page 23 of 30
PN 201028 Rev 5
8/7/13
At all time horizons, cumulative event rates for the composite of death or all-cause
hospitalization were consistently higher in the high ST2 group. Patients with baseline ST2
values >35 ng/ml had non-overlapping confidence intervals in their cumulative event rates for
the composite of death or all-cause hospitalization in as few as 90 days post-measurement, with a
1.8 times relative risk, over those patients with baseline ST2 ≤35 ng/ml at the same timepoint.
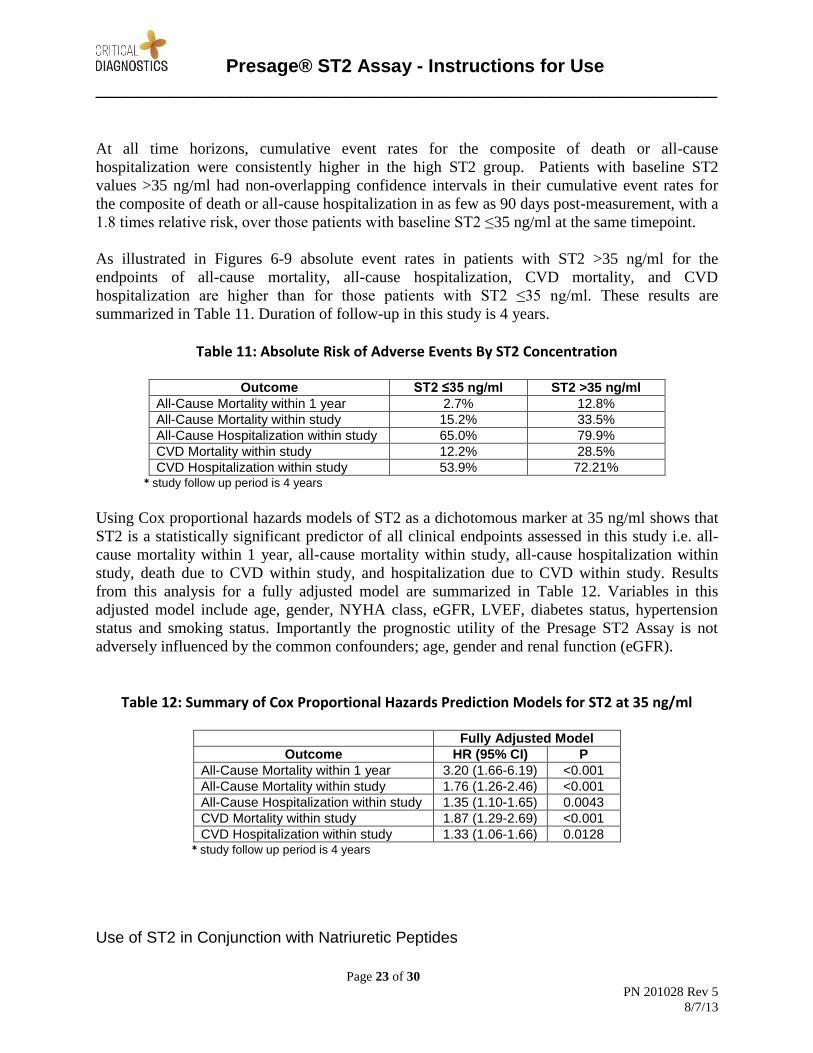
As illustrated in Figures 6-9 absolute event rates in patients with ST2 >35 ng/ml for the
endpoints of all-cause mortality, all-cause hospitalization, CVD mortality, and CVD
hospitalization are higher than for those patients with ST2 ≤35 ng/ml. These results are
summarized in Table 11. Duration of follow-up in this study is 4 years.
Table 11: Absolute Risk of Adverse Events By ST2 Concentration
Outcome ST2 ≤35 ng/ml ST2 >35 ng/ml
All-Cause Mortality within 1 year 2.7% 12.8%
All-Cause Mortality within study 15.2% 33.5%
All-Cause Hospitalization within study 65.0% 79.9%
CVD Mortality within study 12.2% 28.5%
CVD Hospitalization within study 53.9% 72.21% * study follow up period is 4 years
Using Cox proportional hazards models of ST2 as a dichotomous marker at 35 ng/ml shows that
ST2 is a statistically significant predictor of all clinical endpoints assessed in this study i.e. all-
cause mortality within 1 year, all-cause mortality within study, all-cause hospitalization within
study, death due to CVD within study, and hospitalization due to CVD within study. Results
from this analysis for a fully adjusted model are summarized in Table 12. Variables in this
adjusted model include age, gender, NYHA class, eGFR, LVEF, diabetes status, hypertension
status and smoking status. Importantly the prognostic utility of the Presage ST2 Assay is not
adversely influenced by the common confounders; age, gender and renal function (eGFR).
Table 12: Summary of Cox Proportional Hazards Prediction Models for ST2 at 35 ng/ml
Fully Adjusted Model
Outcome HR (95% CI) P
All-Cause Mortality within 1 year 3.20 (1.66-6.19) <0.001
All-Cause Mortality within study 1.76 (1.26-2.46) <0.001
All-Cause Hospitalization within study 1.35 (1.10-1.65) 0.0043
CVD Mortality within study 1.87 (1.29-2.69) <0.001
CVD Hospitalization within study 1.33 (1.06-1.66) 0.0128 * study follow up period is 4 years
Use of ST2 in Conjunction with Natriuretic Peptides
Presage® ST2 Assay - Instructions for Use
____________________________________________________________
Page 24 of 30
PN 201028 Rev 5
8/7/13
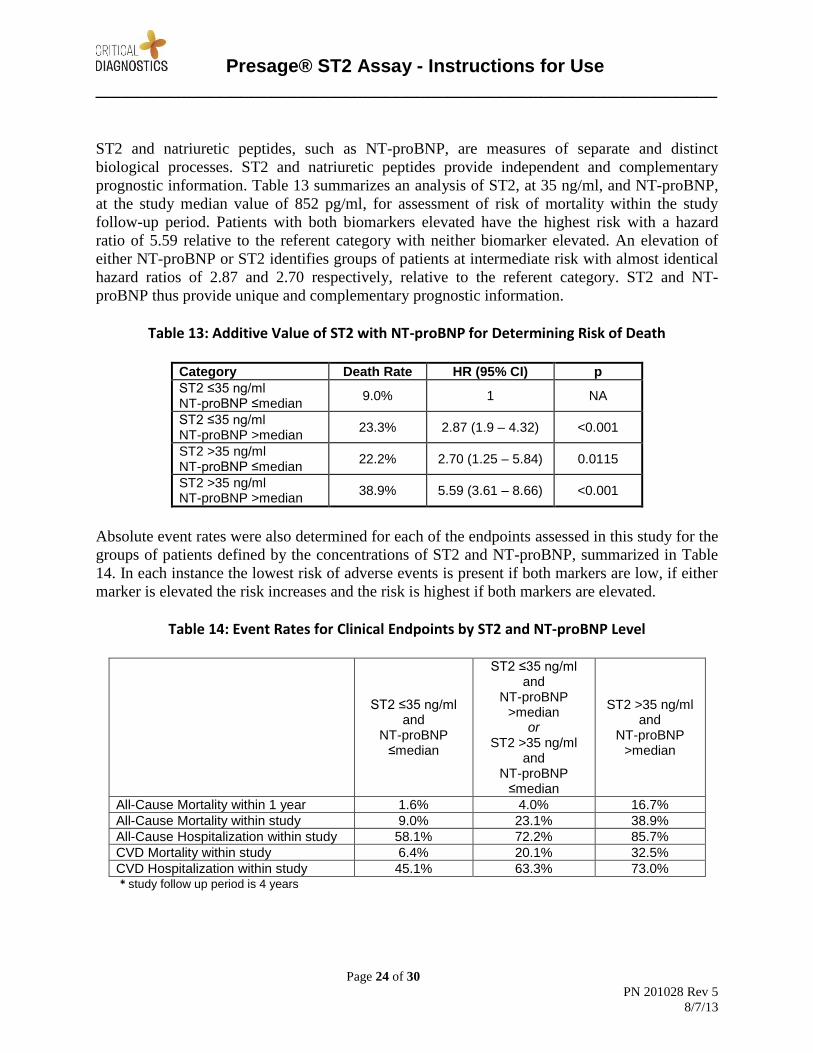
ST2 and natriuretic peptides, such as NT-proBNP, are measures of separate and distinct
biological processes. ST2 and natriuretic peptides provide independent and complementary
prognostic information. Table 13 summarizes an analysis of ST2, at 35 ng/ml, and NT-proBNP,
at the study median value of 852 pg/ml, for assessment of risk of mortality within the study
follow-up period. Patients with both biomarkers elevated have the highest risk with a hazard
ratio of 5.59 relative to the referent category with neither biomarker elevated. An elevation of
either NT-proBNP or ST2 identifies groups of patients at intermediate risk with almost identical
hazard ratios of 2.87 and 2.70 respectively, relative to the referent category. ST2 and NT-
proBNP thus provide unique and complementary prognostic information.
Table 13: Additive Value of ST2 with NT-proBNP for Determining Risk of Death
Category Death Rate HR (95% CI) p
ST2 ≤35 ng/ml NT-proBNP ≤median
9.0% 1 NA
ST2 ≤35 ng/ml NT-proBNP >median
23.3% 2.87 (1.9 – 4.32) <0.001
ST2 >35 ng/ml NT-proBNP ≤median
22.2% 2.70 (1.25 – 5.84) 0.0115
ST2 >35 ng/ml NT-proBNP >median
38.9% 5.59 (3.61 – 8.66) <0.001
Absolute event rates were also determined for each of the endpoints assessed in this study for the
groups of patients defined by the concentrations of ST2 and NT-proBNP, summarized in Table
14. In each instance the lowest risk of adverse events is present if both markers are low, if either
marker is elevated the risk increases and the risk is highest if both markers are elevated.
Table 14: Event Rates for Clinical Endpoints by ST2 and NT-proBNP Level
ST2 ≤35 ng/ml and
NT-proBNP ≤median
ST2 ≤35 ng/ml and
NT-proBNP >median
or ST2 >35 ng/ml
and NT-proBNP
≤median
ST2 >35 ng/ml and
NT-proBNP >median
All-Cause Mortality within 1 year 1.6% 4.0% 16.7%
All-Cause Mortality within study 9.0% 23.1% 38.9%
All-Cause Hospitalization within study 58.1% 72.2% 85.7%
CVD Mortality within study 6.4% 20.1% 32.5%
CVD Hospitalization within study 45.1% 63.3% 73.0% * study follow up period is 4 years
Presage® ST2 Assay - Instructions for Use
____________________________________________________________
Page 25 of 30
PN 201028 Rev 5
8/7/13
Each laboratory should establish a reference range that represents the patient population that is to
be evaluated. In addition, laboratories should be aware of their respective institution’s current
practices in the management of chronic heart failure.
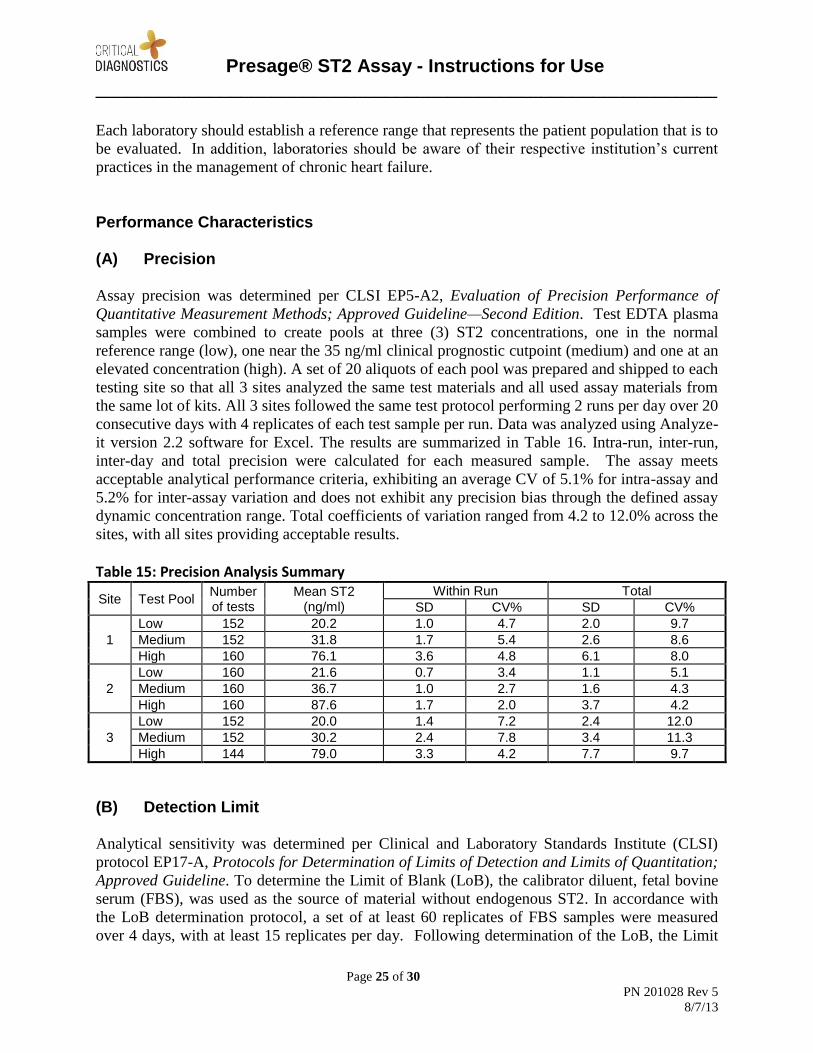
Performance Characteristics (A) Precision Assay precision was determined per CLSI EP5-A2, Evaluation of Precision Performance of
Quantitative Measurement Methods; Approved Guideline—Second Edition. Test EDTA plasma
samples were combined to create pools at three (3) ST2 concentrations, one in the normal
reference range (low), one near the 35 ng/ml clinical prognostic cutpoint (medium) and one at an
elevated concentration (high). A set of 20 aliquots of each pool was prepared and shipped to each
testing site so that all 3 sites analyzed the same test materials and all used assay materials from
the same lot of kits. All 3 sites followed the same test protocol performing 2 runs per day over 20
consecutive days with 4 replicates of each test sample per run. Data was analyzed using Analyze-
it version 2.2 software for Excel. The results are summarized in Table 16. Intra-run, inter-run,
inter-day and total precision were calculated for each measured sample. The assay meets
acceptable analytical performance criteria, exhibiting an average CV of 5.1% for intra-assay and
5.2% for inter-assay variation and does not exhibit any precision bias through the defined assay
dynamic concentration range. Total coefficients of variation ranged from 4.2 to 12.0% across the
sites, with all sites providing acceptable results.
Table 15: Precision Analysis Summary
Site Test Pool Number of tests
Mean ST2 (ng/ml)
Within Run Total
SD CV% SD CV%
1
Low 152 20.2 1.0 4.7 2.0 9.7
Medium 152 31.8 1.7 5.4 2.6 8.6
High 160 76.1 3.6 4.8 6.1 8.0
2
Low 160 21.6 0.7 3.4 1.1 5.1
Medium 160 36.7 1.0 2.7 1.6 4.3
High 160 87.6 1.7 2.0 3.7 4.2
3
Low 152 20.0 1.4 7.2 2.4 12.0
Medium 152 30.2 2.4 7.8 3.4 11.3
High 144 79.0 3.3 4.2 7.7 9.7
(B) Detection Limit Analytical sensitivity was determined per Clinical and Laboratory Standards Institute (CLSI)
protocol EP17-A, Protocols for Determination of Limits of Detection and Limits of Quantitation;
Approved Guideline. To determine the Limit of Blank (LoB), the calibrator diluent, fetal bovine
serum (FBS), was used as the source of material without endogenous ST2. In accordance with
the LoB determination protocol, a set of at least 60 replicates of FBS samples were measured
over 4 days, with at least 15 replicates per day. Following determination of the LoB, the Limit
Presage® ST2 Assay - Instructions for Use
____________________________________________________________
Page 26 of 30
PN 201028 Rev 5
8/7/13
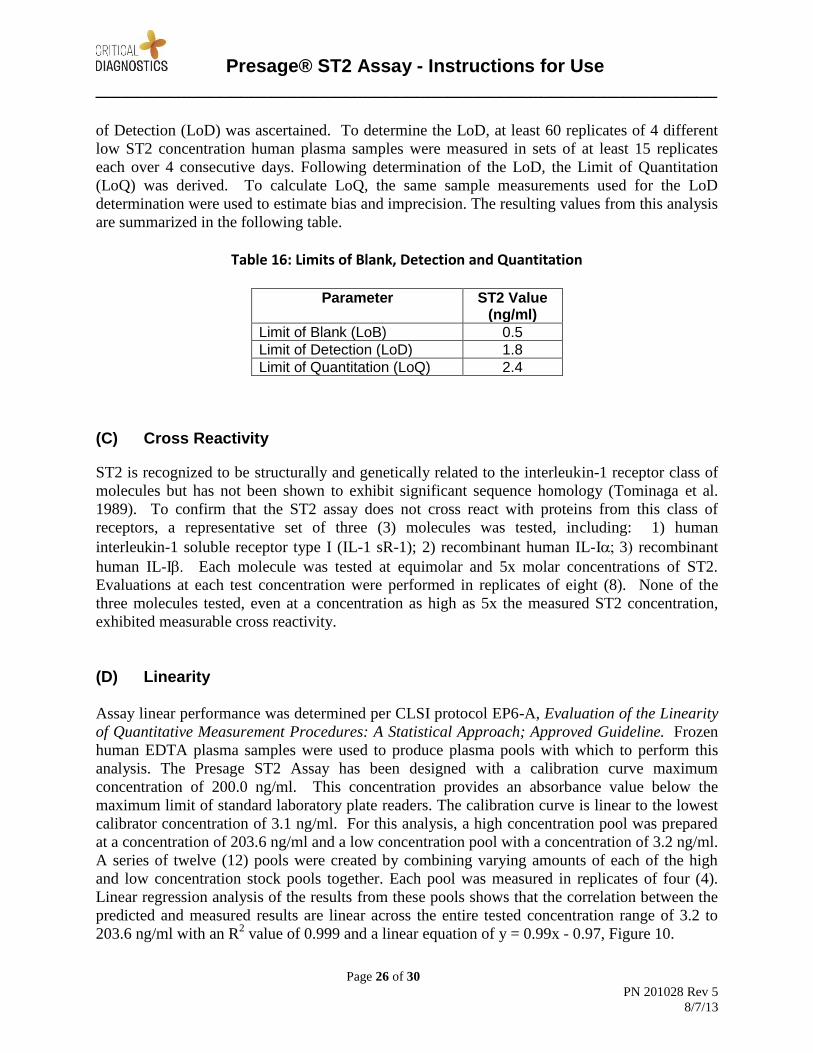
of Detection (LoD) was ascertained. To determine the LoD, at least 60 replicates of 4 different
low ST2 concentration human plasma samples were measured in sets of at least 15 replicates
each over 4 consecutive days. Following determination of the LoD, the Limit of Quantitation
(LoQ) was derived. To calculate LoQ, the same sample measurements used for the LoD
determination were used to estimate bias and imprecision. The resulting values from this analysis
are summarized in the following table.
Table 16: Limits of Blank, Detection and Quantitation
Parameter ST2 Value (ng/ml)
Limit of Blank (LoB) 0.5 Limit of Detection (LoD) 1.8 Limit of Quantitation (LoQ) 2.4
(C) Cross Reactivity
ST2 is recognized to be structurally and genetically related to the interleukin-1 receptor class of
molecules but has not been shown to exhibit significant sequence homology (Tominaga et al.
1989). To confirm that the ST2 assay does not cross react with proteins from this class of
receptors, a representative set of three (3) molecules was tested, including: 1) human
interleukin-1 soluble receptor type I (IL-1 sR-1); 2) recombinant human IL-I3 recombinant
human IL-I Each molecule was tested at equimolar and 5x molar concentrations of ST2.
Evaluations at each test concentration were performed in replicates of eight (8). None of the
three molecules tested, even at a concentration as high as 5x the measured ST2 concentration,
exhibited measurable cross reactivity.
(D) Linearity
Assay linear performance was determined per CLSI protocol EP6-A, Evaluation of the Linearity
of Quantitative Measurement Procedures: A Statistical Approach; Approved Guideline. Frozen
human EDTA plasma samples were used to produce plasma pools with which to perform this
analysis. The Presage ST2 Assay has been designed with a calibration curve maximum
concentration of 200.0 ng/ml. This concentration provides an absorbance value below the
maximum limit of standard laboratory plate readers. The calibration curve is linear to the lowest
calibrator concentration of 3.1 ng/ml. For this analysis, a high concentration pool was prepared
at a concentration of 203.6 ng/ml and a low concentration pool with a concentration of 3.2 ng/ml.
A series of twelve (12) pools were created by combining varying amounts of each of the high
and low concentration stock pools together. Each pool was measured in replicates of four (4).
Linear regression analysis of the results from these pools shows that the correlation between the
predicted and measured results are linear across the entire tested concentration range of 3.2 to
203.6 ng/ml with an R2 value of 0.999 and a linear equation of y = 0.99x - 0.97, Figure 10.

Presage® ST2 Assay - Instructions for Use
____________________________________________________________
Page 27 of 30
PN 201028 Rev 5
8/7/13
Figure 10: Linearity of Presage ST2 Assay
This analysis confirms that the Presage ST2 Assay is highly consistent and linear across the
defined test concentration range of 3.1 (±0.2) to 200.0 (±2.6) ng/ml.
(E) Interfering Substances
Interfering substance testing was performed per CLSI protocol EP7-A2, Interference Testing in
Clinical Chemistry; Approved Guideline—Second Edition, and included the five (5) most
common endogenous substances i.e., total protein (BSA); triglycerides; hemoglobin; cholesterol;
and bilirubin as well as 49 common therapeutic substances. For the endogenous substance
testing each substance was tested at two (2) concentrations using three (3) unique EDTA plasma
pools with different ST2 concentrations - a low concentration pool in the ‘normal’ range at ~20
ng/ml, a medium concentration pool in the clinically significant range near the proposed
prognostic cutoff value of 35 ng/ml, and a high concentration pool at ~70 ng/ml. Potentially
interfering test substances were added to each of the three ST2 concentration pools at levels
ranging between 0.3 to 60 mg/ml depending on the specific substance tested. No significant
interference was observed from: Bilirubin < 0.3 mg/ml, Hemoglobin < 2.0 mg/ml, Triglycerides
< 30 mg/ml, Cholesterol < 5 mg/ml, Total protein (BSA) < 60 mg/ml.
0
50
100
150
200
0 50 100 150 200
ST
2 (n
g/m
l) M
ea
su
red
ST2 (ng/ml) Predicted
y = 0.99x - 0.97R² = 0.999
Presage® ST2 Assay - Instructions for Use
____________________________________________________________
Page 28 of 30
PN 201028 Rev 5
8/7/13
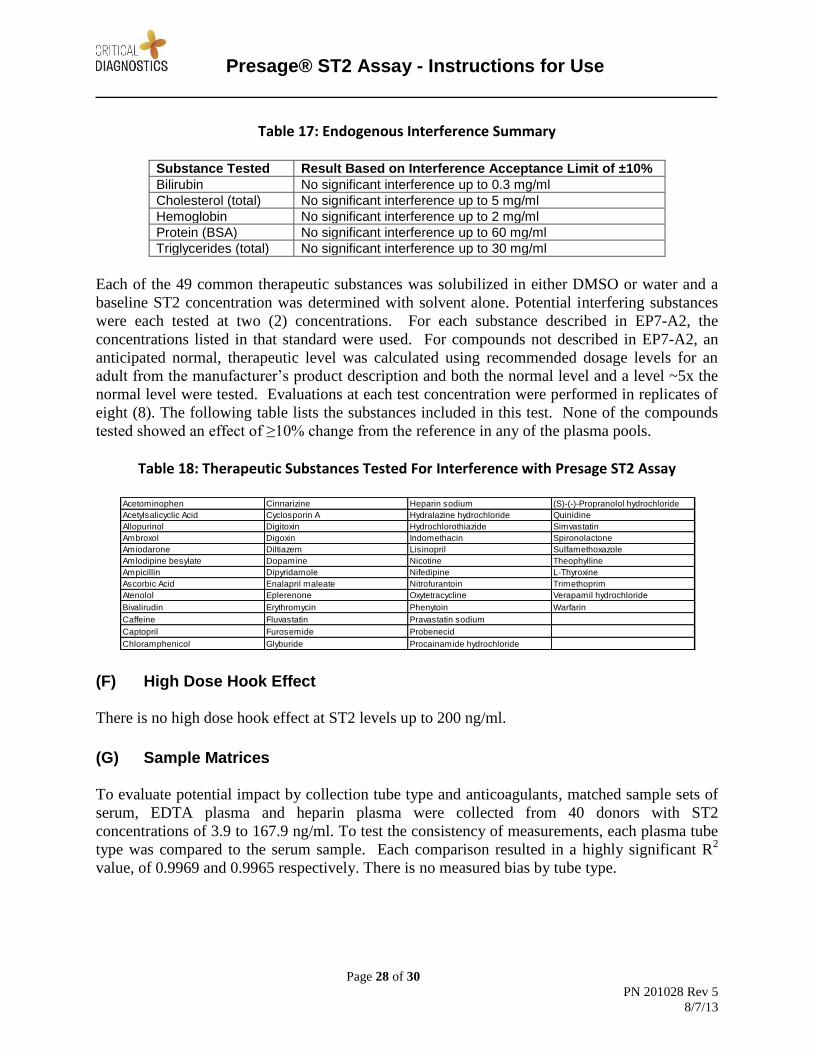
Table 17: Endogenous Interference Summary
Substance Tested Result Based on Interference Acceptance Limit of ±10%
Bilirubin No significant interference up to 0.3 mg/ml
Cholesterol (total) No significant interference up to 5 mg/ml
Hemoglobin No significant interference up to 2 mg/ml
Protein (BSA) No significant interference up to 60 mg/ml
Triglycerides (total) No significant interference up to 30 mg/ml
Each of the 49 common therapeutic substances was solubilized in either DMSO or water and a
baseline ST2 concentration was determined with solvent alone. Potential interfering substances
were each tested at two (2) concentrations. For each substance described in EP7-A2, the
concentrations listed in that standard were used. For compounds not described in EP7-A2, an
anticipated normal, therapeutic level was calculated using recommended dosage levels for an
adult from the manufacturer’s product description and both the normal level and a level ~5x the
normal level were tested. Evaluations at each test concentration were performed in replicates of
eight (8). The following table lists the substances included in this test. None of the compounds
tested showed an effect of ≥10% change from the reference in any of the plasma pools.
Table 18: Therapeutic Substances Tested For Interference with Presage ST2 Assay
(F) High Dose Hook Effect
There is no high dose hook effect at ST2 levels up to 200 ng/ml.
(G) Sample Matrices
To evaluate potential impact by collection tube type and anticoagulants, matched sample sets of
serum, EDTA plasma and heparin plasma were collected from 40 donors with ST2
concentrations of 3.9 to 167.9 ng/ml. To test the consistency of measurements, each plasma tube
type was compared to the serum sample. Each comparison resulted in a highly significant R2
value, of 0.9969 and 0.9965 respectively. There is no measured bias by tube type.
Acetominophen Cinnarizine Heparin sodium (S)-(-)-Propranolol hydrochloride
Acetylsalicyclic Acid Cyclosporin A Hydralazine hydrochloride Quinidine
Allopurinol Digitoxin Hydrochlorothiazide Simvastatin
Ambroxol Digoxin Indomethacin Spironolactone
Amiodarone Diltiazem Lisinopril Sulfamethoxazole
Amlodipine besylate Dopamine Nicotine Theophylline
Ampicillin Dipyridamole Nifedipine L-Thyroxine
Ascorbic Acid Enalapril maleate Nitrofurantoin Trimethoprim
Atenolol Eplerenone Oxytetracycline Verapamil hydrochloride
Bivalirudin Erythromycin Phenytoin Warfarin
Caffeine Fluvastatin Pravastatin sodium
Captopril Furosemide Probenecid
Chloramphenicol Glyburide Procainamide hydrochloride

Presage® ST2 Assay - Instructions for Use
____________________________________________________________
Page 29 of 30
PN 201028 Rev 5
8/7/13
Table 19: Linear Regression Results Comparing Plasma to Serum
Matrix Y Matrix X Slope
(95% CI) Intercept (95% CI)
R2 N
ST2 range (ng/mL)
Lithium heparin plasma
Serum 0.96
(0.94 to 0.98) 0.32
(-0.58 to 1.2) 0.9965
40 3.1 to 200.0 ng/ml K3-EDTA plasma
Serum 1.01
(0.99 to 1.03 -0.27
(-1.2 to 0.63) 0.9969
(H) Reference Interval Analysis
See above: Expected Values.
References: American Heart Association. Heart Disease and Stroke Statistics. 2011.
Kakkar R, Lee R. The IL-33/ST2 Pathway: Therapeutic Target and Novel Biomarker. Nature
Reviews, Drug Discovery. 2008; 7:827-840. Lu J, Snider JV, Grenache DG. Establishment of reference intervals for soluble ST2 from a
United States population. Clin Chim Acta. 2010 Nov 11; 411(21-22):1825-6.
Schappert SM, Rechtsteiner EA. Ambulatory Medical Care Utilization Estimates for 2007. Vital
Health Stat 13. 2011 Apr;(169):1-38.
Seki K, Sanada S, Kudinova AY, Steinhauser ML, Handa V, Gannon J, Lee RT. Interleukin-33
prevents apoptosis and improves survival after experimental myocardial infarction through ST2
signaling. Circ Heart Fail. 2009 Nov; 2(6):684-91.
Tominaga S. A putative protein of a growth specific cDNA from BALB/c-3T3 cells is highly
similar to the extracellular portion of mouse interleukin 1 receptor. FEBS Lett. 1989 Dec
4;258(2):301-4.
Wang TJ, Larson MG, Levy D, Benjamin EJ, Leip EP, Omland T, Wolf PA, Vasan RS. Plasma
Natriuretic Peptide Levels and the Risk of Cardiovascular Events and Death. N Engl J Med
2004; 350: 655-63.
Whellan DJ, O’Connor CM, Lee KL, et al; HFACTION Trial Investigators. Heart failure and a
controlled trial investigating outcomes of exercise training (HF-ACTION): design and rationale.
Am Heart J. 2007;153(2):201-211.

Presage® ST2 Assay - Instructions for Use
____________________________________________________________
Page 30 of 30
PN 201028 Rev 5
8/7/13
Glossary of symbols
Catalog number
In vitro diagnostic medical device
Batch code
Temperature limitation
Use by
YYYY - MM
Manufacturer
Consult instructions for use
Critical Diagnostics
3030 Bunker Hill St., Suite 117A
San Diego, CA 92109
1-877-700-1250 ext.3
1-858-270-2400
www.criticaldiagnostics.com Critical Diagnostics®, Presage®, and Advancing Medicine, Saving Lives® are trademarks of
Critical Diagnostics in the US and other countries. 2011 Critical Diagnostics All rights reserved.