prescription drug coupon study | mass.gov
TRANSCRIPT
COMMONWEALTH OF MASSACHUSETTSHEALTH POLICY COMMISSION
PRESCRIPTION DRUG COUPON STUDY
Report to the Massachusetts LegislatureJULY 2020


HEALTH POLICY COMMISSIONDRUG COUPON STUDY - 1 -
EXECUTIVE SUMMARY
In this report, required by Chapter 363 of the 2018 Session Laws, the Massachusetts Health Policy Commission (HPC) examines the use and impact of prescription drug coupons in Massachusetts. This report focuses on coupons issued by pharmaceutical manufacturers that reduce a commercial patient’s cost-sharing. Prescription drug coupons are offered almost exclusively on branded drugs, which comprise only 10% of all prescriptions dispensed in the U.S., but account for 79% of total drug spending. Despite the immediate ben-efit of drug coupons to patients, policymakers and experts debate whether and how coupons should be allowed in the commercial market given the potential relationship between coupon usage and increased spending on branded drugs versus lower cost alternatives.
Coupons reduce or eliminate the patient’s cost-sharing responsibility required by the patient’s insurance plan, while the plan’s costs for the drug remain unchanged. Manufac-turers and some patient groups assert that coupons increase affordability and adherence to necessary medication. Given the growth in both drug prices and the prevalence of high deductible health plans, individuals may face significant cost burdens. However, payers and pharmacy benefit managers (PBMs) argue that coupons drive use towards high cost drugs when lower cost alternatives may be available, increasing health care system spending that is ultimately passed onto consumers in the form of higher premiums. Payers and their PBMs typically use tiered formularies to distinguish between preferred and less preferred therapies, and they impose different levels of cost-sharing by tier to encourage patients to use preferred drugs. With coupons reducing or eliminating patient cost-sharing, payers and PBMs contend that coupons circumvent value-based benefit design. For this reason, some patient advocates also oppose drug coupons out of concern for the impact on premium affordability.
Prescription drug coupons are currently allowed in all 50 states for commercially-insured patients. Federal health insurance programs, such as Medicare, Medicaid, Tricare and Veteran’s Administration, prohibit the use of coupons based on federal anti-kickback statutes. Massachusetts became the last state to authorize commercial coupon use in 2012 but continues to prohibit manufacturers from offering coupons and discounts on any prescription drug that has an “AB rated” generic equivalent as determined by the Food and Drug Administration (FDA). The 2012 law authorizing coupons in Massachusetts also contained a sunset provision, under which the law would have been repealed on July 1, 2015. However, this date of repeal was postponed several times and ultimately extended to January 1, 2021. Massachusetts has long sought to con-sider the impact of drug coupons on the Commonwealth’s landmark cost containment goals, as well as the benefits for patients’ access to prescription drugs. This report evaluates the impact of drug coupons on patient access, generic and branded drug utilization, and total health care spending in Massachusetts.
In conducting this study, the HPC reviewed available literature, engaged with stakeholders through a public listening session and written testimony, analyzed data from the Center for Health Information and Analysis Mas-sachusetts All-Payer Claims Database (APCD) and other publicly available data, and procured pharmacy data from Symphony Health, a commercial pharmacy data vendor, whose Integrated Dataverse (IDV®) database contains Massachusetts-specific coupon data. The HPC consulted with pharmacy and clinical advisors to provide specific subject-matter expertise.

DRUG COUPON STUDYHEALTH POLICY COMMISSION - 2 -
The HPC’s analyses and policy considerations are designed to support the Commonwealth’s interests in controlling healthcare spending while preserving patient choice and access to necessary medications. This executive summary presents an overview of the report’s findings and recom-mendations regarding prescription drug coupon use in Massachusetts.
KEY FINDINGS
PREVALENCECoupon programs and their uptake have expanded in Massachusetts. The number of branded drugs that offered coupons rose from 278 in 2012 to 701 in 2018. Among commercial prescription fills where a coupon could have been used, the percent of claims in which a coupon was used increased from 2.1% in 2012 to 15.1% in 2018. Still, the percentage of all drug claims that used a coupon in 2018 was quite low (3%) because most prescription fills are for generic drugs (which do not offer coupons). The average coupon value per claim was $229 in 2018, more than double the average in 2012. However, coupon values vary widely, and the majority of coupons used have a relatively modest value, with a median coupon value of $55 per claim.
Top therapeutic categories of coupon use by volume in 2018 include diabetes therapy, including insulin, at 20% of volume; antivirals, mostly comprising HIV treatment and prevention, at 11% of volume; and antiathritics, respira-tory therapy, and hemostatic modifiers, each with 7% of coupon volume. The top three drugs by coupon volume in 2018 were Truvada, an antiviral used for prevention of HIV infection and in treatment for HIV; Trulicity, used in the treatment of type 2 diabetes; and Suboxone sublingual film, used in the treatment of opioid dependence.
Coupons have the largest benefit for patients with high out-of-pocket responsibility. In 2018, for patients whose out-of-pocket responsibility was $50 or more per claim, coupons moderated patients’ actual out-of-pocket spending from an average $186 per claim to $105 per claim. Out- of-pocket responsibility has been rising and will likely continue to do so in the future. A continued rise in both drug prices and high deductible health plans have driven the growth in patient out-of-pocket responsibility. In 2018, 31.5% of Massachusetts commercial patients were enrolled in high deductible health plans, up from 24.5% in 2016. Furthermore, 11.4% of private sector employees in Massa-chusetts were enrolled in health plans that had a separate
prescription drug deductible in 2018 (similar to the national average of 11.8%); for these employees, the average drug deductible was $734, the third highest in the U.S. and more than double the national average of $384.
IMPACT ON ADHERENCEMedication adherence is a crucial aspect of patient care, with implications for health care quality and cost. A com-prehensive literature review shows a strong relationship between patient drug costs and adherence, with studies generally finding higher rates of medication abandonment once out-of-pocket costs per prescription exceed around $200 per claim. Drug coupons may increase medication initiation and adherence by reducing patients’ out-of-pocket costs. However, when the out-of-pocket costs of the drug and the value of the coupon are small, coupons are likely to increase adherence only modestly. Greater impacts of adherence have been found for patients using medications with high cost burdens.
IMPACT ON HEALTH CARE SPENDINGThe availability of drug coupons and their potential influ-ence on consumer behavior may impact health care spending in various ways. Coupons may shift product choices and drive patients towards higher cost drugs when equally appropriate lower cost therapeutic alternatives may be available. Coupons may also help patients initiate or con-tinue a clinically necessary therapy that otherwise would be cost-prohibitive, resulting in higher adherence to needed medications. While higher adherence would increase pre-scription drug spending, this increased drug spending may be potentially offset by lower spending on other medical ser-vices and improved patient health. Furthermore, higher net spending may be warranted to improve clinical outcomes.
Analyzing the impact of drug coupons on total health care spending requires estimating the degree to which coupons influence patient use of a given branded drug over generic or branded alternatives, as well as evaluating whether patients have a choice of alternatives for the drugs for which coupons are offered. Thus, to investigate the impact of prescription drug coupons on utilization and spending, the HPC classified branded drugs that offer coupons into four categories:
1. Generic equivalent: Branded drugs with AB-rated generic equivalents. Massachusetts law prohibits the use of cou-pons on such drugs.

HEALTH POLICY COMMISSIONDRUG COUPON STUDY - 3 -
2. Generic close therapeutic substitute: Branded drugs that do not have generic equivalents but have at least one generic close therapeutic substitute. Medications in the same class may not be equally effective or appropriate for all patients, but these alternatives would be appropriate for many patients.
3. Branded close therapeutic substitute: Branded drugs that have branded close therapeutic substitutes. The competitor drug may or may not also offer coupons. Medications in the same class may not be equally effec-tive or appropriate for all patients, but these alternatives would be appropriate for many patients.
4. No close therapeutic substitute: Branded drugs that do not have any close therapeutic substitutes.
The HPC’s analysis of the impact of coupons on health care spending in Massachusetts focuses largely on estimating the impact for drugs that have generic close therapeutic substitutes (Category 2).
Analysis of impact of coupons for drugs with generic close therapeutic substitutesThe HPC studied the impact of coupons for drugs with generic close therapeutic substitutes by comparing the utilization of branded drugs offering coupons versus their generic alternatives in the Massachusetts commercial pop-ulation with use patterns for the same drug sets in the Massachusetts Medicare program, which prohibits the use of coupons in all circumstances (and thus served as the “control” group). The hypothesis was that the relative utilization would be similar between the two groups if coupons had no impact on the rate of branded drug use.
Fourteen sets of drugs were selected that minimized potential age-related factors that may confound utilization differences between the populations. The HPC used Symphony data to estimate commercial utilization and coupon offerings and used the Center for Medicare and Medicaid Services (CMS) Part D Prescriber Public Use File for Medicare utilization.
The HPC found that the relative use of the branded drug (versus generic alternatives) was substantially higher in the commercial population for 10 of the 14 drug sets. For 4 branded drugs, use trends were similar in commercial and Medicare populations. Across the 14 sets, spending was 18% higher on average per set than it would have been if commercial members used the generic close therapeutic sub-stitutes as often as the Medicare population did. The HPC estimates that the spending impact of coupon availability
for these 14 drug sets in the Massachusetts commercial market was an excess of $3 million per drug per year, and $44.8 million per year in total.
These results suggest that coupon availability is associated with moderately higher utilization of branded drugs rel-ative to use of generic close therapeutic substitutes, and that coupon availability is associated with higher total spending. However, given the case study approach, it is unclear if results from the 14 cases are representative of all couponed drugs with generic close therapeutic substitutes.
This calculation excludes the financial impact of coupons on the much larger number of drugs with generic alterna-tives not included among the 14 case study drugs, drugs with lower cost branded alternatives, and drugs with no alternatives. An estimate of the impact of coupons on premiums that accounted for these factors would likely be substantially larger.
Impact of coupons on premiums and the GICThe excess spending attributable to coupons for the 14 drugs studied totaled $44.8 million per year, representing 0.2% of total commercial spending in Massachusetts in 2018. Using those findings, the HPC estimates that, for an average premium in the Group Insurance Commission (GIC), approximately $18 of the annual single premium and $52 of the annual family premium could be attributed to the availability of coupons for these 14 drugs.
COUPON EXPIRATIONA concern raised about prescription drug coupons is that they may not be available indefinitely, leaving patients with higher cost-sharing once the coupon programs end. Due to lack of data, the HPC was unable to systematically examine the share of coupon programs that imposed a maximum number of uses, limited time duration, or specific expi-ration dates in Massachusetts. Manufacturers and other stakeholders reported that a range of factors determine the benefit design of coupon programs, such as setting a maximum number of uses based on a typical course of treatment. Stakeholders also stated that some expiration dates are set so that patient eligibility for the program (e.g., not receiving government funded insurance) can be verified each year, and programs are typically renewed in the new year without interruptions to patient access.
The HPC evaluated the share of drug brands that offered coupons in Massachusetts in 2013 and still maintained

DRUG COUPON STUDYHEALTH POLICY COMMISSION - 4 -
coupon programs in 2018. The HPC found that about 6% of brands appeared to have discontinued their program over this time period without a generic equivalent entering the market.
OTHER POLICY ISSUES
USE OF COPAY ACCUMULATORS IN COMMERCIAL PLANSIn response to the growth in drug coupon use, commercial payers and their PBMs have increasingly implemented copay accumulator programs. With these programs, a patient can still use coupons to reduce their cost-sharing for a given prescription, but the coupon value does not count toward the patient’s deductible or out-of-pocket maximum. As a result, copay accumulators shift costs from the payer to the patient and to the manufacturer. While these programs may result in lower premiums, they may also preserve the affordability challenges that patients originally faced in their plan design. Additionally, copay accumulators may increase administrative complexity for payers and PBMs and add confusion to patients navigating an increasingly complicated health care system.
HIGH COST GENERIC DRUGSMassachusetts law prohibits the use of coupons for branded drugs when an AB-rated generic becomes available, pro-tecting against higher spending for equivalent products. However, in circumstances where a direct generic equivalent is introduced at a high price, patients with high cost-sharing or deductibles may find the generic unaffordable. For exam-ple, a generic version of Mylan’s EpiPen entered the market in late 2018, yet it was unaffordable for many patients due to its high price, highlighting the need to ensure patient access to such generic products.
SUMMARY AND POLICY CONSIDERATIONSThe HPC’s research concludes that drug coupons increase utilization and spending for a number of drugs with lower cost generic alternatives that would be clinically appropriate for many patients, with implications for higher premiums. However, there are also cases where patients with commer-cial insurance cannot afford clinically necessary medication due to high drug prices and the cost-sharing design of their plans. In these cases, coupons provide financial relief and likely improve adherence, leading to better clinical outcomes.
Continued growth in high deductible plan enrollment, coupled with increasing drug prices, suggests that patient affordability challenges will only increase. Eliminating the availability of coupons at this time – without substantial protections for patient affordability – would likely create serious challenges for many patients in the Commonwealth. Accordingly, the HPC highlights the following policy con-siderations to address the impact of drug coupons on the Commonwealth’s cost containment goals.
Public reporting and oversight: Greater transparency in drug coupon programs and in drug pricing overall would allow regulators to monitor and respond to potential devel-opments in coupon programs. Policymakers may consider strategies to increase transparency and accountability in coupon programs, such as requiring manufacturers to report coupon use and value, and other key elements, to the Center for Health Information and Analysis.
Payer and employer strategies to support high value drug use: Payers should provide transparent price information for prescribers and patients to support decisions between alternative drugs during the clinical visit where a drug is prescribed. In addition, payers and employers should consider plan design options to support patient access by minimizing financial barriers to medically necessary care.
Prescriber education: Providers should disseminate infor-mation to prescribers and adopt system technology to alert prescribers on appropriate drug alternatives. Limiting detailing from pharmaceutical representatives and imple-menting academic detailing programs have been shown to improve prescribing practices.
Strategies to address high drug prices: The expansion and uptake of drug coupon programs reflect a fundamental problem of high drug prices. Policymakers may consider a range of strategies to address high drug prices, including high launch prices and price increases.

HEALTH POLICY COMMISSIONDRUG COUPON STUDY - 5 -
INTRODUCTION
Prescription drug coupons offered by pharmaceutical man-ufacturers reduce the amount of money patients would otherwise pay in the cost-sharing required by their commer-cial health plans (see Sidebar: Defining Prescription Drug Coupons). Prescription drug coupons are offered almost exclusively on branded drugs, which comprise only 10% of all prescriptions dispensed in the U.S., but account for 79% of total drug spending.1 From 2010 to 2017, U.S. spending on branded drugs without generic equivalents increased at an annual rate of 25%, more than double the 10% average annual rate of spending growth for all drugs.2 Despite the immediate benefit of drug coupons to patients, policymakers and experts debate whether and how coupons should be allowed in the commercial market given the potential relationship between increased coupon usage and increased spending on these branded drugs. Given the rapid rise in prescription drug prices and spending in recent years, it is increasingly important to understand the impact of prescription drug coupons.
The availability of manufacturer prescription drug coupons has increased significantly over the last decade. In 2009, manufacturers offered coupons for fewer than 100 brand name drugs in the U.S. overall; by 2015, that number surpassed 700 by some estimates.3 Manufacturers offer coupons for drugs covered under a plan’s pharmacy benefit or medical benefit (drugs that a clinician administers to a patient through injection or infusion in a hospital set-ting).4 In 2018, an estimated 19% of commercially-insured patients in the U.S. who filled a prescription for a branded drug used a coupon at least once in the year to offset their out-of-pocket costs, and the total dollar value of redeemed coupons reached $13 billion nationwide.1 Some industry analyses estimate that coupon programs have a return on
investment for manufacturers as high as 4:1 and up to 6:1 through increased brand utilization.5 However, little information has been published to date to inform the share of such increased utilization that improves adherence to needed medication, and the share that could potentially be substituted with safe and effective lower cost alternatives.
Pharmaceutical manufacturers assert that drug cou-pons increase the affordability of prescription drugs for patients, particularly for patients enrolled in plans with high cost-sharing, such as high copayments, coinsurance or high deductibles. Some patient groups also support the use of coupons, emphasizing that coupons can alleviate some of the financial hardship from high drug costs, and increase access and adherence to necessary therapies for patients who could not otherwise afford them.6, i While recent expansions in commercial drug coverage through the Affordable Care Act (ACA) generally increased prescription drug use and reduced patient out-of-pocket costs on average,7 individuals may face significant cost burdens due to their plan design and specific health conditions, particularly as drug prices have grown. For example, one analysis found the share of prescriptions for specialty drugs (defined as medications reimbursed at $600 or more per 30-day fill) in commercial plans had quadrupled from 2003 to 2014, and median patient out-of-pocket costs increased by 46% for specialty drugs while decreasing by 57% for non-specialty drugs during this time period.8
In contrast, payers and pharmacy benefit managers (PBMs) assert that drug coupons drive use towards high cost drugs when lower cost alternatives may be available, increasing
i The testimony and a recording of the listening session are avail-able on the HPC’s website at: https://www.mass.gov/info-details/hpc-special-events-and-public-sessions

DRUG COUPON STUDYHEALTH POLICY COMMISSION - 6 -
drug spending and overall health care system spending. Typically, payers and their PBMs use tiered formularies to distinguish between preferred and less preferred therapies, and they impose different levels of cost-sharing by tier to encourage patients to use preferred drugs. Drugs may be tiered on the basis of value, such as a generic drug versus branded alternatives, but some plans place high cost drugs on tiers with high cost-sharing, regardless of the drug’s value or alternatives. Payers also negotiate with manufacturers for larger rebates in exchange for favorable tier placement. With coupons reducing or eliminating patient cost-shar-ing, payers and PBMs contend that coupons circumvent value-based benefit design, which can lead to higher drug spending that is ultimately passed through to consumers in the form of higher premiums. For this reason, some patient advocates also oppose drug coupons out of concern for the impact on premium affordability.
Prescription drug coupons are currently allowed in all 50 states for commercially-insured patients. Federal health insurance programs, such as Medicare, Medicaid, Tricare and VA, prohibit the use of coupons based on federal anti-kickback statutes.9 Massachusetts became the last state to authorize commercial coupon use in 2012. However, the Massachusetts coupon law, Chapter 139 of the Acts of 2012,ii prohibits manufacturers from offering coupons and discounts on any prescription drug that has an “AB rated” generic equivalent as determined by the Food and Drug Administration (FDA).
The 2012 Massachusetts coupon law also contained a sunset provision, under which the law would have been repealed on July 1, 2015. However, this date of repeal was postponed several times and ultimately extended to January 1, 2021 as part of the fiscal year 2019 supplemental budget legislation. Chapter 363 of the 2018 Session Laws, An Act Extending the Authorization for the Use of Certain Discount Vouchers for Prescription Drugs requires the Massachusetts Health Policy Commission (HPC) to conduct an analysis and issue a report evaluating the impact of prescription drug coupons on pharmaceutical spending and health care costs in Massachusetts. Specifically, the law requires the HPC to analyze the number and value of coupons redeemed in the Commonwealth, the types of drugs for which coupons were frequently redeemed, any changes in brand and generic utilization, the effects on patient adherence and access, the
ii Available at: https://malegislature.gov/Laws/GeneralLaws/PartI/TitleXXII/Chapter175H/Section3
impact of drug coupons on health care cost containment goals adopted by the Commonwealth, and the impact of drug coupons on commercial and Group Insurance Com-mission (GIC) health insurance premiums and drug costs.
The HPC is an independent state agency established by Chapter 224 of the Acts of 2012, An act improving the quality of health care and reducing costs through increased transparency, efficiency and innovation. The mission of the HPC is to monitor the reform of the health care delivery and payment systems in Massachusetts and develop innovative health policy to reduce overall cost growth while improving the quality of patient care.
In conducting its review pursuant to Chapter 363 of the 2018 Session Laws, the HPC used a multi-pronged approach. The HPC engaged with stakeholders through a public listening session on May 21, 2019 and sought written tes-timony, analyzed spending and utilization from the Center of Health Information and Analysis (CHIA) Massachusetts All-Payer Claims Database (APCD) and publicly available Medicare data, and procured Massachusetts-specific coupon data from Symphony Health, a commercial pharmacy data vendor. The HPC also engaged pharmacist and clini-cian advisors to provide specific subject-matter expertise throughout its analysis.
This report provides information on prescription drug coupon use in the Commonwealth and details the HPC’s analysis on the impact of drug coupons on utilization, access, and health care spending.

DRUG COUPON STUDY - 7 - HEALTH POLICY COMMISSION
SIDEBAR: DEFINING PRESCRIPTION DRUG COUPONSFor the purpose of this report, prescription drug coupons, some-times referred to as copayment coupons or copay assistance programs, are discounts and rebates offered by pharmaceutical manufacturers that reduce a commercial patient’s cost-sharing, as established by the patient’s insurance plan. They are distinct from other third party discount vouchers and saving cards offered by nonprofit organizations, pharmacies, PBMs or other businesses that reduce drug prices for patients but cannot be used in conjunction with insurance (e.g., GoodRx, ScriptSave, Blink Health, Inside Rx). The HPC also did not evaluate the impact of patient assistance programs offered by drug manufacturers, state governments, or independent charities that provide free drugs or financial aid to eligible patients based on factors such as income, medical necessity, and insurance status.
To illustrate how drug coupons work, consider the following hypothetical example. A branded drug has a list price of $3,050 per prescription, and the payer places the drug on a formu-lary tier that imposes a 20% coinsurance requirement on the patient, or $610.* In the absence of a manufacturer coupon, the patient would pay $610 in cost-sharing each time they fill the prescription, and the plan would cover the remaining $2,440 until the patient meets the plan’s out-of-pocket maximum, at which point the payer would cover the cost of the drug in full. With a manufacturer coupon of up to $300 per prescription, for example, the patient would pay $310 per prescription in cost-sharing, the manufacturer would cover $300, and the payer cost for the drug remains unchanged. Exhibit 1 illustrates the flow of payments for this example.
* If the payer/PBM received a rebate from the manufacturer, the net of rebate price would be less than $3,050. However, rebates are typically retained by the payer/PBM, and patient cost-sharing is based on the drug’s list price.
The operation of prescription drug coupon programs varies. Some manufacturers operate their programs directly, while others use third party vendors such as McKesson, TrialCard, and ConnectiveRx to administer these programs.
Manufacturer prescription drug coupons are promoted and distributed through multiple channels including clinicians, phar-macies, newspaper/magazine/TV advertising, and the internet. Traditionally, coupons have been delivered in a physical format: paper vouchers that patients may receive at a physician’s office, debit-type cards distributed by coupon program administrators, or cards that patients could print out after an online registration. When patients cannot redeem a coupon by physically bringing it to the pharmacy (e.g., mail order), coupon programs may offer rebates after a drug is purchased.10
Increasingly, coupons are offered digitally to consumers, phar-macies, and clinicians. ConnectiveRx, a vendor that administers coupon programs on behalf of pharmaceutical manufacturers, estimated that the share of their coupons delivered through plastic and paper cards has dropped from 80% in late 2010 to approximately 40% in early 2017.11 Consumers can now access coupons through email, mobile websites, and text messages. In addition, manufacturers and vendors can deliver coupon offers to pharmacies directly, either through shipping physi-cal coupons or integrating software that distributes coupons electronically at the point of sale.12 Coupon offers can also be embedded in electronic health records (EHRs), presented to clinicians as they make prescribing choices, and sent electroni-cally to the pharmacy.11 Alongside the convenience and access benefits as coupon programs become increasingly digital, coupon programs can be used to generate patient data that are then used by manufacturers to develop pricing, marketing and other strategies.9,13
MANUFACTURER
PHARMACY
PATIENT
PBM�PLAN
1
2
3
4
Patient downloads coupon
Patient gives $300 coupon and $310 cash at the pharmacy
Pharmacy reports to plan that patient paid $610 (actually paid $310)
Plan records $610 in patient out-of-pocket spending
CC $
Example: Patient is responsible for cost-sharing of $610, based on insurance planExhibit 1: Flow of drug coupons in patient out-of-pocket spending
Example: Patient is responsible for cost-sharing of $610, based on insurance plan

DRUG COUPON STUDYHEALTH POLICY COMMISSION - 8 -
MARKET LANDSCAPE OF DRUG COUPONS IN MASSACHUSETTS
DATA SOURCECurrently there are no publicly available data to systemati-cally examine prescription drug coupon use in Massachusetts. To understand the prevalence, value, and type of prescription drug coupons used in Massachusetts, the HPC acquired pharmacy data from Symphony Health following a compet-itive procurement process. Symphony Health is a national health care data services vendor, whose Integrated Dataverse (IDV®) database contains prescription, medical, and hospital claims across all payer types in the U.S.iii IDV® prescription drug claims are sourced from pharmacies. The data the HPC procured include all commercially available Symphony phar-macy claims across multiple payers in Massachusetts from 2011 to 2018. Based on HPC analysis of data from CHIA, an estimated 2.9 million unique commercial members in Massachusetts had at least one pharmacy claim. For 2018, the Symphony database has pharmacy claims for 1.1 million unique commercial patients, thus representing approximately 40% of the Massachusetts commercial population.
iii See additional details in Technical Appendix
USE OF DRUG COUPONS IN MASSACHUSETTSHPC analyses suggest that the prevalence of drug coupon use is relatively low in Massachusetts overall. Extrapolating from the Symphony database, we estimate that, of the 4.1 million commercially-insured residents in 2018, 2.9 million (71%) filled at least one prescription, and among those, approximately 90,000 (3.1%) used a coupon at least once.iv Of patients who used a coupon at least once, the average patient used 3.17 coupons over the course of a year, leading to an estimate of 288,300 total branded drug claims filled with coupons in 2018 (see Exhibit 2). Coupon use varied widely around this average – about half (52%) of coupon users used only one coupon in the course of the year while 8% used at least 10 in a year.
The low rate of coupon use of 3.1% described above largely reflects the fact that 90% of prescriptions filled are for generic drugs that do not offer coupons. In 2018, 701 unique branded drugs offered a coupon in Massachusetts. Among prescriptions filled for these drugs, 15.1% used a coupon. Among all branded drug prescriptions filled, 6.6% were filled with a coupon.
iv Prescriptions may be filled for non-drug products such as insulin test strips; however, non-drug products represent roughly 1% of all pharmacy claims.
Number of commercially-insured residents in MA 4.1 million
Number of commercial patients who picked up any prescription (including branded and generic drugs) 2.9 million
Number of commercial patients who used at least one coupon~90,000
Coupons used by patients on average per year3.17 coupons
C
Total number of branded drug claims �lled with coupons
~288,300
Notes: Graphic is not to scale.Source: HPC analysis of Symphony Health IDV® database, Center for Health Informa-tion and Analysis (CHIA) Massachusetts All-Payer Claims Database, and CHIA enroll-ment trends 2019 report
Exhibit 2: Estimated commercial patient use of coupons in Massachusetts, 2018

HEALTH POLICY COMMISSIONDRUG COUPON STUDY - 9 -
The average coupon value per claim was $229 in 2018, although this average reflects a small number of high values. The distribution of redeemed coupon dollar values (see Exhibit 3) demonstrates that the majority of coupons have relatively modest value, with a median coupon value of $55 per claim. Coupons with a value more than $150 per claim represent only one-quarter of all coupons used in Massachusetts, with a small share (5%) having very high values of $807 or more.
Across a number of metrics, coupon programs and their uptake have expanded in Massachusetts. The unique number of branded drugs that offered coupons rose from 278 in 2012, the first year in which coupons were allowed, to 701 in 2018 (see Exhibit 4). Meanwhile, the average coupon value per claim has more than doubled, reaching $229 in 2018 from $97 in 2012. Coupon uptake, measured by the percent of eligible claims that used a coupon, expanded dramatically from 2.1% in 2012 to 15.1% in 2018.
Notes: Analysis restricted to commercial patients and claims with coupons used for branded drugs.Source: HPC analysis of Symphony Health IDV® database
Exhibit 3: Distribution of coupon value in 2018
50%PERCENTILE
COUPON VALUE
25%5%1% 95% 99%75%
$55$30$10$5 $807 $2,999$150
AMONG PATIENTS WHO USED AT LEAST ONE DRUG COUPON IN 2018
AMONG COMMERCIAL PATIENTS WHO FILLED A PRESCRIPTION FOR ANY DRUG IN 2018
DISTRIBUTION OF COUPON VALUE IN 2018
3.17 claims with coupons
per patient per year
$229 average coupon value
per claim
3% of commercial patients
used a coupon
AVERAGE COUPON VALUE
PER CLAIM USING A
DRUG COUPON
2012
2013
2014
2015
2016
2017
2018
$97
$61
$68
$99
$121
$146
$229 15.1%
13.1%
11.0%
8.5%
8.0%
4.3%
2.1%
701
664
648
564
541
458
278
PERCENT OF
ELIGIBLE CLAIMS THAT USE A
COUPON
UNIQUE NUMBER
OF BRANDED DRUGS THAT
OFFER COUPONS
Notes: Analysis restricted to commercial patients and claims with coupons used for branded drugs.Source: HPC analysis of Symphony Health IDV® database
Exhibit 4: Drug coupon program metrics in Massachusetts, 2012–2018

DRUG COUPON STUDYHEALTH POLICY COMMISSION - 10 -
The growth in coupon use over time coincides with increas-ing patient out-of-pocket responsibility for prescription drugs and other health care services under commercial health plans. From 2011 to 2018, the out-of-pocket respon-sibility for branded drugs grew from an average $29 to $42 per branded drug claim for commercially-insured patients in Massachusetts (see Exhibit 5). Coupons provide the largest financial benefit for patients facing high out-of-pocket responsibility. While the share of branded drug claims with high out-of-pocket responsibility (defined as $50 or more per claim) grew relatively moderately over the last decade, from 14% in 2011 to 17% in 2018, the dollar amount required in patient cost-sharing for these high exposure claims grew dramatically over this time period, more than doubling from an average $94 to $186 per claim. For patients with high out-of-pocket responsibility, drug coupons have a substantial and growing financial benefit. In 2018, for patients with high out-of-pocket responsibility,
coupons moderated actual patient out-of-pocket spending to $105 per claim, a 44% reduction from the liability amount (see Exhibit 5). While the percent of eligible branded drug claims that used a coupon was 15.1% overall, coupon use was 32.9% among claims with high out-of-pocket responsibility, as such patients may be more likely to seek out coupons and other forms of assistance.
A continued rise in high deductible health plans (HDHPs) likely contributes to the growth in patient out-of-pocket responsibility. In 2018, 31.5% of Massachusetts commer-cial patients were enrolled in HDHPs, up from 24.5% in 2016.14 Furthermore, 11.4% of private sector employees in Massachusetts were enrolled in health plans that had a separate prescription drug deductible in 2018 (similar to the national average of 11.8%); for these employees, the average drug deductible was $734, the third highest in the U.S. and more than double the national average of $384.15, 16
20182017201620152014201320122011
Initial OOP responsibility
OOP spending net of coupons
Initial OOP responsibility
OOP spending net of coupons
ALL BRANDS HIGH OOP RESPONSIBILITY DRUGS �> $50 PER CLAIM�
$94 $96 $93 $96
$108
$119
$135
$186
$105
$42
$28
$34
$26
$89$84
$30
$24
$83
$26
$22
$81
$25
$23
$85
$26
$25
$91
$29$29
$28
�44%
Notes: OOP = out-of-pocket. Analysis restricted to commercial patients and claims for branded drugs. Analysis includes claims with and without coupons.Source: HPC analysis of Symphony Health IDV® database
Exhibit 5: Average patient out-of-pocket responsibility per branded drug claim and patient spending net of coupons, 2011–2018

HEALTH POLICY COMMISSIONDRUG COUPON STUDY - 11 -
COUPON USE BY TYPE OF DRUG
COUPON USE BY THERAPEUTIC CATEGORYExhibit 6 lists the top 20 therapeutic categories for coupon use in Massachusetts by volume in 2018, totaling 92% of all coupons used. Diabetes therapy, the number one cat-egory, represented 20% of all coupon volume. Antivirals, largely composed of HIV treatment and prevention but also including medication for other conditions such as Hepatitis C, was the second largest category with 11% of all coupon
volume. Most of these categories reflect therapies for chronic conditions while a minority reflect therapies for acute or sporadic use (such as anti-obesity products) or encompass therapies for a mix of acute and chronic conditions (such as ophthalmic preparations, which includes products for short-term use after cataract surgery as well as products for chronic dry eye).
Vascular agents
Anti-infectives, systemic
Antihyperlipidemic agents
Vitamins
Gastrointestinal
Anti-obesity
Laxatives
Hormones
Immunologic agents
Neurological/neuromuscular disorders
Ophthalmic preparations
Calcimimetic agents
Dermatologicals
Miscellaneous preparations
Psychotherapeutic drugs
Hemostatic modi�ers
Respiratory therapy
Antiarthritics
Antivirals
Diabetes therapy, including insulin 20%
11%
7%
7%
7%
6%
6%
6%
3%
3%
3%
3%
2%
2%
2%
1%
1%
1%
1%
1%
Notes: Analysis restricted to commercial patients and claims with coupons used for branded drugs.Source: HPC analysis of Symphony Health IDV® database
Exhibit 6. Top therapeutic categories by share of coupon volume, 2018

DRUG COUPON STUDYHEALTH POLICY COMMISSION - 12 -
Therapeutic class 2013 Rank
2013 Percent of total
2018 Rank
2018 Percent of total
Rank shift
Antiarthritics 1 15% 3 7%
Antihyperlipidemic agents 2 14% 18 1%
Miscellaneous preparations 3 13% 7 6%
Gastrointestinal 4 7% 16 1%
Psychotherapeutic drugs 5 5% 6 6%
Respiratory therapy 6 5% 4 7%
Diabetes therapy 7 4% 1 20%
Analgesics 8 3% 28 0.4%
Ophthalmic preparations 9 3% 10 3%
Cardiac agents 10 3% 27 0.4%
Contraceptives 11 3% 26 1%
Neurological / neuromuscular disorders 12 3% 11 3%
Anti-obesity 13 3% 15 2%
Vascular agents 14 3% 20 1%
Antivirals 15 2% 2 11%
Hormones 16 2% 13 2%
Anti-infectives 17 2% 19 1%
Dermatologicals 18 2% 8 6%
Hemostatic modifiers 19 2% 5 7%
Genitourinary 20 1% 22 0.8%
The top therapeutic categories of coupon use by volume have not been static. Exhibit 7 shows the top categories in 2013 and their rank in 2018, demonstrating that prescrip-tion drug utilization patterns and corresponding coupon use have changed significantly over time. The movement in coupon use for diabetes therapy is among the most dra-matic, with diabetes therapy growing from representing 4% of all branded coupon volume in 2013 to 20% of volume by 2018 (see Sidebar: Coupon Use for Diabetes Therapy).
There are a number of factors that may influence the rela-tive ranking of categories, such as market dynamics (e.g., entry of new branded products, loss of exclusivity, and changes in drug prices), changes in plan benefit design (e.g., patient facing more or less cost-sharing), shifts in prescrib-ing trends (e.g., stricter guidelines for opioid prescribing or newly published clinical guidelines), and policy changes (e.g., implementation of ACA provisions mandating that most private health insurance plans cover FDA-approved contraceptives without cost-sharing).
Notes: Analysis restricted to commercial patients and claims with coupons used for branded drugs.Source: HPC analysis of Symphony Health IDV® database
Exhibit 7. Top therapeutic categories by coupon volume in 2013 and their rank in 2018
Rank increased
Rank decreased
HEALTH POLICY COMMISSIONDRUG COUPON STUDY - 13 -
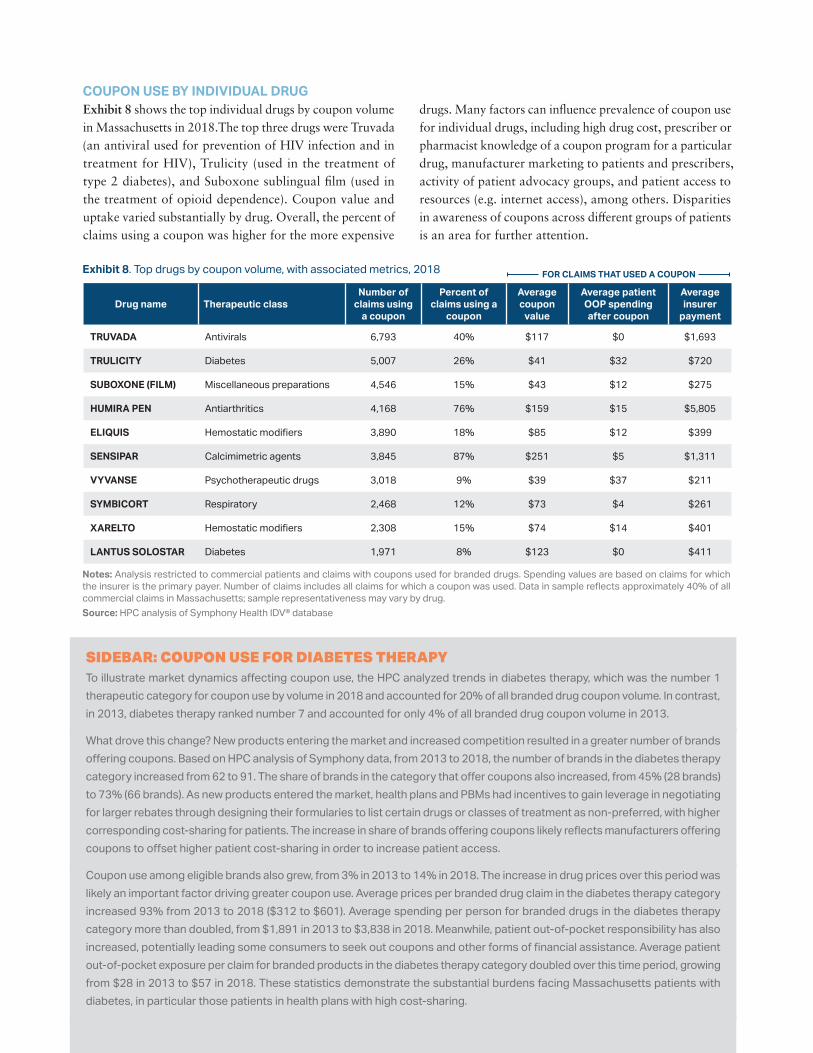
COUPON USE BY INDIVIDUAL DRUGExhibit 8 shows the top individual drugs by coupon volume in Massachusetts in 2018.The top three drugs were Truvada (an antiviral used for prevention of HIV infection and in treatment for HIV), Trulicity (used in the treatment of type 2 diabetes), and Suboxone sublingual film (used in the treatment of opioid dependence). Coupon value and uptake varied substantially by drug. Overall, the percent of claims using a coupon was higher for the more expensive
drugs. Many factors can influence prevalence of coupon use for individual drugs, including high drug cost, prescriber or pharmacist knowledge of a coupon program for a particular drug, manufacturer marketing to patients and prescribers, activity of patient advocacy groups, and patient access to resources (e.g. internet access), among others. Disparities in awareness of coupons across different groups of patients is an area for further attention.
FOR CLAIMS THAT USED A COUPON
Drug name Therapeutic classNumber of
claims using a coupon
Percent of claims using a
coupon
Average coupon
value
Average patient OOP spending after coupon
Average insurer
payment
TRUVADA Antivirals 6,793 40% $117 $0 $1,693
TRULICITY Diabetes 5,007 26% $41 $32 $720
SUBOXONE (FILM) Miscellaneous preparations 4,546 15% $43 $12 $275
HUMIRA PEN Antiarthritics 4,168 76% $159 $15 $5,805
ELIQUIS Hemostatic modifiers 3,890 18% $85 $12 $399
SENSIPAR Calcimimetric agents 3,845 87% $251 $5 $1,311
VYVANSE Psychotherapeutic drugs 3,018 9% $39 $37 $211
SYMBICORT Respiratory 2,468 12% $73 $4 $261
XARELTO Hemostatic modifiers 2,308 15% $74 $14 $401
LANTUS SOLOSTAR Diabetes 1,971 8% $123 $0 $411
Notes: Analysis restricted to commercial patients and claims with coupons used for branded drugs. Spending values are based on claims for which the insurer is the primary payer. Number of claims includes all claims for which a coupon was used. Data in sample reflects approximately 40% of all commercial claims in Massachusetts; sample representativeness may vary by drug.Source: HPC analysis of Symphony Health IDV® database
SIDEBAR: COUPON USE FOR DIABETES THERAPYTo illustrate market dynamics affecting coupon use, the HPC analyzed trends in diabetes therapy, which was the number 1 therapeutic category for coupon use by volume in 2018 and accounted for 20% of all branded drug coupon volume. In contrast, in 2013, diabetes therapy ranked number 7 and accounted for only 4% of all branded drug coupon volume in 2013.
What drove this change? New products entering the market and increased competition resulted in a greater number of brands offering coupons. Based on HPC analysis of Symphony data, from 2013 to 2018, the number of brands in the diabetes therapy category increased from 62 to 91. The share of brands in the category that offer coupons also increased, from 45% (28 brands) to 73% (66 brands). As new products entered the market, health plans and PBMs had incentives to gain leverage in negotiating for larger rebates through designing their formularies to list certain drugs or classes of treatment as non-preferred, with higher corresponding cost-sharing for patients. The increase in share of brands offering coupons likely reflects manufacturers offering coupons to offset higher patient cost-sharing in order to increase patient access.
Coupon use among eligible brands also grew, from 3% in 2013 to 14% in 2018. The increase in drug prices over this period was likely an important factor driving greater coupon use. Average prices per branded drug claim in the diabetes therapy category increased 93% from 2013 to 2018 ($312 to $601). Average spending per person for branded drugs in the diabetes therapy category more than doubled, from $1,891 in 2013 to $3,838 in 2018. Meanwhile, patient out-of-pocket responsibility has also increased, potentially leading some consumers to seek out coupons and other forms of financial assistance. Average patient out-of-pocket exposure per claim for branded products in the diabetes therapy category doubled over this time period, growing from $28 in 2013 to $57 in 2018. These statistics demonstrate the substantial burdens facing Massachusetts patients with diabetes, in particular those patients in health plans with high cost-sharing.
Exhibit 8. Top drugs by coupon volume, with associated metrics, 2018
DRUG COUPON STUDYHEALTH POLICY COMMISSION - 14 -
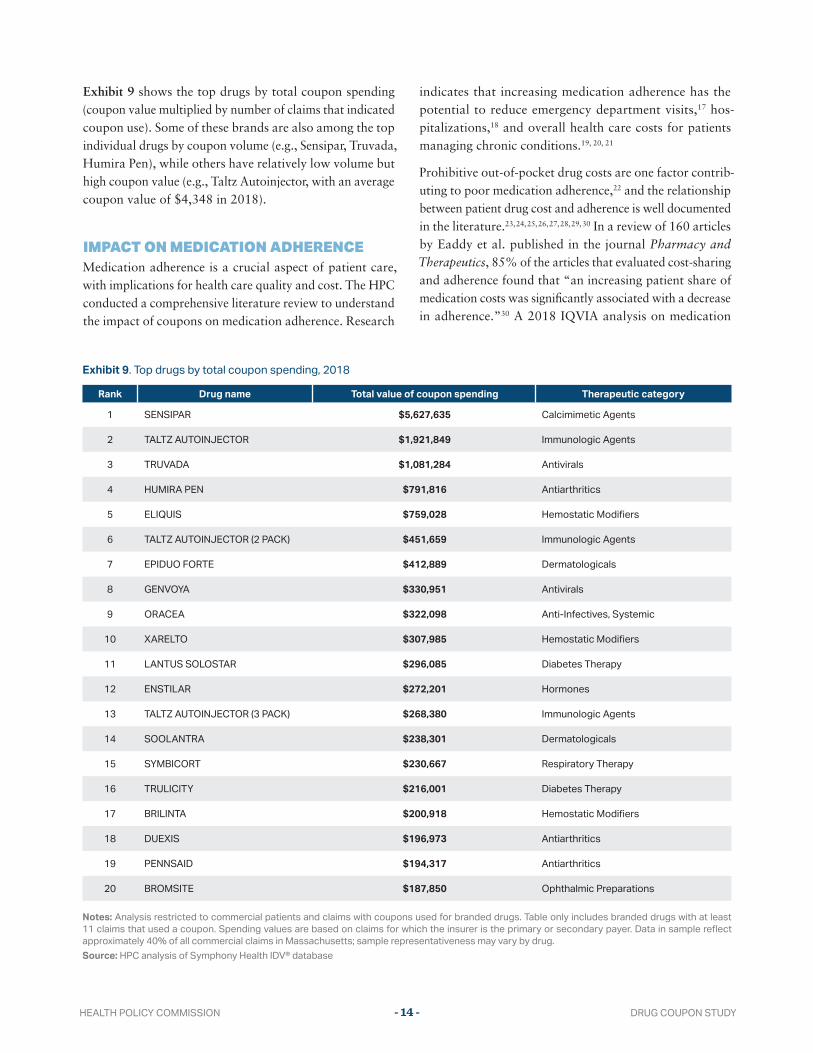
Exhibit 9 shows the top drugs by total coupon spending (coupon value multiplied by number of claims that indicated coupon use). Some of these brands are also among the top individual drugs by coupon volume (e.g., Sensipar, Truvada, Humira Pen), while others have relatively low volume but high coupon value (e.g., Taltz Autoinjector, with an average coupon value of $4,348 in 2018).
IMPACT ON MEDICATION ADHERENCEMedication adherence is a crucial aspect of patient care, with implications for health care quality and cost. The HPC conducted a comprehensive literature review to understand the impact of coupons on medication adherence. Research
indicates that increasing medication adherence has the potential to reduce emergency department visits,17 hos-pitalizations,18 and overall health care costs for patients managing chronic conditions.19, 20, 21
Prohibitive out-of-pocket drug costs are one factor contrib-uting to poor medication adherence,22 and the relationship between patient drug cost and adherence is well documented in the literature.23, 24, 25, 26, 27, 28, 29, 30 In a review of 160 articles by Eaddy et al. published in the journal Pharmacy and Therapeutics, 85% of the articles that evaluated cost-sharing and adherence found that “an increasing patient share of medication costs was significantly associated with a decrease in adherence.”30 A 2018 IQVIA analysis on medication
Rank Drug name Total value of coupon spending Therapeutic category
1 SENSIPAR $5,627,635 Calcimimetic Agents
2 TALTZ AUTOINJECTOR $1,921,849 Immunologic Agents
3 TRUVADA $1,081,284 Antivirals
4 HUMIRA PEN $791,816 Antiarthritics
5 ELIQUIS $759,028 Hemostatic Modifiers
6 TALTZ AUTOINJECTOR (2 PACK) $451,659 Immunologic Agents
7 EPIDUO FORTE $412,889 Dermatologicals
8 GENVOYA $330,951 Antivirals
9 ORACEA $322,098 Anti-Infectives, Systemic
10 XARELTO $307,985 Hemostatic Modifiers
11 LANTUS SOLOSTAR $296,085 Diabetes Therapy
12 ENSTILAR $272,201 Hormones
13 TALTZ AUTOINJECTOR (3 PACK) $268,380 Immunologic Agents
14 SOOLANTRA $238,301 Dermatologicals
15 SYMBICORT $230,667 Respiratory Therapy
16 TRULICITY $216,001 Diabetes Therapy
17 BRILINTA $200,918 Hemostatic Modifiers
18 DUEXIS $196,973 Antiarthritics
19 PENNSAID $194,317 Antiarthritics
20 BROMSITE $187,850 Ophthalmic Preparations
Notes: Analysis restricted to commercial patients and claims with coupons used for branded drugs. Table only includes branded drugs with at least 11 claims that used a coupon. Spending values are based on claims for which the insurer is the primary or secondary payer. Data in sample reflect approximately 40% of all commercial claims in Massachusetts; sample representativeness may vary by drug.Source: HPC analysis of Symphony Health IDV® database
Exhibit 9. Top drugs by total coupon spending, 2018

HEALTH POLICY COMMISSIONDRUG COUPON STUDY - 15 -
abandonment found that patients with higher out-of-pocket costs are less likely to fill a new prescription, especially when cost-sharing exceed $125. For example, the analysis found that 69% of new commercial patients did not initiate medication when their out-of-pocket costs exceeded $250.31 The $125-$250 threshold is consistent with findings from other studies on multiple sclerosis,26 oral oncology,32 and autoimmune drugs.33 A study by Padan et al. found that adherence to statins decreased by 2.2% for every $10 increase in cost-sharing.34
With respect to the impact of drug coupons on adher-ence, peer-reviewed literature suggests a modest increase in adherence when the cost of the drug as well as the value of the coupon are relatively small. Two studies focusing on cholesterol-lowering statins found that coupons moderately increased adherence rates. A 2013 study by Daugherty et al. found that new patients initiating a branded statin therapy with coupons had more refills during the first year of treatment (7.1 fills) than patients starting generic statins without coupons (6.3 fills) and those starting branded statins without using coupons (5.8 fills).35 The medication adherence rate was correspondingly higher among patients who used coupons for branded drugs (61.1%), compared to patients who used generic drugs (60.1%) and patients who did not use coupons for branded drugs (53.8%). However, the authors noted that these differences likely were not large enough to result in different clinical outcomes. Similarly, a 2017 study by Daubresse et al. using a longitudinal design found that coupon use was associated with slightly higher utilization, lower rates of abandonment, and less short-term switching to other statin products.36
In contrast, studies suggest that coupons may have larger effects on adherence for higher cost drugs. Using a large sample of specialty prescriptions, a 2014 Health Affairs study by Starner et al. found that drug coupons were asso-ciated with 44.3% of these prescriptions in 2013 and saved patients an average $1,069 per year, reducing the proportion of prescriptions for which patient cost-sharing was more than the key threshold for abandonment of $250 from 12% to 1%.37
For patients with Hepatitis C initiating Sovaldi, Karmarkar et al. found an abandonment rate of 4.1% when a patient’s cost-sharing liability was less than $250, compared to 7.2% when cost-sharing liability was between $250 and $10,000, and 51.7% for patients with $10,000 or more cost-sharing liability. The authors had access to coupon use only for a subset of these patients, so the abandonment rates reported
were based on the payer-required cost-sharing amounts, not coupon-adjusted cost-sharing that patients actually paid. For patients with known coupon use (14.7% of total study sample), the authors found that the coupon had an average value of $1,321, offsetting the patient’s cost-sharing responsibility by 98% and leaving an average cost-sharing of $28 for patients. Among these patients, there was no medication abandonment.38
A 2019 peer-reviewed study evaluating abandonment for ALK inhibitors for the treatment of non-small cell lung cancers found that patients with copay assistance had an 88.2% lower risk of non-initiation and 24.3% lower risk of discontinuation; however, this study included other discount cards and free-trial vouchers, in addition to copay coupons.39
Despite limitations in these studies (e.g., not explicitly linking coupon use with claims), evidence suggests that drug coupons increase medication initiation and adherence by reducing patients’ out-of-pocket costs. Greater impacts have been shown for patients using specialty medications with high cost burdens, indicating that the magnitude of the effect on medication adherence may be contingent on the value of the coupons, not the mere offering of coupons alone.
IMPACT OF COUPONS ON HEALTH CARE SPENDINGDrug coupons may influence consumer behavior through a number of different channels, such as:
• Patients may see television or magazine ads for a drug and coupon offering, and ask their doctor about the prescription. Recent research suggested that spending on direct-to-consumer prescription drug advertising spiked from $1.3 billion in 1997 to $6 billion in 2016.40 An FDA survey about pharmaceutical direct-to-consumer marketing found that 47% of physicians surveyed felt pressured to prescribe the specific brand-name drug when asked by a patient.41
• Physicians who are aware of the coupon offering through manufacturer representative promotional outreach (or
“detailing”) or through other means may prescribe the branded drugs to patients with the coupon use in mind. An industry study found that coupons have a “halo effect” on physician prescribing, meaning that physician awareness of a coupon program not only increases their prescribing of the brand drug for patients who need financial assistance, but also for what the study called “non-coupon patients,” such as patients who do not face high cost-sharing.42

DRUG COUPON STUDYHEALTH POLICY COMMISSION - 16 -
• Patients who have used a drug with coupons may con-tinue to use the branded drug even after the coupons are discontinued (e.g. because of generic entry), because they have developed brand loyalty and are wary of switching.
• Patients who want to choose between a branded drug and a generic alternative on the basis of lowest cost-sharing find that, with a coupon, the branded drug is cheaper than the generic.
• Patients prescribed a branded drug who first realize at the pharmacy counter that they have a high out-of-pocket expense learn from the pharmacist (or through their own research) that coupons can help with the expense. Had a coupon not been available, the patient might have left the pharmacy and talked to their physician about alternatives, filled the prescription but stretched its use, or abandoned the prescription.
The availability of drug coupons, and their potential influence on consumer behavior, may impact health care spending in various ways. Coupons may help patients initi-ate or continue a clinically necessary therapy that otherwise would be cost-prohibitive, resulting in higher adherence to needed medications. While higher drug utilization may increase drug spending, this increased drug spending may be potentially offset by lower spending on other medical ser-vices and improved patient health. Furthermore, higher net spending may be warranted to improve clinical outcomes.43 Coupons may also shift product choices and drive patients towards higher cost drugs when equally appropriate lower cost therapeutic alternatives may be available. For example, coupons for a branded acne treatment may reduce patient incentives to try a generic or over-the-counter option first. Accordingly, assessing the impact of drug coupons on total health care spending requires estimating the degree to which coupons influence patient use of a given branded drug over generic or branded alternatives, as well as evaluating
whether patients have a choice of alternatives for the drugs for which coupons are offered.
The following sections describe the HPC’s analysis of the impact of coupons on health care spending in Massachu-setts, focusing largely on estimating the impact for drugs that have generic close therapeutic substitutes.
CATEGORIZING DRUGS THAT OFFER COUPONSTo investigate the impact of drug coupons on spending, the HPC used a framework of four categories to classify branded drugs that offer coupons, based on prior literature (see Exhibit 10).44 These categories are:
1. Generic equivalent: Branded drugs that have AB-rated generic equivalents on the market that the FDA has deemed interchangeable with the branded version. Mas-sachusetts law prohibits the use of coupons on such drugs.
2. Generic close therapeutic substitute: Branded drugs that do not have generic equivalents on the market, but for which generic close therapeutic substitutes are available. Medications in the same class may not be equally effective or appropriate for all patients, but these alternatives would be appropriate for many patients.
3. Branded close therapeutic substitute: Branded drugs that have a branded close therapeutic substitute. The competitor drug may or may not also offer coupons. Medications in the same class may not be equally effec-tive or appropriate for all patients, but these alternatives would be appropriate for many patients.
4. No close therapeutic substitute: Branded drugs that do not have any close therapeutic substitutes. This category includes drugs that may be considered “orphan drugs” for the treatment of rare diseases, as well as certain drugs used for more prevalent conditions or indications that do not have similar competitors.
Example1
(Not applicable in MA)Generic equivalent
2Close therapeutic substitute:
Generic
3Close therapeutic substitute:
Branded
4No close therapeutic
substitute
Drug with coupon
Lipitor (statin; AB generic available)
Lyrica (nerve pain; no AB generic available)
Repatha (PCSK9; no AB generic available)
Kalydeco (cystic fibrosis; no AB generic available)
ComparatorAtorvastatin (generic Lipitor)
Gabapentin (generic Neurontin, another drug to treat nerve pain)
Praluent (another branded PCSK9)
None
Exhibit 10: Classification for branded drugs that offer coupons

HEALTH POLICY COMMISSIONDRUG COUPON STUDY - 17 -
Studies suggest that a majority of drugs that offer coupons have alternatives and at least half of drugs that offer coupons have a direct generic equivalent or a generic alternative. Ross et al. identified 374 branded drugs that offered coupons in 2013 using a large internet coupon repository and reported that 8.3% of the these drugs had a generic equivalent, and 53.5% had a “within-class” generic alternative.45 Van Nuys et al. examined the 200 drugs with the highest total spending in 2014 and identified 90 that offered coupons; of these, the study found that 21% had a generic equivalent, 28% had a generic close therapeutic substitute, and the remaining 51% had either only a branded close therapeutic substitute (39%) or no substitute (12%).44 While it is not known whether these studies are fully representative of the distribution of all branded drugs that offer coupons today, these data suggests that the majority of drugs that currently offer coupons in Massachusetts have close therapeutic substitutes.
BACKGROUND ON SPENDING IMPACT OF COUPONS FOR DRUGS WITH ALTERNATIVESWhile few studies have investigated the impact of drug coupons on utilization among alternatives, early research in this area suggests that coupons influence choice of drug and increase total spending. Dafny et al. focused on branded drugs with a coupon facing the market entry of a generic equivalent, and quantified the impact of coupons by com-paring the utilization of the branded drugs in Massachusetts (where coupons for these drugs cannot be used) and New Hampshire (where coupons for these drugs can be used).46 Among the 23 branded drugs studied, coupons were asso-ciated with a 3.4 percentage point reduction in the rate of
generic utilization, from 95% to 92% on average, which translated to an estimated excess spending of $6 million to $24 million per drug per year, or 1.2% to 4.6% higher total drug spending over five years. This study also found that drugs with coupons had higher price growth: prices for drugs with coupons grew an average 12% to 13% per year, compared to price growth of 7% to 8% per year for drugs without coupons. However, no studies were identified that estimated the impact of coupons for drugs with other types of alternatives (i.e. Categories 2 or 3 in Exhibit 10).
ANALYSIS OF IMPACT OF COUPONS FOR DRUGS WITH GENERIC CLOSE THERAPEUTIC SUBSTITUTESThe HPC studied the impact of coupons for drugs with generic close therapeutic substitutes (Category 2 in Exhibit 10) by comparing the utilization of branded drugs with coupons versus their generic alternatives in the Massachusetts com-mercial population with the utilization of the same drugs in the Massachusetts Medicare program, which prohibits the use of coupons in all circumstances and thus served as the
“control” group in the HPC study. If coupon availability leads to increased use of the branded drug for a given condition over generic alternatives, we would expect to see a higher ratio of use of the branded couponed drug in the commercial population compared to the Medicare population.
Exhibit 11 illustrates the dynamics in which drug coupons may affect patient choice, when patients are faced with a branded drug that offers coupons versus a generic close therapeutic substitute.
Exhibit 11. Hypothetical example illustrating financial incentives for patients choosing between a branded drug with a coupon and a generic close therapeutic substitute
$5
A
$10
B
Price: $500
DRUG A
Branded drugDRUG B
Generic close therapeutic substitute
Plan cost
WITHOUT
COUPON
WITH
COUPON
LOWER COST FOR
HEALTHCARE SYSTEM
PATIENT
NET COST
LOWER COST
FOR PATIENT
Patient
cost-sharing
liability
Coupon o�er
Total cost for the
healthcare system
$470
$30
$25
Price: $150
Plan cost
Patient
cost-sharing
liability
Total cost for the
healthcare system
$140
$10
A
B
B
B$30
A
$10
B
$475 $150
$5
A
$10
B
Price: $500
DRUG A
Branded drugDRUG B
Generic close therapeutic substitute
Plan cost
WITHOUT
COUPON
WITH
COUPON
LOWER COST FOR
HEALTHCARE SYSTEM
PATIENT
NET COST
LOWER COST
FOR PATIENT
Patient
cost-sharing
liability
Coupon o�er
Total cost for the
healthcare system
$470
$30
$25
Price: $150
Plan cost
Patient
cost-sharing
liability
Total cost for the
healthcare system
$140
$10
A
B
B
B$30
A
$10
B
$475 $150$5
A
$10
B
Price: $500
DRUG A
Branded drugDRUG B
Generic close therapeutic substitute
Plan cost
WITHOUT
COUPON
WITH
COUPON
LOWER COST FOR
HEALTHCARE SYSTEM
PATIENT
NET COST
LOWER COST
FOR PATIENT
Patient
cost-sharing
liability
Coupon o�er
Total cost for the
healthcare system
$470
$30
$25
Price: $150
Plan cost
Patient
cost-sharing
liability
Total cost for the
healthcare system
$140
$10
A
B
B
B$30
A
$10
B
$475 $150

DRUG COUPON STUDYHEALTH POLICY COMMISSION - 18 -
MethodsThe HPC compiled a list of branded drugs with the highest U.S. spending in 2014 as reported by Van Nuys et al.44 and supplemented the list with the top spending drugs in Mas-sachusetts identified in the APCD in 2016, the most recent year of data available at the time of the analysis, that were not already included on the Van Nuys list. The list was restricted to branded drugs with generic close therapeutic substitutes based on the categorization in Van Nuys et al. and analysis by the HPC’s pharmacist advisor. To confirm coupon offerings in past years, the HPC identified claims indicating coupon use in the Symphony data and verified coupon availability from historic, archived copies of drug brands’ websites or manufacturers’ websites using www.archive.org. This process resulted in 29 case study drugs for potential inclusion, before clinical exclusions were considered.
To compile the final selection of drugs for this analysis, the HPC filtered the 29 drugs through a number of demo-graphic and clinical factors that could influence prescribing patterns and thus mask or exacerbate the impact of coupon availability. Working in consultation with its pharmacist advisor and other clinical consultants, the HPC excluded drugs where underlying differences between the commer-cial and Medicare populations, such as age or age-related factors, could affect prescribing trends. For example, the HPC excluded the drug Exelon, which treats dementia caused by Alzheimer’s and Parkinson’s disease, due to potential differences in people with Alzheimer’s in the commercial population (i.e. early onset Alzheimer’s) as compared to the Medicare population. Additionally, the HPC excluded drugs that are considered first-line or other-wise have preferential treatment over their close substitutes based on clinical guidelines, as these drugs are likely to be appropriately prescribed more often than their alternatives, regardless of patient cost-sharing. The HPC also excluded drugs whose close substitutes are primarily sold over the counter since such drug utilization is not captured in the data sources. Dosage strength was also considered, and drugs were excluded in cases where different dosage strength may affect drug indication (for example, finasteride, the generic comparator to Avodart, is both a urinary retention medication and used to treat hair loss, but at different dosage strengths). Lastly, when determining comparability between a drug and its close substitutes, the HPC considered the route of administration (e.g., oral, injection, patch), which has implications for effectiveness and compliance.
For drugs that offer multiple routes of administration, the HPC included only the prescriptions with the same route of administration as their close substitutes. For example, if a branded drug was available in oral or injectable form and its close substitute is available only in oral form, the HPC included the number of branded fills in the oral form only. These criteria resulted in 14 branded drugs and their generic close therapeutic substitutes for analysis.
For each drug set, the HPC compared the utilization of the branded drug relative to its generic close therapeutic substitutes in the Medicare and commercial population. The hypothesis was that the relative utilization would be similar between the two groups if coupons had no impact on the rate of branded drug use. For each drug set, utilization trends were averaged for the two most recent applicable years of data between 2013 and 2017. For example, 2013 and 2014 data for Abilify and its generic close substitutes were used because the generic version of Abilify entered the market in 2015.
Data sourcesThe HPC used the publicly available Centers for Medicare and Medicaid Services (CMS) Part D Prescriber Public Use Files as the data source for Massachusetts Medicare pre-scription drug utilization. These files provide national and state-specific aggregated drug information at the branded and generic name level, and include data from both stand-alone Medicare Part D plans and Part D components of Medicare Advantage plans. For each drug, the files provide the number of claims, as well as the number of standard-ized 30-day fills – a standardized measure that captures the varying quantity of drugs in each claim (e.g., 30-day or 60-day supply). The latest available year for this data at the time of analysis was 2017.
The source for Massachusetts commercial prescription drug utilization was the Symphony data. These data are at the claim and the national drug code (NDC) level. The NDC code is a product identifier that corresponds to a molecule(s), manufacturer, and specific dosage strength, dosage form, and package size of a drug. The HPC aggregated these data to the brand and generic name level in order to match the structure of the Medicare data. For comparability to the Medicare data, a measure of 30-day fills was derived using the number of days supplied information on each claim divided by 30.

HEALTH POLICY COMMISSIONDRUG COUPON STUDY - 19 -
Utilization resultsThe analysis included 14 sets of drugs across a range of ther-apeutic classes, listed in Exhibit 12. Results are presented as a ratio of standardized 30-day fills of the branded drug to fills of the generic close therapeutic substitutes com-bined. An example calculation is provided in Exhibit 13: the ratio indicates that, while the use of generic warfarin
far exceeded the use of Eliquis in both commercial and Medicare populations, the relative use of Eliquis in the commercial population was nearly twice as high as in the Medicare population. Results for all 14 sets of drugs are included in the Technical Appendix.
Branded drug Generic name Therapeutic class Generic close therapeutic substitutes
Eliquis apixaban Hemostatic modifiers warfarin
Otezla apremilast Antiarthritics methotrexate, leflunomide, sulfasalazine, azathioprine
Abilify aripiprazole Psychotherapeutic drugs risperidone, paliperidone, olanzapine, quetiapine, ziprasidone
Aggrenox aspirin/dipyridamole Hemostatic modifiers clopidogrel, warfarin
Benicar olmesartan medoxomil Vascular agents losartan potassium, losartan hydrochlorothiazide, irbesartan
Crestor rosuvastatin calcium Antihyperlipidemic agents simvastatin, atorvastatin, pravastatin
Dexilant dexlansoprazole Gastrointestinal pantoprazole, omeprazole, omeprazole bicarb, lansoprazole, esomeprazole
Effient prasugrel hcl Hemostatic modifiers clopidogrel, warfarin
Latuda lurasidone hcl Psychotherapeutic drugs risperidone, paliperidone, olanzapine, quetiapine, ziprasidone
Lyrica pregabalin Neurological/neuromuscular disorders
gabapentin
Nuvigil armodafinil Psychotherapeutic drugs modafinil
Pristiq desvenlafaxine succinate Psychotherapeutic drugs venlafaxine, citalopram, escitalopram, fluoxetine, paroxetine, sertraline
Vesicare solifenacin succinate Genitourinary oxybutynin
Vytorin ezetimibe/simvastatin Antihyperlipidemic agents simvastatin, atorvastatin, pravastatin
Drug Number of 30 day fills ( average of 2016 and 2017 )
Medicare Commercial
Eliquis (branded drug with coupon) 146,979 21,040
generic warfarin (close therapeutic substitute) 716,237 57,239
Relative utilization of Eliquis and generic warfarin 0.21 (146,979/716,237)
0.41 (21,040/57,239)
Source: HPC analysis of Symphony Health IDV® database and CMS Part D Prescriber Public Use Files. Symphony data reflect approximately 40% of all commercial claims in Massachusetts; sample representativeness may vary by drug.
Exhibit 12. List of branded drugs that offer coupons and their close therapeutic substitutes
Exhibit 13: Relative utilization of Eliquis and generic warfarin in the Massachusetts commercial and Medicare populations

DRUG COUPON STUDYHEALTH POLICY COMMISSION - 20 -
Exhibit 14 shows the utilization trends for the 14 drug sets. The magnitude of difference varied, ranging from relative commercial use of the branded drug being more than twice as high as in Medicare (Nuvigil), to relative commercial use of the branded drug being slightly lower than in Medi-care (Aggrenox). Overall, the relative use of the branded drug versus generic close therapeutic substitutes was higher (defined as at least 25% higher) in the commercial popula-tion for 10 of the 14 branded drugs studied. For 4 branded drugs, use trends were similar in commercial and Medicare populations. Although the rate of coupon use among these 14 drugs varied considerably, it was generally higher among the 10 cases with higher commercial utilization than the 4 cases with similar use (data included in Technical Appendix).
Spending implicationsThe HPC estimated the impact of coupon programs on health care spending when branded drugs have generic alternatives. Using the relative difference in utilization of the 14 study drugs, we calculated what spending would be for the Massachusetts commercial market if utilization patterns mirrored those among Medicare beneficiaries. Holding constant the total volume of commercial fills of the branded drug plus generic alternatives, we assumed that the commercial share of utilization for the branded drug would equal the Medicare share. If there were multiple generic close therapeutic substitutes, we assumed that the relative distribution of the generic close therapeutic substitutes in the commercial population would remain the same. Drug
prices were sourced from the Symphony data. To account for manufacturer rebates, which are not reflected in the Symphony data, the HPC applied a rebate of 11% for the branded drugs, based on average annual pharmaceutical rebates in the Massachusetts commercial market from 2015-2017.47 An example calculation using Eliquis and warfarin is provided below in Exhibit 15.
0.0
0.1
0.2
0.3
0.4
0.5
0.6
Aggrenox (
2013, 2014)
Vytorin
(2015, 2
016)
Lyric
a (2016, 2
017)
Pristiq
(2015, 2
016)
Dexilant (2
015, 2016)
Otezla
(2016, 2
017)
Benicar (2014, 2
015)
Cresto
r (2014, 2
015)
Latuda (2
016, 2017)
E�ent (2015, 2
016)
Vesicare (2
016, 2017)
Abilify (
2013, 2014)
Eliquis
(2016, 2017)
Nuvigil (
2014, 2015)
Ra
tio
of
bra
nd
ed
pre
sc
rip
tio
ns
to
pre
sc
rip
tio
ns
for
ge
ne
ric
clo
se
th
era
pe
uti
c s
ub
sti
tute
s
Medicare Commercial
Notes: For each case study drug, use trends are averaged for the two most recent years of appli-cable data. Similar use defined as within 25%.Source: HPC analysis of Sym-phony Health IDV® database and CMS Part D Prescriber Public Use Files
Notes: Spending analysis includes rebate estimate based on average rebate in the commercial market 2015-2017 from the Center for Health Information and Analysis.Source: HPC analysis of Symphony Health IDV® database and CMS Part D Prescriber Public Use Files
Exhibit 14. Relative utilization of branded drug versus generic close therapeutic substitutes in commercial and Medicare populations
Exhibit 15: Annual commercial spending with current commercial utilization ratio of Eliquis and warfarin versus alternative scenario with Medicare utilization ratio
$5,936,111
$645,785
$3,473,759
$745,586
$6.6M
Observed spending per year
(Commercial utilization)
Alternative spending per year
(Scenario: If commercial population had Medicare utilization)
$4.2M
TOTAL SPENDING IMPACT
$2.4M
Warfarin
Eliquis
$5,936,111
$645,785
$3,473,759
$745,586
$6.6M
Observed spending per year
(Commercial utilization)
Alternative spending per year
(Scenario: If commercial population had Medicare utilization)
$4.2M
TOTAL SPENDING IMPACT
$2.4M
Warfarin
Eliquis
$5,936,111
$645,785
$3,473,759
$745,586
$6.6M
Observed spending per year
(Commercial utilization)
Alternative spending per year
(Scenario: If commercial population had Medicare utilization)
$4.2M
TOTAL SPENDING IMPACT
$2.4M
Warfarin
Eliquis

HEALTH POLICY COMMISSIONDRUG COUPON STUDY - 21 -
Across the 14 cases, spending was 18% higher on average per drug than it would have been if commercial members used the generic close therapeutic substitutes as often as the Medicare population did, which translates to approx-imately $1.4 million in additional spending per drug per year in our data sample.v Extrapolating these results to the entire commercial market in Massachusetts (the Symphony data represents roughly 40% of the commercial market), the HPC estimated that the spending impact would be an excess of approximately $3 million per drug per year, and $44.8 million total per year, for the 14 study drugs.
Overall, for branded drugs with coupons that have generic close therapeutic substitutes, coupon availability was asso-ciated with moderately higher utilization of the branded drugs, relative to use of the generic substitutes, and higher total spending.
LimitationsWhile the selection of drugs for the case studies was intended to isolate the impact of coupon availability on utilization, other factors may also have contributed to the higher brand use we observed in the commercial population. For example, the HPC’s analysis did not control for any differences in plan design, such as patient cost-sharing amounts, between commercial and Medicare prescription drug coverage. This area warrants further study.
Also, there are many more cases of branded drugs with coupons that have generic close therapeutic substitutes. The HPC estimated that there could be as many as 247 branded drugs that offer coupons and have generic close therapeutic substitutes in Massachusetts.vi However, many factors influence the degree to which coupons influence patient use of a given drug (e.g., cost-sharing, coupon value,
v See Technical Appendix for spending impacts for each case study.
vi Estimate is based on the number of drugs that offered coupon programs in Massachusetts in 2018 from the Symphony Health IDV® database and the percentage of couponed drugs (without direct generic equivalents) that have generic close therapeutic substitutes, as reported by Van Nuys et al.
the availability and prices of generic alternatives) and the impact on spending (e.g. difference in price between brand drug and generic alternative, volume of prescriptions), and it is unclear if results from the 14 cases are representa-tive of all couponed drugs with generic close therapeutic substitutes. Therefore, we do not extrapolate our results to other drug cases in this category. Further research is needed to estimate the total impact of coupons on health care spending in Massachusetts.
IMPACT OF COUPONS ON UTILIZATION OF ALTERNATIVE BRANDED DRUGSThe HPC determined that analyzing the impact of cou-pons on use of alternative branded drugs (Category 3 in Exhibit 10) was not currently feasible due to the complexities and lack of transparency in branded drug pricing. Branded drug pricing frequently involves rebates. Manufacturers may offer rebates to payers and PBMs that substantially lower the net price of branded drugs to the payer, particularly in scenarios where branded drugs have competitors, as payers and PBMs tend to offer more favorable formulary placement in exchange for larger rebates. However, rebate amounts for individual drugs are confidential between payers and manufacturers. Without rebate information, payer formulary placement and associated patient cost-sharing can appear irrational. For example, in the case of SGLT2 inhibitors (used to control high blood sugar for people with Type 2 diabetes) shown in Exhibit 16, patients appear to have the highest out-of-pocket responsibilities for the lowest cost drug, but the price for payers and PBMs net of rebates is unknown. Without information on brand-specific rebates, the HPC is unable to isolate the impact of coupons between two brand competitors on utilization and spending. These challenges highlight the need for greater transparency in drug pricing.
FOR CLAIMS THAT USED A COUPON
Drug name Insurer payment Patient OOP responsibility Coupon value Patient net OOP
Farxiga $467 $122 $87 $36
Invokana $485 $89 $84 $5
Jardiance $526 $85 $69 $16
Notes: OOP = out-of-pocketSource: HPC analysis of Symphony Health IDV® database
Exhibit 16. Payer price, patient out-of-pocket responsibility, coupon value and patient net out-of-pocket spending for SGLT2 inhibitors for claims that used a coupon, 2018

DRUG COUPON STUDYHEALTH POLICY COMMISSION - 22 -
IMPACT OF COUPONS ON UTILIZATION FOR DRUGS WITH NO CLOSE THERAPEUTIC SUBSTITUTESThe HPC did not quantify the impact of coupons for branded drugs with no close therapeutic substitutes (Cat-egory 4 in Exhibit 10). These drugs can encompass a broad range of scenarios and potential for lower cost alternatives. Drugs with no close therapeutic substitutes may be the only approved drugs that target certain conditions or subpopu-lations, such as Dysport, the only treatment for lower limb spasticity in pediatric cerebral palsy patients. This category may also include more narrow definitions, such as a drug with a unique route of administration. For example, Van Nuys et al. classifies Nuvaring as having no close therapeutic substitutes since it is the only vaginal ring form of con-traception, although many alternative forms of hormonal birth control are available to patients. A unique route of administration may be a necessity for some patients, while others could safely use lower cost alternatives. Therefore, coupons could discourage use of lower cost alternatives even in some cases of branded drugs with no close therapeutic substitutes; in other cases, no alternatives may exist for a given individual patient or type of patient.
In cases for drugs with no lower cost alternatives, patients with high out-of-pocket responsibility may experience affordability challenges for these drugs, and some patients may forgo the medication. Coupons may increase patient access and adherence to needed medications by reducing their out-of-pocket costs. In some cases, the additional drug spending involved in higher medication adherence may be offset by lower rates of hospitalizations and emergency department visits, but the net impact to total health care spending attributable to coupon programs is difficult to estimate.
Testimony presented during the public listening session and submitted to the HPC underscored the financial benefit of coupons to patients who rely on drugs in this category. For example, patient advocates from the hemophilia community described the tremendous costs of clotting factor drugs and their reliance on coupons and other copay assistance programs to ensure access. Testifying on behalf of the New England Hemophilia Association and New England Bleeding Disorder Advocacy Coalition, a patient advocate explained that her family has a $9,000 out-of-pocket annual maximum and, with the cost of her son’s medication for severe hemophilia A reaching $350,000 a year, she relies on coupons to cover the cost of her son’s medication and
spread out-of-pockets costs across the plan year until the out-of-pocket maximum is met. She noted that the medi-cation she uses to manage her own mild hemophilia does not have a coupon, and she sometimes postpones refilling it for financial reasons until the family meets the out-of-pocket maximum. The Massachusetts Society of Clinical Oncologists also submitted testimony supporting the use of coupons for drugs that have no generic or lower-cost substitutes: “We see the heartbreaking financial decisions many of our patients face in struggling to afford their needed cancer fighting drug regimen. We often struggle to find support systems to help them…We are seeing more and more use of the coupon voucher program to fill this need and allow these patients a life altering treatment that has been profound.”
IMPACT OF COUPONS ON PREMIUMS AND THE GICAs described above, the HPC used a conservative case study approach to estimate the impact of coupons on utilization of generic alternatives. The excess spending attributable to coupons for the 14 drugs studied totaled $44.8 million per year, representing 0.2% of total commercial spending in Massachusetts in 2018.vii Using those findings, the HPC estimates that, for an average premium in the Group Insur-ance Commission (GIC), approximately $18 of the annual single premium and $52 of the annual family premium could be attributed to the availability of coupons for these 14 drugs.viii However, this calculation excludes the financial impact of coupons on the much larger number of drugs with generic alternatives not included among the 14 drugs, drugs with lower cost branded alternatives, and drugs with no alternatives. An estimate of the impact of coupons on premiums that accounted for these factors would likely be substantially larger.
COUPON EXPIRATIONOne stated concern about prescription drug coupons is that they may not be available indefinitely, leaving patients with chronic conditions facing higher cost-sharing once the coupon programs end. However, when patients become
vii Based on CHIA’s estimate of $23.3 billion commercial spending in Massachusetts in 2018.
viii Calculations are based on Massachusetts premiums for all employ-er-sponsored insurance from AHRQ’s Medical Expenditure Panel Survey, but data from the Center for Health Information and Analysis suggests that GIC premiums are roughly the same as overall employer-sponsored insurance premiums in Massachusetts.
HEALTH POLICY COMMISSIONDRUG COUPON STUDY - 23 -
stabilized on a particular high cost product, they may develop loyalty to that product or may be unable to tran-sition to a lower cost alternative without risk of adverse consequences. Van Nuys et al. researched 90 top spend-ing brands that offered coupons in 2014, and found that approximately half included a limit for the duration of the program, the maximum of number of uses, or an expira-tion date.44
Data are not available on the share of coupon programs that have such limitations in Massachusetts. Representa-tives for manufacturers and other stakeholders described a range of factors in determining the benefit design of coupon programs, including targeting copayment values to support adherence and with consideration for typical formulary coverage. Stakeholders noted that coupon pro-grams may change in response to new market entrants and where the drug is in its lifecycle. They stated that the annual maximum benefit for coupons are often based on typical patients’ out-of-pocket maximum, after which costs are covered at 100% by the plan for the remainder of the plan year. In other cases, the duration of the program or the maximum number of uses may correspond to a course of treatment: for example, Gilead’s 2019 coupon program for Sovaldi covers the patient’s out-of-pocket costs for Sovaldi prescriptions up to a maximum of 25% of the list price of a 12-week regimen of Sovaldi; the offer is valid for 6 months from the time of first redemption.48 For chronic medications, some programs are designed to provide patients with copay assistance for every fill, while others are offered as free trials lasting anywhere from two weeks to three months, after which the undiscounted price will resume. This latter type of coupon design may present the most affordability challenges for patients who develop loyalty to the product.
Stakeholders reported that while programs may include an expiration date, they are often set at the end of the cal-endar year, which aligns with insurance policies that run from January to December with deductibles and annual maximums resetting each year in January. According to manufacturers, expiration dates are set so that patient eligibility for the program (e.g., not receiving government funded insurance) can be verified each year, and programs are typically renewed in the new year without interruptions to patient access.
To assess the durability of coupon programs year over year, the HPC evaluated the share of drug brands that offered coupons in Massachusetts in 2013 and still maintained
coupon programs in 2018, using the Symphony data. We excluded drugs that were discontinued in the U.S. or cases where a coupon program appeared to have been discon-tinued after the product was sold to another company. Of drugs that offered a coupon program in 2013, about 6% appeared to have discontinued their program by 2018 in Massachusetts without a generic equivalent entering the market. While more information is needed on coupon pro-gram limitations and their impact on patients, the majority of coupon programs for drugs without generic equivalents appear to be available year over year for patients.
OTHER POLICY ISSUES
USE OF COPAY ACCUMULATORS IN COMMERCIAL PLANSIn recent years, as a response to the growth in prescrip-tion drug coupon use, some commercial payers and their PBMs have implemented copay accumulator programs, also known as accumulator adjustment programs.49, 50 Typically, commercial payers apply the value of drug coupons to a patient’s deductible and annual out-of-pocket maximum, as if the patient had paid the coupon value themselves. With a copay accumulator, a patient can still use coupons to reduce or eliminate their cost-sharing for a given pre-scription but the coupon value does not count toward the patient’s deductible or out-of-pocket maximum. Because the coupon value does not count towards these limits, it is more likely that patients will reach the maximum coupon value allowed under the terms of the coupon program. If patients reach this annual coupon maximum, they must pay their full cost-sharing responsibility for the medication until they reach their deductible or out-of-pocket maximum.ix As a result, copay accumulators shift costs from the payer to the patient and to the manufacturer.
The HPC does not have data on the prevalence of com-mercial copay accumulator programs in Massachusetts. However, the use of copay accumulator programs appears to be increasing nationwide. According to a survey of 49 plans and PBMs with 147 million covered lives, 34% of commercially-insured patients in 2018 were covered by
ix An example illustrating patient, payer, and manufacturer spending with a copay accumulator program can be found at Fein A. Copay accumulators: Costly Consequences of a New Cost-Shifting Phar-macy Benefit. Drug Channels [blog]. Jan 3, 2018. Available at: https://www.drugchannels.net/2018/01/copay-accumulators-cost-ly-consequences.html

DRUG COUPON STUDYHEALTH POLICY COMMISSION - 24 -
payers that have implemented copay accumulators.x Addi-tionally, the survey found that another 28% of patients are enrolled in plans that plan to implement these programs in 2019 and beyond.
The impact of copay accumulators is unclear. Due to the complexity of copay accumulator programs, they are unlikely to encourage patients to use lower cost alterna-tives. Copay accumulators shift costs from the payer to the manufacturer and patient, potentially resulting in lower premiums. However, copay accumulators may preserve the affordability challenges that patients originally faced in their plan design, which could lead to lower access and adherence. In addition, these programs may increase administrative complexity for payers and PBMs and add confusion to patients navigating an increasingly complicated health care system.51, 52
A number of states have banned copay accumulators and others have proposed legislation to do so, as later sections in this report describe. In April 2019, CMS finalized a rule that would allow commercial payers selling on exchanges to implement copay accumulator programs to prevent cou-pons from applying to a patient’s out-of-pocket maximum in cases where a generic drug is available.53 However, some legal analysts question the legality of copay accumulator programs: depending on the specific design, these programs could implicate privacy rules under the Health Insurance Portability and Accountability Act (HIPPA), consumer pro-tection laws, and nondiscrimination rules under state laws.54
HIGH COST GENERIC DRUGSMassachusetts law prohibits the use of coupons for branded drugs when an AB-rated generic becomes available. This provision effectively mitigates the negative impacts of coupons on generic utilization and excess spending demon-strated in Dafny et al.46 However, in circumstances where a direct generic equivalent is introduced at a high price,
x Zitter Health Insights found that of the 34% of patients covered by payers that have implemented copay accumulators, 6% of commercial patients were covered by plans that also had copay maximizer programs. Copay maximizers are a variation of copay accumulator programs. Under such programs, the payer increases a drug’s cost-sharing to approximate the maximum value offered by a coupon program so that the payer can deplete the full amount offered by the manufacturers. Payments covered by coupons also do not count toward a patient’s deductible or out-of-pocket maximum. Source: Fein A. Copay Accumulator Update: Widespread Adoption as Manufacturers and Maximizers Limit Patient Impact. Drug Chan-nels [blog]. Dec 17, 2018. Available at: https://www.drugchannels.net/2018/12/copay-accumulator-update-widespread.html
patients with high cost-sharing or deductibles may find the generic unaffordable.
For example, the average price of branded Gleevec (oral chemotherapy drug used in the treatment of leukemia) was $10,039 per prescription in 2015, according to HPC analysis of the Symphony data. A small share of claims indicated coupon use in 2015, with an average coupon value of $871 per claim, leaving patients who used a coupon with an average $11 in out-of-pocket payment, and payers paid $9,157 per claim. In 2016, generic Gleevec entered the market and coupons for Gleevec could no longer be used in Massachusetts. However, with prices averaging approximately $8,000 per claim, generic Gleevec presents affordability challenges for patients with high deductibles or coinsurance.
High cost generics are not limited to the specialty drug field. In late 2018, a generic version of Mylan’s EpiPen entered the market after much public anticipation, yet it remained unaffordable for many patients due to its high price, according to media reports.55 The HPC was not able to estimate the average cost-sharing for generic EpiPen products due to lack of data availability. However, a search on the Massachusetts Health Connector website showed that several plans require a $50 copay after deductible for a generic EpiPen prescription (epinephrine 0.5mg/ml autoinjector). Additionally, while the majority of plans on the Connector steered patients towards generic EpiPen through lower cost-sharing, or excluding branded EpiPen from formulary, several plans had similar cost-sharing requirements for the generic and branded versions. One possible explanation for the similar cost-sharing is that plans may be receiving rebates for the branded version that make the net cost similar for plans.
Furthermore, a single source generic version of Truvada is expected to enter the market in September 2020, but high prices are expected for at least a few years after its entry until multiple generic competitors may result in lower prices.56 Truvada is used for the prevention of HIV trans-mission and had the highest coupon use in 2018 of any drug in Massachusetts. In 2019, the U.S. Preventive Services Task Force gave pre-exposure prophylaxis (PrEP) a grade A recommendation, meaning most private insurers are now obligated to cover the medication at no cost to their members. Under the ACA, most private health plans are required to cover preventative services for which the task force grants an “A” or “B” rating. This designation will

HEALTH POLICY COMMISSIONDRUG COUPON STUDY - 25 -
likely mitigate the public health implications that could have stemmed from generic Truvada being unaffordable for some patients.
In some cases, even having multiple generic competitors may not result in low generic drug prices. In May 2019, Attorney General Maura Healey joined a suit with attorneys general from more than 40 states alleging a widespread conspiracy between 20 major drug makers to inflate and manipulate prices for more than 100 different generic medications that treat conditions including diabetes, cancer, multiple sclerosis, HIV/AIDS, and epilepsy.57 The complaint alleges that the companies drove up prices for certain drugs by more than 1,000%.
While the generic exclusion for coupon use in Massachusetts soundly protects against higher spending for equivalent prod-ucts, examples of high-priced generic drugs highlight the need for payers, PBMs, and manufacturers to work together to ensure access, particularly for financially vulnerable patients.
ACTIVITY IN OTHER STATESA number of states have recently passed legislation or are currently considering bills regarding drug coupons. Most bills focus on prohibiting copay accumulators, with the effect of supporting coupon use. In March 2019, Virginia and West Virginia became the first states to ban copay accumulator programs; however, these laws only apply to plans sold on the individual market and not other com-mercial plans.58 Kentucky, Pennsylvania, and New York are currently considering similar bills that would prohibit payers and PBMs from using copay accumulator programs. Arizona passed legislation mandating that payers count the value of coupons toward deductibles and out-of-pocket maximums in cases where a branded drug does not have a generic equivalent available or if the patient obtains permission from the payer to use the brand name version.59
Other states are considering other policies that regulate prescription drug coupons. In 2017, California passed restrictions prohibiting use of coupons for drugs with direct generic equivalents, adopting the restriction in place in Massachusetts.60 New Jersey and New Hampshire have pro-posed similar legislation that would prohibit manufacturers from offering coupons for drugs that have FDA-approved generic equivalents. Rhode Island has filed a bill to require manufacturers to publish a message that a generic alternative may be available at a lower price on drug coupons and any accompanying advertisements and websites.59
SUMMARY AND POLICY CONSIDERATIONSPolicy questions regarding drug coupons reflect a tension between goals of preventing excess spending and supporting patient access. The HPC’s research concludes that drug coupons increase utilization and spending for a number of drugs with lower cost generic alternatives that would be clinically appropriate for many patients, with implica-tions for higher premiums. However, there are also cases where patients with commercial insurance cannot afford clinically necessary medication due to high drug prices and the cost-sharing design of their plans. In these cases, drug coupons provide financial relief and likely improve adherence, leading to better clinical outcomes.
Continued growth in high deductible plan enrollment, coupled with increasing drug prices, suggests that patient affordability challenges will only increase. The problem of drug affordability is worse now than it was before 2012. Eliminating the availability of coupons at this time – without substantial protections for patient affordability – would likely create serious challenges for many patients in the Commonwealth. Based on HPC’s analysis of prescription drug coupon use in Massachusetts, the sections below provide policy considerations to address the impact of drug coupons on the Commonwealth’s cost containment goals.
POLICY CONSIDERATIONSPublic reporting and oversightMultiple data limitations detailed in this report underscore the lack of transparency in drug coupon programs and in branded drug pricing in general. Additional transparency is needed to fully assess the value of coupon programs and the impact on health care spending. Specific elements for greater transparency include coupon use and value, disbursement channels, and notification when coupon programs are terminated. Coupon programs may change over time with changes in the pharmaceutical market land-scape, benefit design, and technology. Greater transparency will allow regulators to monitor and respond to potential developments in coupon programs. Policymakers should consider increasing transparency and accountability in coupon programs, including requiring manufacturers to report key elements to the Center for Health Information and Analysis. Across all elements of public reporting, data should be stratified by demographic information – such as age, race, gender, and income – to better understand the impact of coupons on health equity.

DRUG COUPON STUDYHEALTH POLICY COMMISSION - 26 -
Payer and employer strategies to support high-value drug useTo support patient use of high-value drugs, payers should provide transparent price information for prescribers and patients. When patients first learn their cost-sharing at the cash register of the pharmacy, they are least able to learn about potential alternatives. Payers and PBMs should increase efforts to equip patients and prescribers with information to make decisions between alternative drugs during the clinical visit where a drug is prescribed. Ideally cost-sharing would be integrated with the patient’s medical records, but at a minimum, updated formulary information should be available online.
However, patient cost-sharing can be unaffordable, even for high-value drugs. Payers and employers should consider plan design options to support patient access by minimizing financial barriers to medically necessary care. Such plan design options may include always offering one high value drug option on the lowest tier of cost-sharing when there are multiple therapeutic options; passing along rebates at the point of sale to patients; eliminating cost-sharing on preventative drugs such as insulin; and allowing patients to spread out-of-pocket costs for chronic medications across the year as monthly responsibilities, rather than incurring all of the costs at the beginning of the plan year. While some of these options may be expected to have an impact on premiums, they serve to moderate affordability of med-ications for patients. Further study on these options can inform strategies to address affordability of both premiums and medications.
Prescriber educationProviders should disseminate information to prescribers and adopt system technology to alert prescribers on appropriate drug alternatives. A growing number of U.S. hospitals have imposed guidelines that limit sales calls and “detailing” from pharmaceutical representatives,61 and such restrictions have been shown to decrease prescribing of detailed drugs62 and inappropriate off-label use.63 Conversely, as prescrib-ers continue to be exposed to coupon offerings through new channels and technology, limiting pharmaceutical representatives’ access to clinicians may be considered in conjunction with other strategies. For example, academic detailing – clinical education programs conducted with clinicians to encourage evidence-based practices – has been shown to improve prescribing practices.64
Strategies to address high drug pricesAlongside a shift towards greater patient cost-sharing in plan design, the expansion and uptake of drug coupon programs reflect a fundamental problem of high drug prices. Policymakers may consider a range of strategies to address high drug prices, including high launch prices and price increases. Policymakers may also consider approaches that specifically target the higher spending attributable to cou-pons. Such strategies could include, for example, requiring manufacturers to provide additional rebates to plans or otherwise provide funding to account for the higher health care spending associated with coupon programs for certain drugs. Alternatively, penalties assessed on manufacturers for excessive drug price increases could be used to support protections for patients who must pay high prices for drugs or to support lower copayments for certain drugs.
In summary, strategies that involve all stakeholders are nec-essary to meet goals of affordability, access, and sustainable health care spending in the Commonwealth.

HEALTH POLICY COMMISSIONDRUG COUPON STUDY - 27 -
REFERENCES1 IQVIA Institute for Human Data Science. Medicine
Use and Spending in the U.S. May. 2019. Available at: https://www.iqvia.com/insights/the-iqvia-institute/reports/medicine-use-and-spending-in-the-us-a-review-of-2018-and-outlook-to-2023.
2 Blue Cross Blue Shield. Rising Costs for Patented Drugs Drive Growth of Pharmaceutical Spending in the U.S. May. 2017. Available at: https://www.bcbs.com/the-health-of-america/reports/rising-costs-patent-ed-drugs-drive-growth-pharmaceutical-spending-us.
3 Johnson CY. Secret Rebates, Coupons and Exclusions: How the Battle over High Drug Prices is Really being Fought. The Washington Post. May 12, 2016. Available at: https://www.washingtonpost.com/news/wonk/wp/2016/05/12/the-drug-price-arms-race-that-leaves-patients-caught-in-the-middle/.
4 Wheeler C. Optimizing Your Co-pay Offset Program Strategy: Metrics to Measure for Success. Zitter Health Insights. 2013. Available at: http://zitter.com/wp-content/uploads/2017/05/Optimizing_Your_Co_Pay_Offset_Pro-gram_Strategy___Metrics_to_Measure_for_Success.pdf.
5 Pharmaceutical Executive Editors. Copay Cards and Cou-pons: Letting the Facts Get in the Way. Pharmaceutical Executive. Jan 1, 2012. Available at: http://www.pharmexec.com/copay-cards-and-coupons-letting-facts-get-way.
6 The Institute for Patient Access. Co-pay coupon fast facts. Aug, 2017. Available at: http://1yh21u3c-jptv3xjder1dco9mx5s.wpengine.netdna-cdn.com/wp-content/uploads/2013/08/IfPA_Co-Pay_Coupons_Fast-Facts_August-2017.pdf.
7 Mulcahy AW, Eibner C, Finegold K. Gaining Coverage through Medicaid or Private Insurance Increased Prescrip-tion Use and Lowered Out-of-Pocket Spending. Health Affairs. 2016 Sep 1;35(9):1725-33. Available at: https://www.healthaffairs.org/doi/full/10.1377/hlthaff.2016.0091.
8 Dusetzina S. Share of Specialty Drugs in Commercial Plans Nearly Quadrupled, 2003–14. Health Affairs. 2016 Jul 1;35(7):1241-6. Available at: https://www.healthaffairs.org/doi/full/10.1377/hlthaff.2015.1657.
9 Congressional Research Service. Prescription Drug Discount Coupons and Patient Assistance Programs (PAPs). Jun 15, 2017. Available at: https://crsreports.congress.gov/product/pdf/R/R44264/5.
10 Department of Health and Human Services, Office of Inspector General. Manufacturer Safeguards May not Prevent Copayment Coupon Use for Part D Drugs. Sep. 2014. Available at: https://oig.hhs.gov/oei/reports/oei-05-12-00540.pdf.
11 ConnectiveRx. Copay Coupon Distribution Channel Effectiveness and Preference. 2017. Available at: https://www.connectiverx.com/resource/copay-coupon-distribu-tion-channels-effectiveness-and-preference-seeking-a-deep-er-understanding-of-copay-offer-delivery/.
12 McKesson. eVoucherRx: Prescription Co-Pay Assistance Program for Pharmacies. Available at: https://www.mckesson.com/pharmacy-management/patient-care/automatic-copay-assistance/.
13 Sperber B. With Coupons, Pharma is Saying “Let’s Make a Deal” to Consumers. Pharmaceutical Commerce. Nov 14, 2011. Available at: https://pharmaceuticalcommerce.com/brand-marketing-communications/with-coupons-pharma-is-saying-lets-make-a-deal-to-consumers/.
14 Center for Health Information and Analysis. Performance of the Massachusetts Health Care System, Annual Report. Oct. 2019. Available at: http://www.chiamass.gov/annual-report/.
15 U.S. Agency for Healthcare Quality, Medical Expendi-ture Panel Survey. Available at: https://meps.ahrq.gov/data_stats/summ_tables/insr/state/series_2/2018/tiif28.pdf.
16 U.S. Agency for Healthcare Quality, Medical Expendi-ture Panel Survey. Available at: https://meps.ahrq.gov/data_stats/summ_tables/insr/state/series_2/2018/tiif29.pdf.
17 Hope CJ, Wu J, Tu W, et al. Association of Medication Adherence, Knowledge, and Skills with Emergency Depart-ment Visits by Adults 50 Years or Older with Congestive Heart Failure. American Journal of Health System Phar-macy. 2004 Oct 1;61(19):2043-9. Available at: https://academic.oup.com/ajhp/article/61/19/2043/5143830.
18 Sokol MC, McGuigan KA, Verbrugge RR, et al. Impact of Medication Adherence on Hospitalization Risk and Healthcare Cost. Medical Care. 2005 Jun;43(6):521-30. Available at: https://www.jstor.org/stable/3768169?seq=1.
19 Roebuck MC, Liberman JN, Gemmill-Toyama M, et al. Medication Adherence Leads to Lower Health Care Use and Costs Despite Increased Drug Spending. Health Affairs. 2011 Jan;30(1):91-9. Available at: https://www.healthaf-fairs.org/doi/full/10.1377/hlthaff.2009.1087.
20 Luga AO, McGuire MJ. Adherence and Health Care Costs. Risk Management Healthcare Policy. 2014; 7: 35–44. Available at: https://www.ncbi.nlm.nih.gov/pmc/articles/PMC3934668/.
21 Egede LE, Gebregziabher M, Dismuke CE, et al. Medica-tion Nonadherence in Diabetes. Diabetes Care. 2012 Dec; 35(12): 2533–2539. Available at: http://care.diabetesjour-nals.org/content/35/12/2533.short.

DRUG COUPON STUDYHEALTH POLICY COMMISSION - 28 -
22 Brown MT, Bussell JK. Medication Adherence: WHO Cares? Mayo Clinic Proceedings. 2011 Apr; 86(4): 304–314. Available at: https://www.ncbi.nlm.nih.gov/pmc/articles/PMC3068890/.
23 Gibson TB, Song X, Alemayehu B, et al. Cost Shar-ing, Adherence, and Health Outcomes in Patients with Diabetes. The American Journal of Managed Care. 2010 Aug;16(8):589-600. Available at: https://www.ajmc.com/journals/issue/2010/2010-08-vol16-n08/ajmc_10aug_gibson_589to600.
24 Dusetzina SB, Winn AN, Abel GA, et al. Cost Sharing and Adherence to Tyrosine Kinase Inhibitors for Patients With Chronic Myeloid Leukemia. Journal of Clinical Oncology. 2014 Feb 1;32(4):306-11. Available at: http://ascopubs.org/doi/full/10.1200/JCO.2013.52.9123?url_v e r = Z 3 9 . 8 8 - 2 0 0 3 & r f r _ i d = o r i : r i d : c r o s s r e f .org&rfr_dat=cr_pub%3dpubmed.
25 Doshi, JA, Li P, Ladge VP, et al. Impact of Cost Sharing on Specialty Drug Utilization and Outcomes: A Review of the Evidence and Future Directions. The American Journal of Managed Care. 2016 Mar;22(3):188-97. Available at: https://www.ajmc.com/journals/issue/2016/2016-vol22-n3/impact-of-cost-sharing-on-specialty-drug-utilization-and-outcomes-a-review-of-the-evidence-and-future-directions.
26 Gleason PP, Starner CI, Gunderson BW, et al. Association of Prescription Abandonment with Cost Share for High-Cost Specialty Pharmacy Medications. Journal of Managed Care and Specialty Pharmacy. 2009 Oct;15(8):648-58. Available at: https://www.jmcp.org/doi/abs/10.18553/jmcp.2009.15.8.648.
27 Palmer L, Abouzaid S, Shi N, et al. Impact of Patient Cost Sharing on Multiple Sclerosis Treatment. The American Journal of Pharmacy Benefits. 2012;4(Special Issue):SP28-SP36. Available at: https://www.ajpb.com/journals/ajpb/2012/ajpb_2012_nov/impact-of-patient-cost-sharing-on-multiple-sclerosis-treatment.
28 Zullig LL, Peppercorn JM, Schrag D, et al. Financial Distress, Use of Cost-Coping Strategies, and Adherence to Prescrip-tion Medication Among Patients With Cancer. Journal of Oncology Practice. 2013 Nov;9(6S):60s-63s. Available at: https://www.ncbi.nlm.nih.gov/pubmed/29431038.
29 Doshi JA, Li P, Ladage VP, et al. Impact of Cost Sharing on Specialty Drug Utilization and Outcome: a Review of the Evidence and Future Direction. The American Journal of Managed Care. 2016 Mar;22(3):188-97. Available at: https://www.ncbi.nlm.nih.gov/pubmed/27023024.
30 Eaddy MT, Cook CL, O’Day K, et al. How Patient Cost-Sharing Trends Affect Adherence and Outcomes. P T. 2012. 37(1): 45–55. Available at: https://www.ncbi.nlm.nih.gov/pubmed/22346336
31 Devane K, Harris K, Kelly K. Patient Affordability Part Two: Implications for Patient Behavior & Therapy Consumption. IQVIA. May 18, 2018. Available at: https://www.iqvia.com/locations/united-states/patient-affordability-part-two.
32 Streeter SB, Schwartzberg L, Husain N, et al. Patient and Plan Characteristics Affecting Abandonment of Oral Onco-lytic Prescriptions. The American Journal of Managed Care. 2011 May;17 Suppl 5 Developing:SP38-44. Available at: https://www.ncbi.nlm.nih.gov/pubmed/21711076.
33 Hopson S, Saverno K, Liu LZ, et al. Impact of Out-of-Pocket Costs on Prescription Fills Among New Initiators of Biologic Therapies for Rheumatoid Arthritis. Jour-nal of Managed Care and Specialty Pharmacy. 2016 Feb;22(2):122-30. Available at: https://www.ncbi.nlm.nih.gov/pubmed/27015251.
34 Pedan A, Varatesh LT, Schneeweiss S. Analysis of Factors Associated with Statin Adherence in a Hierarchical Model Considering Physician, Pharmacy, Patient, and Prescription Characteristics. Journal of Managed Care and Specialty Pharmacy. 2007;13(6):487-95. Available at: https://www.jmcp.org/doi/10.18553/jmcp.2007.13.6.487.
35 Daugherty JB, Maciejewski ML, Farley JF. The Impact of Manufacturer Coupon Use in the Statin Market. Journal of Managed Care Pharmacy. 2013 Nov-Dec;19(9):765-72.Available at: https://www.jmcp.org/doi/10.18553/jmcp.2013.19.9.765.
36 Daubresse M, Andersen M, Riggs KR, et al. Effect of Prescription Drug Coupons on Statin Utilization and Expenditures: A Retrospective Cohort Study. Pharmaco-therapy. 2017 Jan;37(1):12-24. Available at: https://www.ncbi.nlm.nih.gov/pmc/articles/PMC5243177/.
37 Starner CI, Alexander GC, Bowen K, et al. Specialty Drug Coupons Lower Out-Of-Pocket Costs and May Improve Adherence at the Risk of Increasing Premiums. Health Affairs. 2014 Oct;33(10):1761-9. Available at: https://www.healthaffairs.org/doi/full/10.1377/hlthaff.2014.0497.
38 Karmarkar TD, Starner CI, Qiu Y, et al. Sofobu-vir Initial Therapy Abandonment and Manufacturer Coupons in a Commercially-Insured Population. The American Journal of Managed Care. 2016 May;22(6 Spec No.):SP191-7. Available at: https://www.ajmc.com/journals/issue/2016/2016-5-vol22-sp/sofosbuvir-initial-therapy-abandonment-and-manufac-turer-coupons-in-a-commercially-insured-population.
39 Seetasith A, Wong W, Tse J, et al. The Impact of Copay Assistance on Patient Out-of-Pocket Costs and Treatment Rates with ALK Inhibitors. Journal of Medical Economics. 2019 May;22(5):414-420. Available at: http://www.tand-fonline.com/doi/full/10.1080/13696998.2019.1580200.

HEALTH POLICY COMMISSIONDRUG COUPON STUDY - 29 -
40 Schwartz LM, Woloshin S. Medical Marketing in the United States, 1997-206. JAMA. 2019 Jan 1;321(1):80-96. Available at: https://jamanetwork.com/journals/jama/fullarticle/2720029.
41 U.S. Department of Health and Human Services, Food and Drug Administration, Center for Drug Evaluation and Research. Patient and Physician Attitudes and Behaviors Associated with DTC Promotion of Prescription Drugs – Summary of FDA Survey Research Results. Nov 19, 2004. Available at: https://www.fda.gov/media/112016/download.
42 Shelley S. Copay Programs’ Increased Value to Manufacturers is Matched by Rising Criticism. Pharmaceutical Commerce. Jan 15, 2014. Available at: https://pharmaceuticalcommerce.com/brand-marketing-communications/copay-programs-in-creased-value-to-manufacturers-is-matched-by-rising-crit-icism/.
43 Congressional Budget Office. Offsetting Effects of Prescrip-tion Drug Use on Medicare’s Spending for Medical Services. Nov 2012. Available at: https://www.cbo.gov/sites/default/files/cbofiles/attachments/43741-MedicalOffsets-11-29-12.pdf.
44 Van Nuys K, Joyce G, Ribero R, et al. A Perspective on Prescription Drug Copayment Coupon Landscape. University of Southern California Leonard D. Schaef-fer Center for Health Policy & Economics. 2018. Available at: https://healthpolicy.usc.edu/research/prescription-drug-copayment-coupon-landscape/.
45 Ross JS, Kesselheim AS. Prescription-Drug Coupons – No Such Thing as a Free Lunch. New England Journal of Med-icine. 2013 Sep 26;369(13):1188-9. Available at: https://www.nejm.org/doi/full/10.1056/nejmp1301993.
46 Dafny L, Ody C, Schmitt M. When Discounts Raise Costs: The Effect of Copay Coupons on Generic Utili-zation. American Economic Journal: Economic Policy 2017 9 (2), 91-123. Available at: https://www.aeaweb.org/articles?id=10.1257/pol.20150588.
47 Center for Health Information and Analysis. Perfor-mance of the Massachusetts Health Care System, Annual Report. Sep. 2018. Available at: http://www.chiamass.gov/assets/2018-annual-report/2018-Annual-Report.zip.
48 Sovaldi Sofosbuvir. Eligible Patients May Pay no More than $5 per Co-Pay for Sovaldi. Available at: https://www.sovaldi.com/coupons.
49 Singh S. A Foundational Approach to Specialty Cost Management. CVS Health. Jun 19, 2018. Available at: https://payorsolutions.cvshealth.com/sites/default/files/cvs-health-payor-solutions-a-foundational-approach-to-specialty-management-june-2018-briefing.pdf.
50 Miller S. Why Drug Makers Dislike Copay Accumulator Programs. Express Scripts. May 22, 2018. Available at: http://lab.express-scripts.com/lab/insights/drug-options/why-drug-makers-dislike-copay-accumulator-programs.
51 Schmid CE. New Accumulator Adjustment Programs Threaten Chronically Ill Patients. Health Affairs Blog. Aug 31, 2018. Available at: https://www.healthaffairs.org/do/10.1377/hblog20180824.55133/full/.
52 Silverman E. Backlash Against Copay Accumu-lators. Managed Care. Sep 3, 2018. Available at: https://www.managedcaremag.com/archives/2018/9/backlash-against-copay-accumulators.
53 Livingston S. CMS to Allow Copay Accumulators, Cut Exchange User Fees. Modern Healthcare. Apr 18, 2019. Available at: https://www.modernhealthcare.com/insurance/cms-allow-copay-accumulators-cut-exchange-user-fees.
54 Linehan J. Assessing the Legal and Practical Implications of Copay Accumulator and Maximizer Programs. Feb 13, 2019. Managed Care. Available at: https://www.managedcaremag.com/archives/2019/2/assessing-legal-and-practical-implica-tions-copay-accumulator-and-maximizer-programs.
55 Zimmermann S. Despite Promise by FDA Boss of Lower Cost, New Generic EpiPen isn’t any Cheaper. Chicago Sun Times. Dec 1, 2018. Available at: https://chicago.suntimes.com/2018/12/1/18456295/despite-promise-by-fda-boss-of-lower-cost-new-generic-epipen-isn-t-any-cheaper.
56 Walensky R, Paltiel D. PrEP School: A Field Manual for the Battle over HIV Prevention Drug Pricing. Health Affairs Blog. Aug 29, 2019. Available: https://www.healthaffairs.org/do/10.1377/hblog20190826.11005/full/.
57 Office of Attorney General Maura Healey. Press Release: AG Healey Sues Generic Drug Makers and Execu-tives for Widespread Conspiracy to Raise Prices. May 13, 2019. Available at: https://www.mass.gov/news/ag-healey-sues-generic-drug-makers-and-executives-for-widespread-conspiracy-to-raise-prices.
58 King R. Virginia and West Virginia are First States to Ban Copay Accumulators. Mar 29, 2019. Modern Health-care. Available from: https://www.modernhealthcare.com/insurance/virginia-and-west-virginia-are-first-states-ban-co-pay-accumulators.
59 National Academy for State Health Policy. State Prescrip-tion Drug Legislative Tracker. Available at: https://nashp.org/rx-legislative-tracker/.
60 Sullivan T. California Bans Prescription Discounts with Generic Equivalents. Policy & Medicine. May 4, 2018. Available at: https://www.policymed.com/2017/10/califor-nia-passes-legislation-on-prescription-discounts.html.

DRUG COUPON STUDYHEALTH POLICY COMMISSION - 30 -
61 Sullivan T. Nearly Half of US Physicians Restrict Access by Manufacturer Sales Reps – New Strategies to Reach Physicians. Policy & Medicine. May 6, 2018. Available at: https://www.policymed.com/2013/10/nearly-half-of-us-physicians-restrict-access-by-manufac-turer-sales-reps-new-strategies-to-reach-physicians.html.
62 Larkin I, Ang D, Steinhart J. Association between Academic Medical Center Pharmaceutical Detailing Policies and Physician Prescribing. JAMA. 2017 May 2;317(17):1785-1795. Available at: https://jamanetwork.com/journals/jama/fullarticle/2623607.
63 Larkin I, Ang D, Avorn J, et al. Restrictions on Phar-maceutical Detailing Reduced Off-Label Prescribing of Antidepressants and Antipsychotics in Children. 2014 Jun;33(6):1014-23. Available at: https://www.healthaffairs.org/doi/10.1377/hlthaff.2013.0939.
64 O’Brien MA, Rogers S, Jamtvedt G, et al. Educational Outreach Visits: Effects on Professional Practice and Health Care Outcomes. Cochrane Database Systematic Review. 2007 Oct 17;(4):CD000409. Available at: https://www.cochranelibrary.com/cdsr/doi/10.1002/14651858.CD000409.pub2/full

HEALTH POLICY COMMISSIONDRUG COUPON STUDY - 31 -
ACKNOWLEDGMENTS
COMMISSIONERSDr. Stuart Altman Chair
Mr. Martin Cohen Vice Chair
Dr. Donald Berwick
Ms. Barbara Blakeney
Dr. David Cutler
Mr. Tim Foley
Mr. Michael Heffernan Secretary of Administration and Finance
Dr. John Christian Kryder
Mr. Rick Lord
Mr. Ron Mastrogiovanni
Ms. Marylou Sudders Secretary of Health and Human Services
EXECUTIVE DIRECTORMr. David Seltz
Sara Sadownik, Deputy Director of the HPC’s Research and Cost Trends Department, and Yue Huang, Senior Research Associate, prepared this report with guidance and support from David Seltz, Executive Director, Dr. David Auerbach, Research and Cost Trends Director, and Lois Johnson, General Counsel. Many HPC staff contributed to the preparation of this report including Coleen Elstermeyer, Hannah Kloomok, Jia Leung, and Dr. Laura Nasuti. Ashley Johnston designed the report.
All commissioners provided guidance and recommenda-tions, with particular input from Dr. David Cutler.
The HPC acknowledges the contributions of other state agencies in the development of this report, including the Commonwealth Health Insurance Connector Authority and the Massachusetts Group Insurance Commission.
The HPC received valuable assistance from many others in state government, the pharmaceutical industry, patient communities, and the research community. The HPC would like to thank T. Joseph Mattingly II, PharmD, PhD, Associate Professor at the University of Maryland School of Pharmacy for his contributions, and clinicians with Freedman Healthcare. The HPC appreciates the numerous market participants and stakeholders that provided insightful input and comments.

50 Milk Street, 8th FloorBoston, MA 02109
www.mass.gov/HPC