prescription drug management in workers’ compensation
TRANSCRIPT
Prescription Drug Management in Workers’ Compensation
The Seventeenth Annual Survey Report (2019 and 2020 data)
Joseph Paduda
President
CompPharma, LLC
203.314.2632
Copyright 2021 CompPharma, LLC, all rights reservedConfidential and proprietaryDistribution and quotation with express written permission only

Copyright 2021 CompPharma, LLC, all rights reservedConfidential and proprietaryDistribution and quotation with express written permission only 2
Top TakeawaysAfter compiling data from 28 respondents, we’ve identified five top takeaways from
this year’s survey:
1. Total workers’ comp drug spend was approximately $3 billion in 2020.
2. Opioid spend in 2020 dropped to 17% of total drug spend across all
respondents.
3. There was a significant decrease in opioid utilization in 2020; we highlight
this because there were some reports that opioid use among workers’
compensation patients increased during the COVID year.
4. There is no consensus regarding the most problematic issues in workers’
comp, rather an abiding concern that the industry is still challenged by
physician dispensing, mail-order pharmacies, and over-prescribing physicians.
5. Respondents expect a lot out of their PBMs, including a more proactive
approach, more useful and actionable data, and more transparency on
pricing. Some – but by no means all – respondents acknowledge their
own staff must do a much better job to support their PBMs’ clinical
management efforts.
Editor’s Note: We urge caution when reviewing data from 2020. COVID-19 and its
impact likely affected all things workers’ comp in ways we do not yet – and may
never – fully understand. We encourage readers to place more emphasis on long-
term changes and trends and not focus overly much on year-over-year differences.
IntroductionTotal workers’ comp pharmacy spend in 2020 was between $2.9 and $3.2 billion,
with a “best guess” estimate of $3 billion. We recognize that figure is significantly
lower than other estimates, but extensive analysis supports it.
After much research and study, it is clear it is not possible to precisely calculate
workers’ compensation drug spend for several reasons.
Pharmacy is a component of workers’ compensation medical expense, which we
speculate totaled approximately $30 billion in 2020. We must speculate because
we cannot estimate 2020 workers’ compensation medical spend with any degree
of confidence. Anecdotal information indicates that medical spend in 2020

Copyright 2021 CompPharma, LLC, all rights reservedConfidential and proprietaryDistribution and quotation with express written permission only 3
declined significantly due to fewer injuries, fewer medical visits, and fewer surgeries
in the second and third quarters of 2020.
According to the National Academy of Social Insurance (NASI) REPORT: Workers’
Compensation: Benefits, Coverage and Costs, published November 2020, total
medical expense in 2018 was $31,303,6711. This was up slightly from 2017. In
previous reports, we estimated total medical spend for the study year by trending
this forward incorporating medical inflation rates from the National Council of
Compensation Insurance NCCI Annual Issues Symposium State of the Line report2.
This would have led to an estimate of about $33.1 billion, if not for COVID.
However, analysis of historical NCCI inflation rates and the changes in total medical
spend from NASI indicates NCCI’s medical inflation rate appears to be higher than
the all-state, all-payer totals documented by NASI. (NCCI data does not include all
states and all payers.)
Note that NASI’s report indicates a four-year negative inflation rate for workers’
compensation medical spend of (3.4%) from 2014-2018 (page 19). NASI includes
data from all states, insurers, state funds, federal, and other special populations,
which is a broader payer group than NCCI uses.
We did not conduct this survey in 2020 because the people who normally
participate had a lot of other issues on their hands and we did not want to distract
them from those critical tasks.
Other considerations affecting pharmacy spend estimates include:
• Different estimates are based on data from different states, and the various
estimates use differing methodologies. The methodology used by NCCI
is based on an analysis of projected spend for claims occurring in Accident
Years using data from NCCI-reporting states. As such, the NCCI estimate is
based on the anticipated total spend over the entire life of the claims
incurred in a specific year, and not on drug spend in that calendar year.
• In contrast, anecdotal information from payers indicates drug costs account
for 8-11% of medical spend (there are some outliers with spend below 5%).
The basis for determining which products or billing codes is included in
drug spend varies among payers and jurisdictions. Different payers have
different processes and coding logic for prescription bills on paper and/or
patient-paid bills that are reimbursed.

Copyright 2021 CompPharma, LLC, all rights reservedConfidential and proprietaryDistribution and quotation with express written permission only 4
• Drugs are dispensed in a variety of settings and by a variety of providers;
therefore, some drug costs may be included in other charge categories. For
example, specialty drugs may be billed under home health care/durable
medical equipment services, while long-term care and hospital-dispensed
medications typically are counted as facility expenses. It is highly unlikely all
payers surveyed use the same methodology when calculating drug costs.
• Depending on the payer, some or all physician-dispensed drugs may or may
not be counted towards drug spend, as they can be billed on standard
medical billing forms with the cost “rolled-up” under physician costs for
reporting purposes.
This is the 17th time the survey has been conducted; it was not conducted in
2020 due to the pandemic. For the first six years Health Strategy Associates,
LLC, my consulting firm, was responsible for the survey. Responsibility for the
survey was transferred to CompPharma, LLC, a workers’ compensation pharmacy
research and consulting firm, in 2009. (Helen Patterson and I are the co-owners of
CompPharma.)
I’d like to acknowledge the major contributions to this study made by Jay Stith
and Helen Patterson. Jay handled all the data aggregation and analysis and
provided insights that only a brilliant analyst could see. I am indebted to Jay for his
diligence and ability to interpret data in ways I could not. Helen Patterson handled
scheduling, edited, and proofed the report, and coordinated all production. Simply,
Helen is the persistent, positive professional most responsible for this getting done.
RespondentsWe wish to express our gratitude to the workers’ compensation professionals who
carefully and thoughtfully responded to the survey. Their willing participation is
deeply appreciated. All responses are confidential, and care has been taken to
“sanitize” responses to protect the anonymity of the respondents.
Interviews were conducted in the late spring and early summer of 2021, with
data on pharmacy spend and other metrics derived from 2020 and 2019 (when
provided) respondent results.
Editor’s Note: Some respondents were not able to provide 2019 drug spend data.
Copyright 2021 CompPharma, LLC, all rights reservedConfidential and proprietaryDistribution and quotation with express written permission only 5
Respondents were decision makers, clinical personnel, and operations staff in
state funds, carriers, self-insured employers, guarantee funds, and third-party
administrators (TPAs) with drug expenses ranging from $161,000 to over $135
million. Respondents’ 2020 drug costs totaled $434 million or about 14.5% of total
workers’ compensation drug spend.
FindingsThe survey results indicate that workers’ compensation prescription drug costs have
decreased by approximately $1.8 billion or 38% over the last decade. Several drivers
contributed to this decline:
• Massive decrease in opioid utilization and impact on co-prescribing;
• Significant reduction in California’s pharmacy fee schedule;
• A very competitive PBM market; and
• Consolidated PBM industry providing greater buying power.
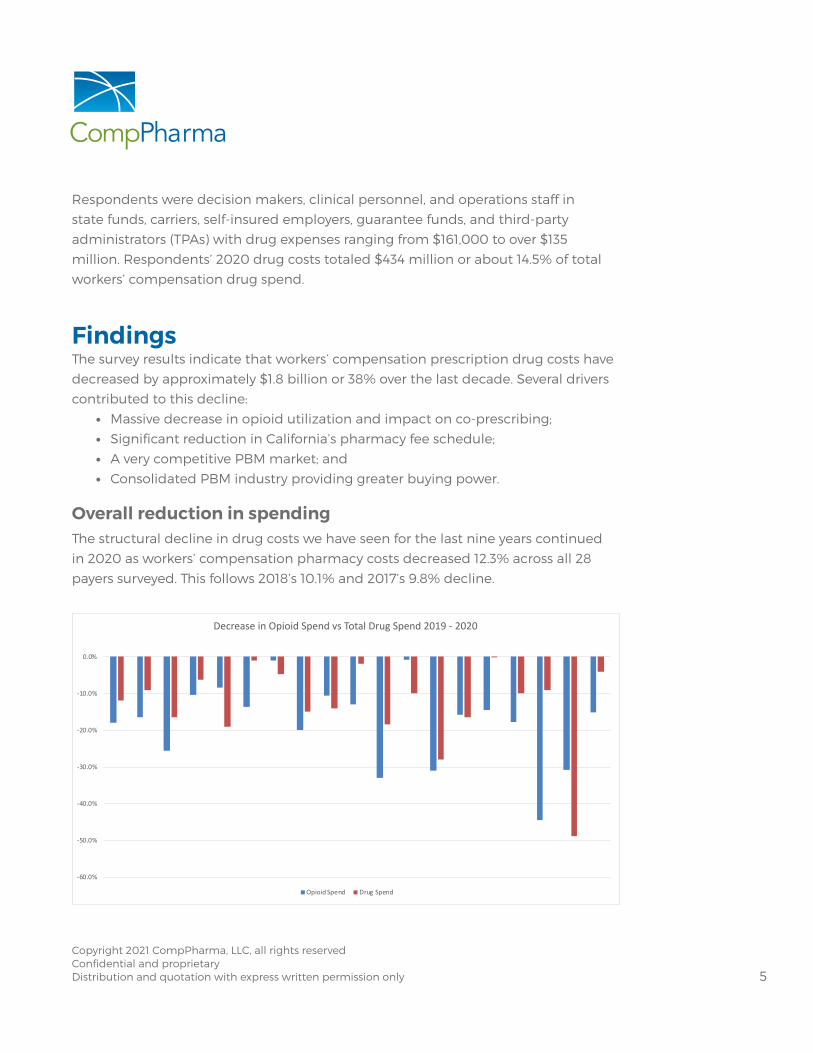
Overall reduction in spendingThe structural decline in drug costs we have seen for the last nine years continued
in 2020 as workers’ compensation pharmacy costs decreased 12.3% across all 28
payers surveyed. This follows 2018’s 10.1% and 2017’s 9.8% decline.
-60.0%
-50.0%
-40.0%
-30.0%
-20.0%
-10.0%
0.0%
Decrease in Opioid Spend vs Total Drug Spend 2019 - 2020
Opioid Spend Drug Spend

Copyright 2021 CompPharma, LLC, all rights reservedConfidential and proprietaryDistribution and quotation with express written permission only 6
-15
-10
-5
0
5
10
15
2007 2008 2009 2010 2011 2012 2013 2014 2015 2016 2017 2018 2020%Change
AverageRespondentChangeinRxSpend
While the double-digit drop is quite significant, it is important to note that there
was wide variation among the respondents with changes ranging from a decrease
of 27.9% to a 10% increase. There was more variation this year than in any recent
survey, likely due to the broad range of respondents, e.g., public entities, state funds,
and payers of last resort and their exposure to COVID-19. Four respondents reported
declines greater than 20%.
Averaging each respondent’s trend results in a decrease of 11.9%. This indicates
larger payers saw somewhat larger declines in drug spend than their smaller
counterparts.
Survey results since 2007 indicate drug costs dropped in eight of the last 10 years; in
total we estimate drug spend today is roughly 60% what it was a decade ago.
How important is drug management?In response to the question “Where does prescription drug management rank
compared to other medical issues at your organization?” drugs were rated as a 3.4,
or slightly more important, 3 being “drugs are equally as important as other medical
issues.” This is significantly lower than the rolling five-year average of 3.8+/-. Individual
responses to qualitative questions on the survey indicated continued concern with
drug costs and related issues primarily due to a belief that compared to other
Copyright 2021 CompPharma, LLC, all rights reservedConfidential and proprietaryDistribution and quotation with express written permission only 7
medical treatment and services, drugs have a greater effect on disability duration
and claim closure and can increase medical costs due to adverse consequences of
some drugs and drug regimens.
On average respondents (3.25) believe that in a year, drug issues will be just a bit
more concerning than they are today. While this is below the average over the last
five years, it remains somewhat surprising. Despite dramatic decreases in spend and
opioids, payers continue to believe pharmacy issues will remain front and center.
DriversFully half of all respondents attributed the drop in spend to fewer claims and/or the
impact of COVID.
Another key contributor was the continuation of significant year-over-year
reductions in opioid spend.
Opioids
Spend reductionOne cannot overstate the success of payer, regulator, and pharmacy benefit
manager (PBM) efforts to reduce inappropriate opioid usage. Across all
respondents, spend on opioids dropped 19.3% from 2019 to 2020, following a 21.9%
decrease from 2017 to 2018 and an 18.2% reduction the prior year. (These statistics
come from combining all respondents’ 2019 and 2020 results and calculating the
total decrease.)
Extrapolating from respondent data since 2016, the workers’ comp industry has
reduced opioid spend by about $579 million or 62.7%.
In contrast, IQVIA reported total US retail-filled prescriptions for opioid analgesics
has fallen 40% since opioid dispensing peaked in 20113.
While spend (the metric used in CompPharma’s survey) is not precisely equivalent
to the volume of retail prescriptions (IQVIA’s metric), the fact is that workers’
compensation payers have been far more successful in reducing opioid usage than
the nation as a whole. This is due to the industry’s early recognition of the disastrous
implications of opioid over-prescribing and the actions it has and continues to take.
Copyright 2021 CompPharma, LLC, all rights reservedConfidential and proprietaryDistribution and quotation with express written permission only 8
Opioids and total drug spendOpioid spend accounted for 17% of total drug spend across all respondents that
reported opioid and total drug spend. Just five years ago opioids accounted for
24.2% of respondents’ drug spend; this is even more remarkable when one recalls
total drug costs have shrunk dramatically over that same period.
Reducing opioid usage and spend leads directly to reducing total drug spend.
Some of this is due to the cost of the opioids themselves and costs of other drugs,
such as stool softeners, erectile dysfunction medications, and anti-anxiety drugs,
that are often co-prescribed with opioids. Reducing or eliminating opioids has
knock-on effects when these other drugs are no longer prescribed.
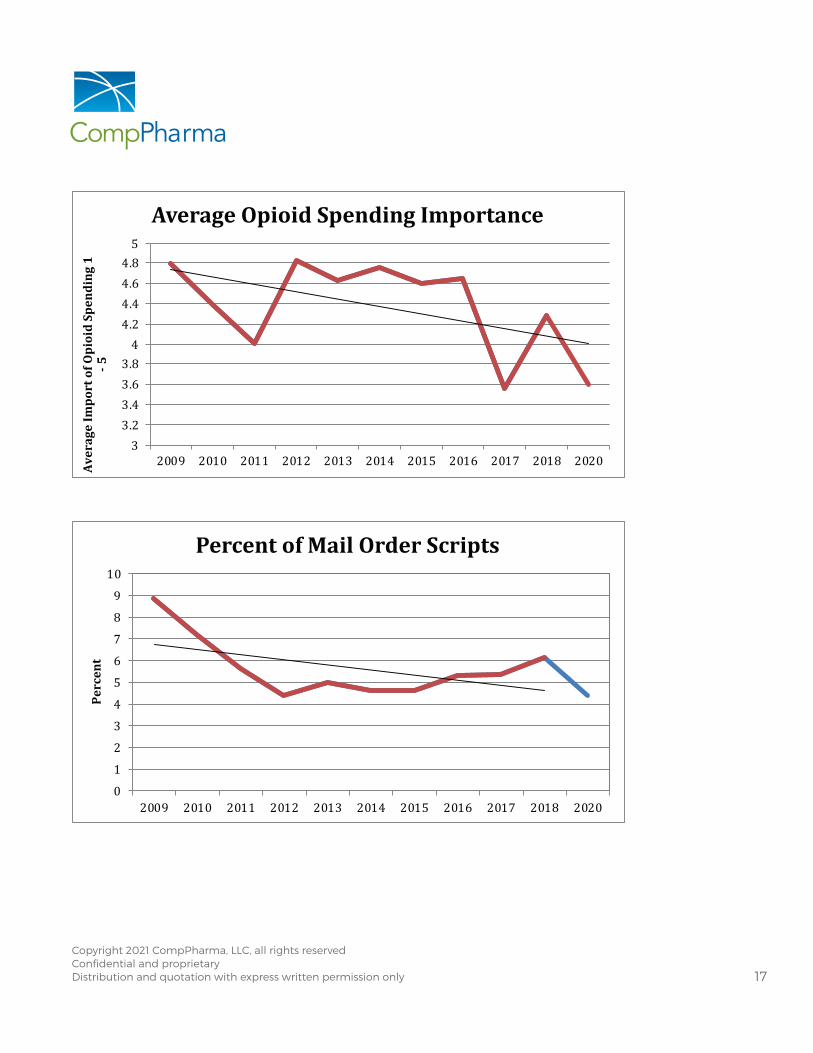
Opioid management – the most important issue in work comp pharmacy – and perhaps in workers’ comp Respondents were asked “How much of an issue is the use of opioids in workers’
comp?” This year they rated opioids a 3.6, (between significant and very significant)
a major decrease from 2019’s 4.3, and by far the lowest rating given since we began
asking this question.
That’s the good news – and there is more. As a group, respondents believe they
have made more-than-significant progress (3.7 on the five-point scale) helping long-
term opioid patients reduce or eliminate opioid consumption altogether.
Following the significant reductions in initial opioid prescriptions the industry has
made, it has turned its attention to long-term consumers of opioids. Chronic opioid
usage is a much knottier issue than addressing initial opioid usage. While opioids
do appear to help some patients with chronic pain, extensive highly credible
research clearly indicates there are far less dangerous options that work for most
patients. However, there are a host of issues and challenges inherent in working
with chronic pain patients and patients who have consumed opioids for long
periods of time.
We asked respondents to identify the obstacles to helping chronic opioid consumers.
• Seven—one-fourth of respondents—identified patient resistance as the leading
obstacle. Two respondents put patient resistance in second place and one
ranked it in third place.

Copyright 2021 CompPharma, LLC, all rights reservedConfidential and proprietaryDistribution and quotation with express written permission only 9
• Six listed prescribing physicians as the greatest obstacle, with several more mentioning the prescribers as lesser obstacles.
• Inadequate regulatory support garnered two first-place votes and three second.
• Three identified claimant attorneys as the top obstacle with two more placing them second.
Many respondents went into detail about their efforts, providing insights into what
worked and what didn’t, identifying state-specific challenges and tools, the need to
treat the whole patient, the growing awareness of the saliency of behavioral health
and other issues.
Emerging issues and the biggest problem in work comp pharmacy Once again, we asked respondents if there were emerging issues in work comp pharmacy that concerned them. In general, few identified issues that are actually new or “emerging”. There was some consistency among responses, with several naming industry consolidation and others identified mail order pharmacies, medical marijuana, and our old nemesis physician dispensing.
Regarding industry consolidation, two responses likely speak for others:
• Seeing concentration of PBMs as a large organization - are they holding them accountable as they become more interconnected? How to create opportunities with smaller PBMs that might fall into place where not enough innovation from larger PBMs?
• Industry wide, consolidation of PBMs is disturbing. For account of their size, when they deal with companies that are too big, they get lost.
The final question asked respondents to identify the “single biggest problem in workers’ compensation pharmacy.”
There was little consensus. One quarter of respondents mentioned pricing and/or transparency; others mentioned physician dispensing and mail-order pharmacies, while a few complained about PMS’ lack of innovation, declining service, and the lack of differentiation among PBMs.
Editor’s Note: this last statement is likely due as much to payers demanding ever-lower prices, which severely constrains a PBM’s ability to invest in innovation, staff, technology, compliance, and research as to any other factor.
Copyright 2021 CompPharma, LLC, all rights reservedConfidential and proprietaryDistribution and quotation with express written permission only 10
Data points We have collected several data points for the 17 years the survey has been conducted. The following compare 2020 data to 2018.
Generic fill rate: Jumped up to 89.2% from 2018’s 86% - this is the highest fill rate we’ve seen in 17 years.
Generic efficiency: 97.3% – almost two points higher than the twelve-year average of 95.7 and essentially identical to 2018.
Network penetration based on spend: 90%, a 1% decline from 2018 but four points above the previous survey high of 86%. This may reflect the ability of Optum to utilize its third-party biller platform, acquired via Progressive/Helios. By categorizing scripts originally filed as paper bills as in-network, Optum was able to increase its network penetration rate.
Editor’s Note: Some payers may have different views of how “network penetration” should be calculated and if third-party bills should be defined as “in-network.”
Home delivery: 4.3%, down sharply from 6.1%, and significantly below the 12-year average of 5.5. Home delivery has been declining over the last decade, despite the significant opportunity for additional cost reduction it offers.
Editor’s Note: We have no explanation for the decrease.
PBM What do payers want in their PBM?As the workers’ comp PBM industry becomes ever-more concentrated, it is more important than ever for payers to assess their needs critically and objectively and compare PBMs based on those needs. By the same token, in a hyper-competitive industry, PBMs must understand, develop, and invest in staff, services, IT, and
business models that reflect market needs, both real and perceived.
To that end, we asked two somewhat different questions to discern the value payers place on various PBM capabilities, services, and cultural attributes. The first asked respondents to identify the most valuable services their PBM provides.
Clinical management – not just the basics, but the in-depth expertise of a
pharmacist assigned to the client to address knotty issues, work with case
Copyright 2021 CompPharma, LLC, all rights reservedConfidential and proprietaryDistribution and quotation with express written permission only 11
managers and interact with prescribers was perhaps the most valued attribute. “Perhaps” because customer service – and especially proactive, problem-anticipation-and-solution by energetic account managers passionate about their work likely has more “value” as it involves a personal connection, one that demonstrates a commitment by the PBM to its staff and makes the buyer feel like they are listened to.
Reporting was third – but not just ANY reporting, rather digestible, actionable information implications accompanied by recommendations and/or next steps.
In my experience respondents almost always downplay the importance of price until it comes time to review proposals and request for proposal responses, pick finalists, and negotiate the deal. Then price dominates the discussion.
That said, payers’ responses to these questions clearly indicate the primary importance of customer service and clinical management and the integral role of reporting in those two areas.
Pricing and transparency While transparency wasn’t highlighted as the “most important problem in workers’ comp pharmacy management today” by most respondents, it is clear there is a lot of frustration around pricing and transparency. To that point, assigning scores to respondents’ comments on pricing indicates an overall satisfaction level of 2.05 on the 5-point scale.
When responding to the question “What are your views on PBM pricing methodologies?” three of the 28 respondents indicated they have full transparency and receive rebate checks. While that may seem like a very small number, in our last survey only one of 31 respondents received rebates. Notably these three respondents are not commercial payers but governmental or quasi-governmental entities Fifteen respondents said either transparency is positive, or they need more transparency.
The main takeaway is there is a growing desire on the part of payers for “transparency.” This will likely increase, and PBMs’ responses to date have – in general – not satisfied respondents.
Yes, PBMs can provide a lot of insights re pricing, but payers must invest their own time and energy to understand it. It is complicated and daunting indeed, but payers cannot complain about pricing if they aren’t willing to do the work themselves.

Copyright 2021 CompPharma, LLC, all rights reservedConfidential and proprietaryDistribution and quotation with express written permission only 12
PBM assessment This year we asked if respondents are auditing their PBM or “otherwise ensuring the
PBM is complying with contractual terms and commitments.” Twelve respondents
asserted they were doing some form of PBM monitoring, although a deeper
dive indicated those payers that answered “yes” were doing rather superficial
assessments. These were described as “informal, minimal and high-level.” Some
focused on service level agreements and quality assurance issues surrounding fill
timeliness and turnaround time. Most respondents acknowledged that auditing
pricing was challenging.
Without access to historical pricing data, a deep understanding of drug categories
(what exactly is meant by “generic”?), pricing methodologies and standards, and
a robust analytical capability, payers’ ability to evaluate PBM compliance with
contractual terms are superficial at best.
Ratings We asked each respondent to rate each PBM from 1-5, with 1 equaling “I wouldn’t
want to work with them” to 5 being “highly regarded” and 3 being neutral. We also
assigned a score of 0 for a PBM that a respondent was unable to provide a rating.
Note that in addition to the six PBMs named below, we also asked about other
small or relatively new entrants; very few respondents had any opinion or had heard
of these entities thus they are not included in the chart.
Ratings, not counting “0” scores, were as follows:
VENDOR GRADE
myMatrixx 3.7
CadenceRx 3.3*
HealtheSystems 3.2
Mitchell 3.2
Optum 3.2
Coventry First Script 2.7
CorVel 2.3
Average 3.1
*Less than 1/3 of respondents were aware of CadenceRx; CorVel was the second “least known” PBM with two-thirds of respondents aware of CorVel’s PBM.

Copyright 2021 CompPharma, LLC, all rights reservedConfidential and proprietaryDistribution and quotation with express written permission only 13
The picture is somewhat different when “0” scores are added, the logic being that
respondents that are not aware of a PBM are unlikely to consider it as a vendor/
partner. Thus, we inserted a “0” score where respondents did not rate a PBM.
(Future surveys will attempt to tease this out.)
VENDOR GRADE
myMatrixx 2.8
Optum 2.4
HealtheSystems 2.3
Mitchell 2.2
Coventry First Script 1.3
CorVel 1.6
CadenceRx 1.2
Average 2.0
ConclusionsSeventeen years into this, there are three central takeaways.
More transparency is coming. Some PBMs are actively avoiding the conversation,
and so far, this has served them well. Whether that is sustainable or not depends on
their clients.
Payers want more from their PBMs, but often cannot clearly define what “more”
is. There’s frustration with pricing, with reactive rather than proactive customer
service, and with reporting that isn’t actionable. PBMs must do a better job of
understanding customers’ pain points and figuring out how they can relieve that
pain. That said, PBMs must also push back on payers complaining about pricing,
service, impact, and outcomes if those payers aren’t fully invested in and working
with the PBM to drive results.
Far too often payers don’t take responsibility for their own goals or internal issues
that inhibit achieving them.
Adjusters who overturn PBM pharmacists’ recommendations, payers with crappy
systems that don’t route paper bills to their PBM, payers that refuse to challenge
legacy claimants’ demands for brand drugs when generics are available, and payers

Copyright 2021 CompPharma, LLC, all rights reservedConfidential and proprietaryDistribution and quotation with express written permission only 14
that demonstrate an inability or unwillingness to share data with the PBM all
hinder their own program results.
Patients covered by workers’ compensation have benefited greatly from the
dramatic reduction in opioid spend – as have employers and taxpayers. There’s no
question that deaths have been avoided, addiction and diversion risk drastically
reduced, and injury recovery hastened. The decline in opioid usage has been
instrumental in reducing medical costs and disability duration, saving premium
dollars for employers and reducing the tax burden on us all.
PBMs have been instrumental in reducing unnecessary drug use. As a result, the
current PBM business model is not sustainable. Simply put, PBMs are the victim
of their own success. As drug spend decreases, PBMs have fewer dollars to invest
in clinical management, analytics, and patient outreach. Payers, regulators, and
PBMs must evolve their relationships, change their expectations, and collaborate to
ensure the gains made over the last decade don’t disappear.
There is much work still to be done to reduce chronic opioid usage. We also know
there are new challenges over the horizon. All stakeholders must remain vigilant to
ensure patients, employers, and taxpayers benefit from the right medications, and
are protected from bad actors, sloppy regulations, and forces outside our control.

Copyright 2021 CompPharma, LLC, all rights reservedConfidential and proprietaryDistribution and quotation with express written permission only 15
2
2.5
3
3.5
4
4.5
2009 2010 2011 2012 2013 2014 2015 2016 2017 2018 2020
RespondentGrade1-5
ImportanceofPharmacy
75
80
85
90
95
2009 2010 2011 2012 2013 2014 2015 2016 2017 2018 2020
PercentofScripts
NetworkPenetration%
The AppendixHISTORICAL DATA

Copyright 2021 CompPharma, LLC, all rights reservedConfidential and proprietaryDistribution and quotation with express written permission only 16
50556065707580859095
2009 2010 2011 2012 2013 2014 2015 2016 2017 2018 2020
PercentofGenerics
PercentofScriptsFilledasGenerics
90
91
92
93
94
95
96
97
98
2009 2010 2011 2012 2013 2014 2015 2016 2017 2018 2020
PercentActuallyFilledasGenerics
GenericEfficiency
Copyright 2021 CompPharma, LLC, all rights reservedConfidential and proprietaryDistribution and quotation with express written permission only 17
33.23.43.63.84
4.24.44.64.85
2009 2010 2011 2012 2013 2014 2015 2016 2017 2018 2020AverageImportofOpioidSpending1
-5
AverageOpioidSpendingImportance
0
1
2
3
4
5
6
7
8
9
10
2009 2010 2011 2012 2013 2014 2015 2016 2017 2018 2020
Percent
PercentofMailOrderScripts

Copyright 2021 CompPharma, LLC, all rights reservedConfidential and proprietaryDistribution and quotation with express written permission only 18
End Notes
1 National Academy of Social Insurance (NASI) REPORT: Workers’ Compensation:
Benefits, Costs, and Coverage, published November 2020 https://www.nasi.org/re-
search/report-workers-compensation-benefits-costs-and-coverage-2018-data/
2 National Council of Compensation Insurance NCCI Annual Issues Sym-
posium State of the Line report https://www.ncci.com/Articles/Documents/
AIS2021-SOTL-Presentation.pdf
3 IQVIA, page 5. https://www.iqvia.com/form-pages/institute-gated?redirectUrl=
%2f-%2fmedia%2fiqvia%2fpdfs%2finstitute-reports%2fprescription-opioid-trends
in-the-united-states%2fiqi-prescription-opioid-trends-in-the-us-1220-forweb.pd-
f%3f_%3d1627050025510&Name=IQI-Prescription-Opioid-Trends-in-the-US-1220-
forWeb
No outside funding was provided to support this survey.