presentación de powerpoint - atresmedia...• prices: internal estimates. conventional advertising....
TRANSCRIPT

1 Roadshow back up_Mar 2013 1 Presentation to investors_Oct 19
ATRESMEDIA
Presentation to investors Oct 2019
www.atresmediacorporacion.com
“We believe in the power of reflection and emotion”

2 Roadshow back up_Mar 2013 2 Presentation to investors_Oct 19
Spanish Media industry insights
Media industry
3 Roadshow back up_Mar 2013 3 Presentation to investors_Oct 19
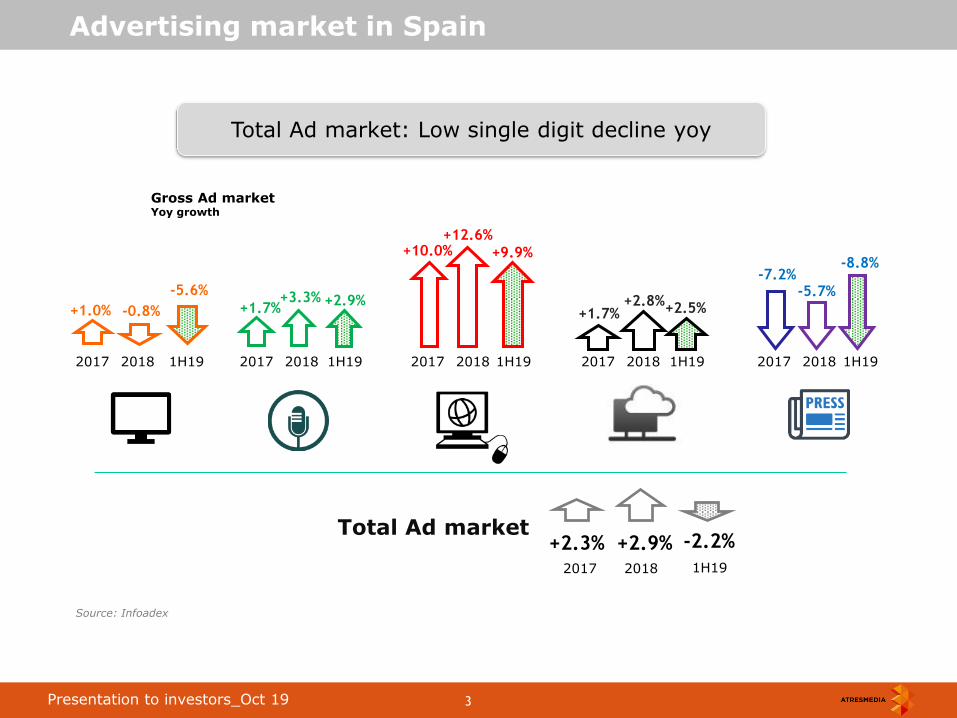
Advertising market in Spain
Gross Ad market Yoy growth
+2.9%
Total Ad market -2.2%
Total Ad market: Low single digit decline yoy
+9.9%
Source: Infoadex
+1.0% +1.7%
+10.0%
+1.7%
-7.2%
+2.3%
2017 2018
2017 2018 2017 2018 2017 2018 2017 2018 2017 2018
-0.8%
1H19
+3.3%
1H19
+12.6%
1H19
+2.8%
1H19
-5.7%
1H19
+2.9%
1H19
-5.6%
+2.5%
-8.8%

4 Roadshow back up_Mar 2013 4 Presentation to investors_Oct 19
TV: Clear leadership
Spanish Ad spending by medium Share
Advertising market in Spain
2002 2003 2004 2005 2006 2007 2008 2009 2010 2011 2012 2013 2014 2015 2016 2017 2018
-1pp
+31pp
-27pp
0pp
41%
39% 40%
14%
1%
32%
9% 9%
8% 7% -1pp
Source: Infoadex

5 Roadshow back up_Mar 2013 5 Presentation to investors_Oct 19
Source: Infoadex and Bank of Spain
Total & TV market % on GDP is flattening out
Total & TV ad intensity (vs GDP)
Advertising market in Spain
0,72% 0,74%
0,54%
0,41% 0,46%
0,29% 0,32%
0,23%
0,16% 0,18%
2002 2003 2004 2005 2006 2007 2008 2009 2010 2011 2012 2013 2014 2015 2016 2017 2018
Total Ad market
TV Ad market
2002-17 avg=0.57%
(All-time average= 0.73%)
2002-17 avg= 0.24%
(All-time average= 0.29%)

6 Roadshow back up_Mar 2013 6 Presentation to investors_Oct 19
78%
23%
58%
85%
Source: Internal estimates & EGM. 2018 data
8,5
1,5 2,4
Spanish TV: Best cost-coverage mix
Cost-coverage by medium In €/1,000 impacts & % penetration
CPT
Coverage
Advertising market in Spain
1 - 2
Display Video Premium Video
9 -10
4 - 5

7 Roadshow back up_Mar 2013 7 Presentation to investors_Oct 19
Positive outlook for household consumption & GDP
Spanish TV industry: Main drivers
-0,5%
-2,1%
1,4% 2,6% 3,0%
4,2%
3,3%
1,7% 2,0% 2,2%
-1,9%
-1,1%
1,0%
3,7% 3,6%
4,2%
3,6%
3,0% 2,6%
2,9%
2012 2013 2014 2015 2016 2017 2018 2019e 2020e 2021e
Consumption
GDP
Forecast
Source: Funcas (Sept). In current prices
Household Consumption & GDP Yoy growth

8 Roadshow back up_Mar 2013 8 Presentation to investors_Oct 19
Current TV Ad market is still far from average and peak levels
Spanish TV industry: Ad market
Gross TV Ad market In € mill
Source: Infoadex
16% 10% 8% 9%
-11%
-23%
4%
-10%
-19%
-6%
11% 6% 6%
1%
-1%
2.317
2.677
2.951
3.188
3.469
3.082
2.378 2.472
2.237
1.815 1.703
1.890 2.011
2.122 2.143 2.127
2003 2004 2005 2006 2007 2008 2009 2010 2011 2012 2013 2014 2015 2016 2017 2018
% yoy Gross TV Ad market
Average: 2,410
-12%
-39%

9 Roadshow back up_Mar 2013 9 Presentation to investors_Oct 19
Spanish TV industry: Ad market
High volatility in the Spanish TV Ad market in the last two years
Gross TV Ad market Yoy growth
Source: Infoadex
-16%
-10%
-3%
6%
3%
8%
22%
13% 12%
8%
3% 3%
6%
11%
1%
3% 4%
-3%
3% 1%
-4%
2%
-2%
1%
-1%
-9%
Q113 Q213 Q313 Q413 Q114 Q214 Q314 Q414 Q115 Q215 Q315 Q415 Q116 Q216 Q316 Q416 Q117 Q217 Q317 Q4 17 Q118 Q218 Q318 Q418 Q119 Q219
FY13=-6%
FY15=+6% FY14=+11% FY16=+6% FY17=+1% FY18=-1%
YTD19=-6%

10 Roadshow back up_Mar 2013 10 Presentation to investors_Oct 19
Source: Internal Estimates
Ad spending by sectors % 1H19 yoy
Beauty &Hygiene
Food Autos Telcos Retail Finance Health Beverages Others
-6% -11%
-8%
21%
-6%
1%
-13%
-18%
-8%
11% 11% 16% 10% 7% 8% 6% Weight 25%
1H19=-6%
Spanish TV industry: Ad market
(Energy, Cleaning, Home, Sports & leisure…)
6%
1H19: Positive in Telcos and Retail but not enough to offset other categories’ underperformance

11 Roadshow back up_Mar 2013 11 Presentation to investors_Oct 19
Quarterly evolution by category
11% 16% 10% 7% 8% 6% 6% 25% Weight 1H19
TV Advertising market by category: Quarterly evolution
Source: Internal estimates
11%
-1%
-15%
-6%
38%
-1%
0%
-15%
18%
-3%
-10% -7%
-9%
8%
3%
-11% -11%
-33%
-11%
Beauty Food Autos Telecom Retail Finance Health Beverages Others
Q1 Q2
Only Telecom increased its ad spending in both quarters

12 Roadshow back up_Mar 2013 12 Presentation to investors_Oct 19
Source: • TV Market: Infoadex. 2018 • Prices: Internal estimates. Conventional advertising. • Volumes: Internal estimates. Commercial hours: 13h-25h. Conventional advertising excluding TVE.
Stability in prices and volumes
2.317
3.469
1.703
1.890 2.011
2.122 2.143 2.127
100
146 147
109 112 116
118 120
119
83 89
92 96 97 97
2003 2004 2005 2006 2007 2008 2009 2010 2011 2012 2013 2014 2015 2016 2017 2018
Nominal Prices Volumes
TV Ad market In € million +
Market Prices & Volumes in index terms
TV ad market
Spanish TV industry: Prices and volumes

13 Roadshow back up_Mar 2013 13 Presentation to investors_Oct 19
Source: Infoadex
Stable market shares by player
Market share evolution by player Ad Share
Advertising market in Spain
Forta
Other FTAs
Pay TVs
43% 44% 43% 43% 43% 43% 43%
43% 42% 42% 42% 41% 41% 42%
7% 7% 7% 6% 5% 5% 4%
4% 4% 4% 5% 6% 6% 5%
3% 3% 4% 4% 4% 5% 5%
2013 2014 2015 2016 2017 2018 1H19
14 Roadshow back up_Mar 2013 14 Presentation to investors_Oct 19
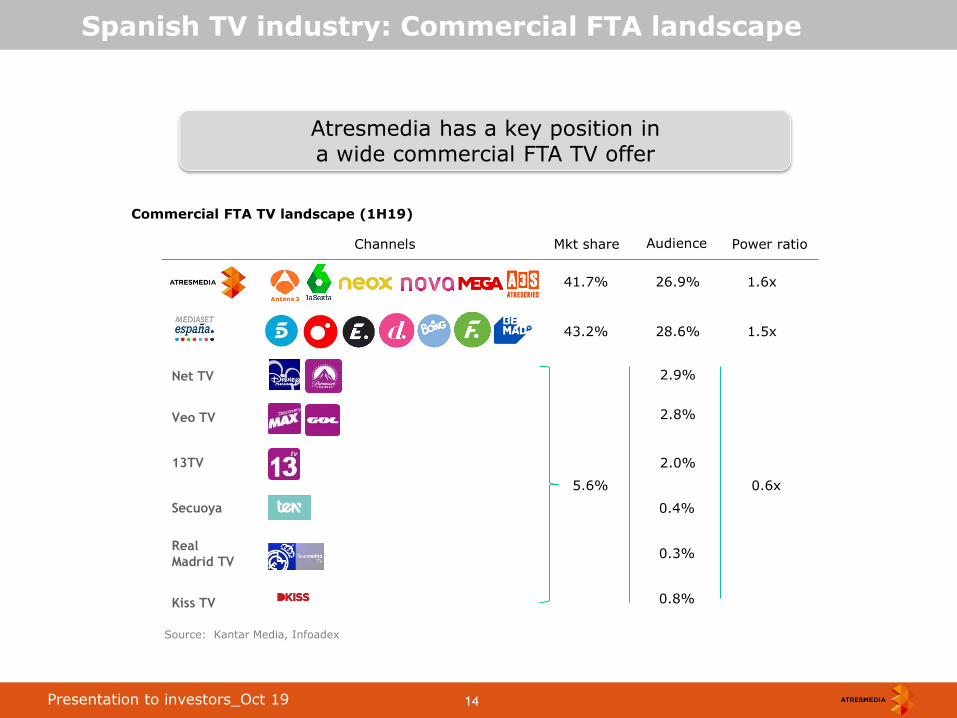
Spanish TV industry: Commercial FTA landscape
Net TV
Commercial FTA TV landscape (1H19)
Veo TV
Atresmedia has a key position in a wide commercial FTA TV offer
Channels
13TV
Secuoya
Real
Madrid TV
Kiss TV
Audience Mkt share Power ratio
26.9% 41.7% 1.6x
28.6% 43.2% 1.5x
2.9%
2.8%
2.0%
5.6% 0.6x
Source: Kantar Media, Infoadex
0.4%
0.3%
0.8%
15 Roadshow back up_Mar 2013 15 Presentation to investors_Oct 19
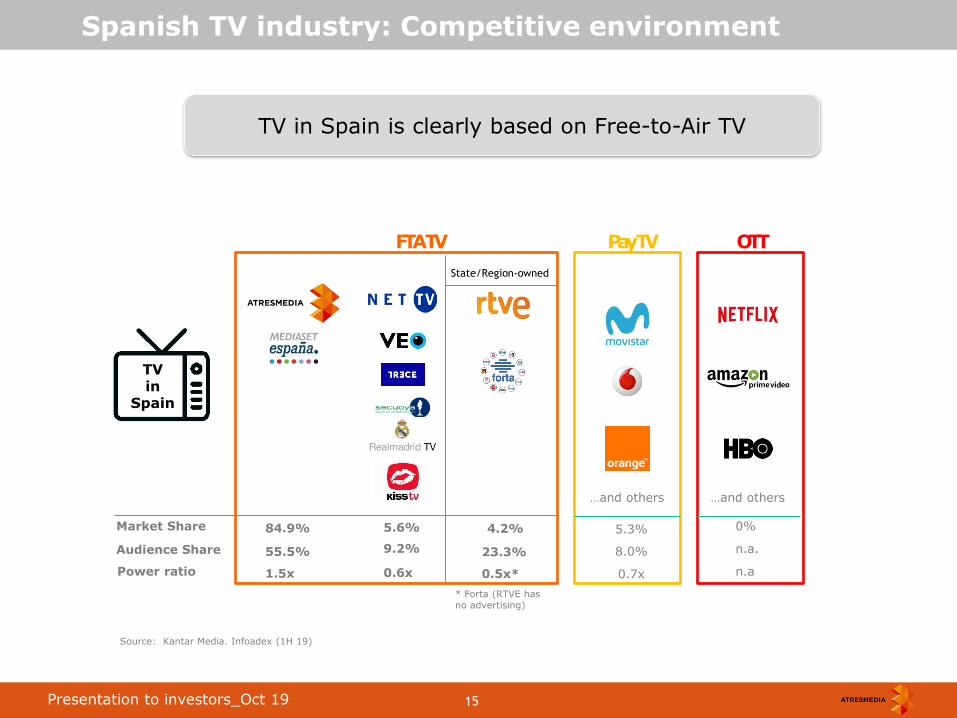
Spanish TV industry: Competitive environment
FTA TV
Source: Kantar Media. Infoadex (1H 19)
Pay TV OTT
Power ratio
Market Share
55.5%
84.9% 5.6%
9.2% 23.3%
4.2% 5.3%
8.0%
0%
n.a.
State/Region-owned
…and others …and others
TV in
Spain
Audience Share
1.5x 0.6x 0.5x* 0.7x n.a
* Forta (RTVE has no advertising)
TV in Spain is clearly based on Free-to-Air TV

16 Roadshow back up_Mar 2013 16 Presentation to investors_Oct 19
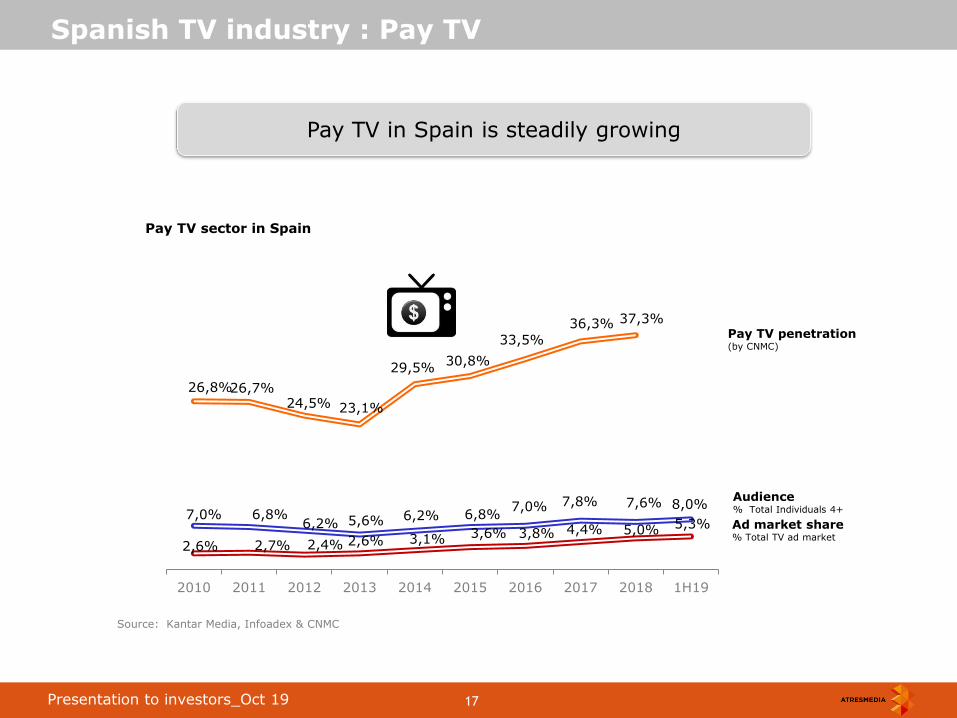
Spanish TV industry : Pay TV
FTA TV leads by far over Pay TV
Source: Kantar Media, Infoadex & CNMC
* Penetration as of Q4 18
FTA TV vs Pay TV in Spain FY18
Penetration (% of households)
100%
37%*
Audience 2018 (%)
92%
8%
17 Roadshow back up_Mar 2013 17 Presentation to investors_Oct 19
26,8% 26,7% 24,5% 23,1%
29,5% 30,8%
33,5%
36,3% 37,3%
7,0% 6,8% 6,2% 5,6% 6,2% 6,8%
7,0% 7,8% 7,6% 8,0%
2,6% 2,7% 2,4% 2,6% 3,1% 3,6% 3,8% 4,4% 5,0% 5,3%
2010 2011 2012 2013 2014 2015 2016 2017 2018 1H19
Spanish TV industry : Pay TV
Pay TV in Spain is steadily growing
Source: Kantar Media, Infoadex & CNMC
Pay TV sector in Spain
Pay TV penetration (by CNMC)
Audience % Total Individuals 4+
Ad market share % Total TV ad market
18 Roadshow back up_Mar 2013 18 Presentation to investors_Oct 19
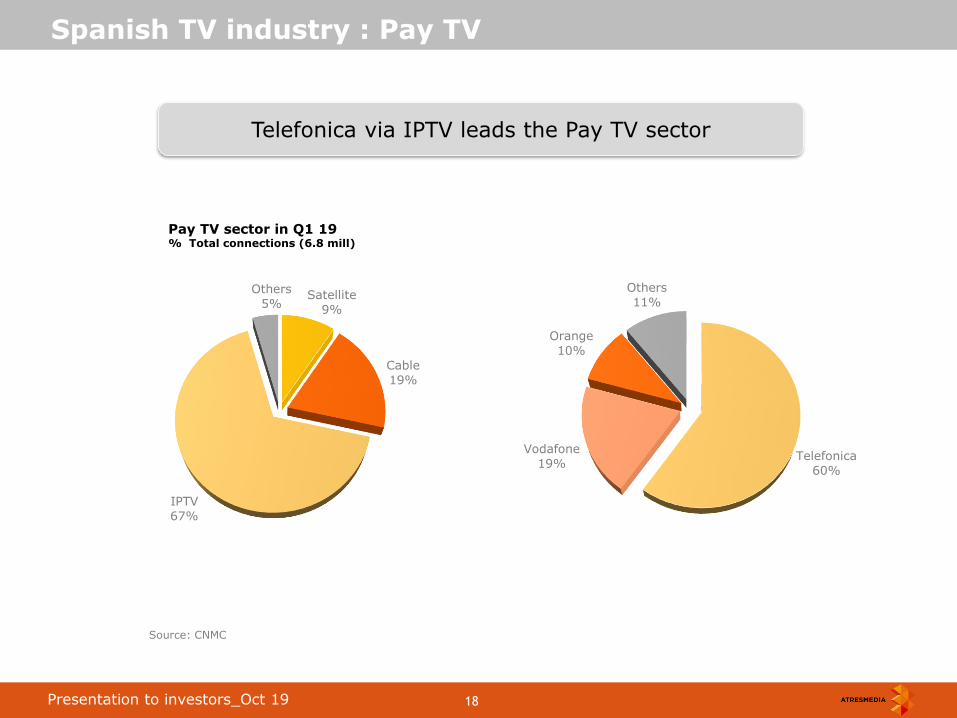
Spanish TV industry : Pay TV
Telefonica via IPTV leads the Pay TV sector
Source: CNMC
Pay TV sector in Q1 19 % Total connections (6.8 mill)
Satellite
9%
Cable
19%
IPTV
67%
Others
5%
Telefonica
60%
Vodafone
19%
Orange
10%
Others
11%

19 Roadshow back up_Mar 2013 19 Presentation to investors_Oct 19
Spanish TV industry : OTT TV
Source: Household panels. CNMC Q2 18
OTT penetration is still low
TV on demand Q2 18
18.5 mill households
16.4 mill households
internet connected
5.4 mill households
consume OTT
of which:
of which:
2.2 mill 0.9 mill 2 mill
OTT
0.6 mill
≈
0.7 mill 0.5 mill
20 Roadshow back up_Mar 2013 20 Presentation to investors_Oct 19
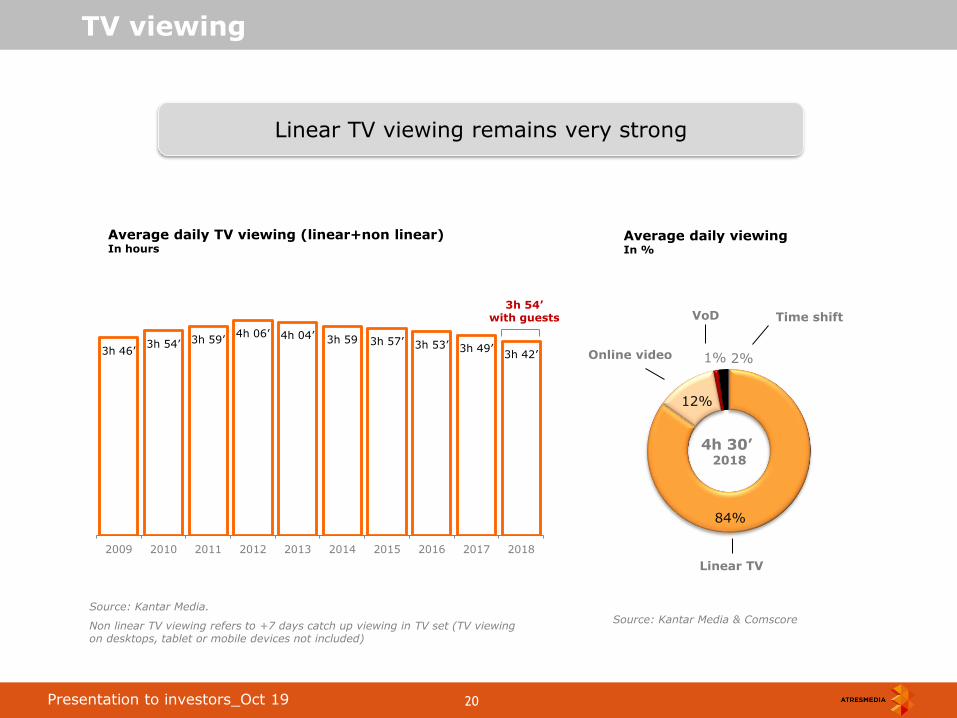
TV viewing
Average daily TV viewing (linear+non linear) In hours
Linear TV viewing remains very strong
84%
12%
1% 2% Online video
Linear TV
4h 30’ 2018
Average daily viewing In %
VoD Time shift
Source: Kantar Media & Comscore
3h 46’ 3h 54’ 3h 59’
4h 06’ 4h 04’ 3h 59 3h 57’ 3h 53’ 3h 49’ 3h 42’
2009 2010 2011 2012 2013 2014 2015 2016 2017 2018
Source: Kantar Media.
Non linear TV viewing refers to +7 days catch up viewing in TV set (TV viewing on desktops, tablet or mobile devices not included)
3h 54’ with guests

21 Roadshow back up_Mar 2013 21 Presentation to investors_Oct 19
Average daily viewing In hours
3h 42’
Ind 4+
13 to 24
4 to 12
25 to 44
45 to 64
>65
TV viewing gap has widened over the years
Source: Kantar Media
Age groups
Spanish TV industry: Audiences
3h 37’
Ind 4+ (+7 days)
5h 52’
5h 02’
4h 27’ 4h 13’
2h 39’ 3h 11’
1h 45’
2h 26’
1h 33’
2h 23’
3h 33’
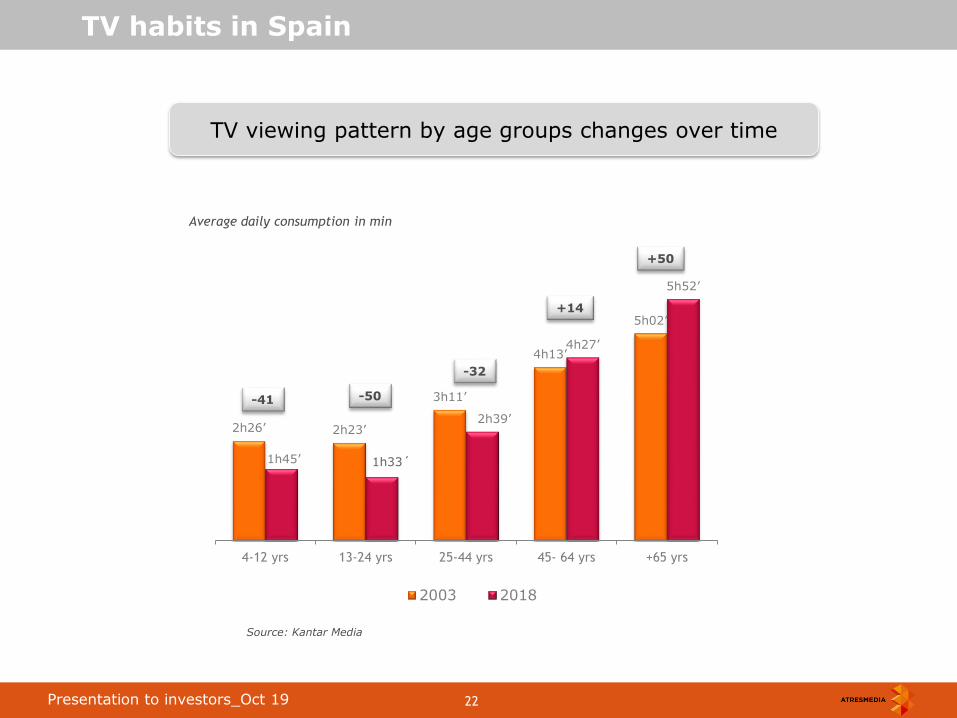
22 Roadshow back up_Mar 2013 22 Presentation to investors_Oct 19
2h26’ 2h23’
3h11’
4h13’
5h02’
1h45’
2h39’
4h27’
5h52’
4-12 yrs 13-24 yrs 25-44 yrs 45- 64 yrs +65 yrs
2003 2018
Source: Kantar Media
TV habits in Spain
-41 -50
-32
+14
+50
Average daily consumption in min
TV viewing pattern by age groups changes over time
1h33´
23 Roadshow back up_Mar 2013 23 Presentation to investors_Oct 19
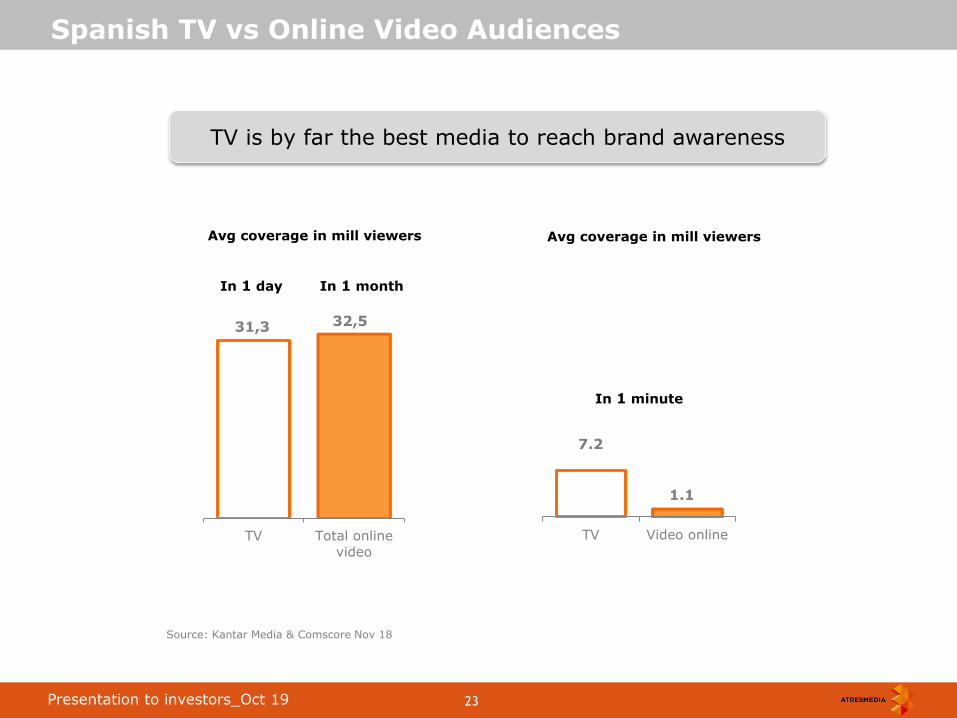
TV is by far the best media to reach brand awareness
Source: Kantar Media & Comscore Nov 18
Spanish TV vs Online Video Audiences
31,3 32,5
TV Total online
video
In 1 day In 1 month
Avg coverage in mill viewers
7.2
1.1
TV Video online
In 1 minute
Avg coverage in mill viewers
24 Roadshow back up_Mar 2013 24 Presentation to investors_Oct 19
Atresmedia’s business information
Atresmedia
25 Roadshow back up_Mar 2013 25 Presentation to investors_Oct 19
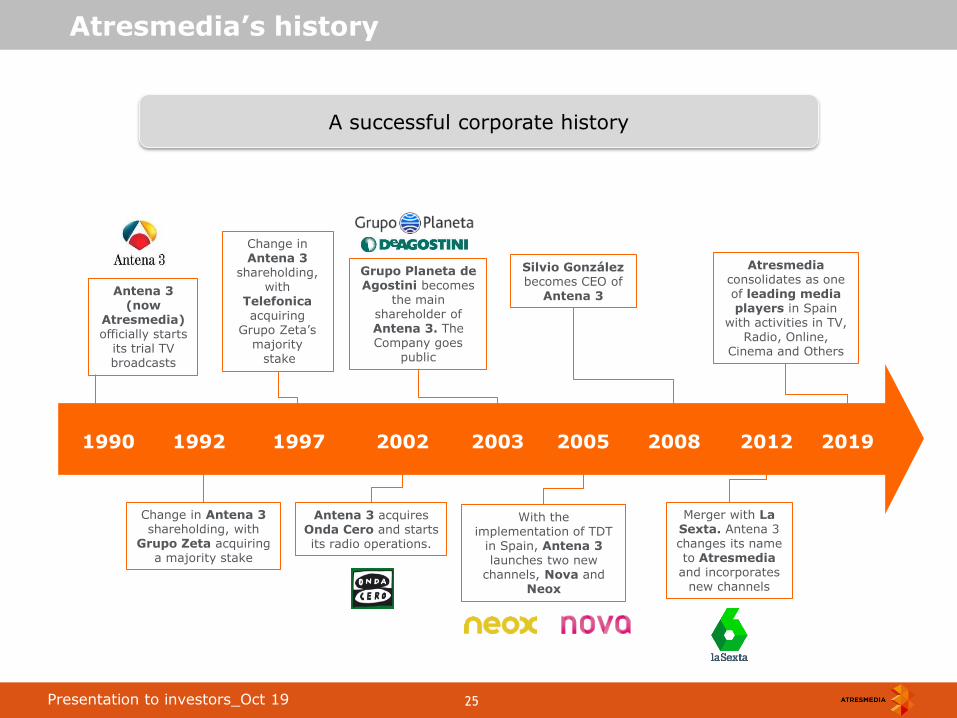
A successful corporate history
Atresmedia’s history
1990 1992 1997 2002 2003 2005 2008 2012
Change in Antena 3 shareholding, with
Grupo Zeta acquiring a majority stake
Change in Antena 3
shareholding, with
Telefonica acquiring
Grupo Zeta’s majority stake
Grupo Planeta de Agostini becomes
the main shareholder of Antena 3. The Company goes
public
Merger with La Sexta. Antena 3 changes its name to Atresmedia and incorporates
new channels
Antena 3 (now
Atresmedia) officially starts
its trial TV broadcasts
Antena 3 acquires Onda Cero and starts its radio operations.
With the implementation of TDT
in Spain, Antena 3 launches two new
channels, Nova and Neox
Silvio González becomes CEO of
Antena 3
2019
Atresmedia consolidates as one of leading media players in Spain
with activities in TV, Radio, Online,
Cinema and Others
26 Roadshow back up_Mar 2013 26 Presentation to investors_Oct 19
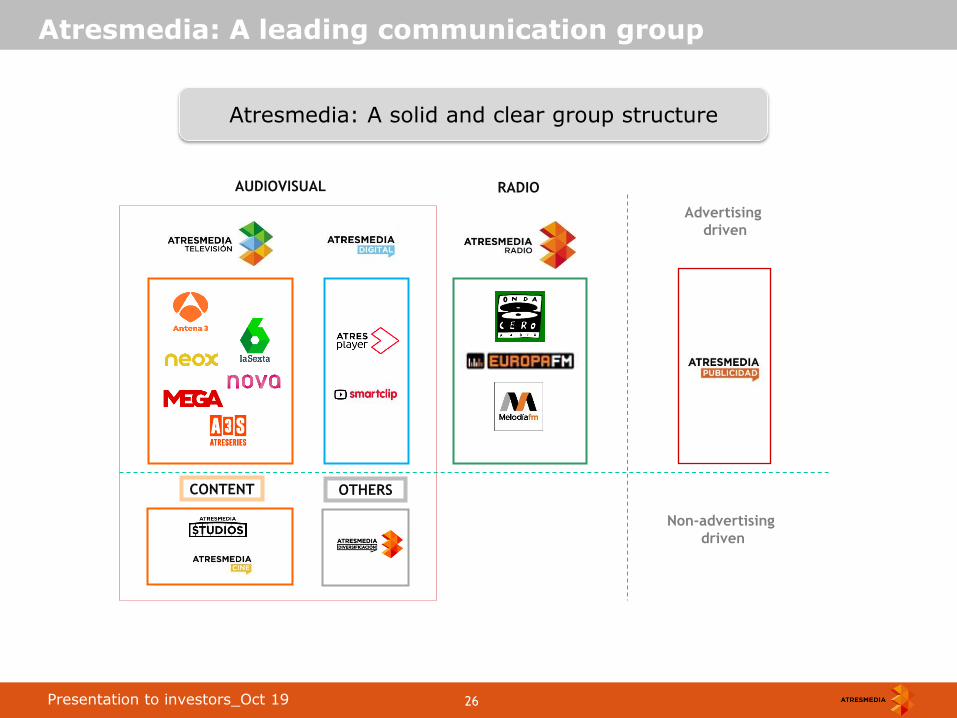
Atresmedia: A leading communication group
Atresmedia: A solid and clear group structure
CONTENT
AUDIOVISUAL RADIO
OTHERS
Advertising
driven
Non-advertising
driven

27 Roadshow back up_Mar 2013 27 Presentation to investors_Oct 19
Source: Infoadex & internal estimates
Atresmedia: Market positioning
82
%
Gross advertising revenues 2018
> € 1bn
> 5 mill spectators/year
> 55 mill international households
Source: Infoadex & internal estimates
Atresmedia grabs 18% of the Total Ad Market in Spain
Total Ad market
€ 5.5bn
2018
17%
5%
42% 39%
32%
14%
9%
7%
~50% Search
~50% Display & Video
+
18% € 5.5bn

28 Roadshow back up_Mar 2013 28 Presentation to investors_Oct 19
TV & Radio as main source of revenues
Source: Infoadex & internal estimates
Atresmedia: Market positioning
Radio NAR
TV NAR
79%
8%
4% 6%
4%
2018 Net
Revenues
€ 1,042m 91%
9%
Revenues by division
Revenues by origin
Non ad revenues
Ad revenues 2018 Net
Revenues
€ 1,042m
Digital NAR
Content Others
29 Roadshow back up_Mar 2013 29 Presentation to investors_Oct 19
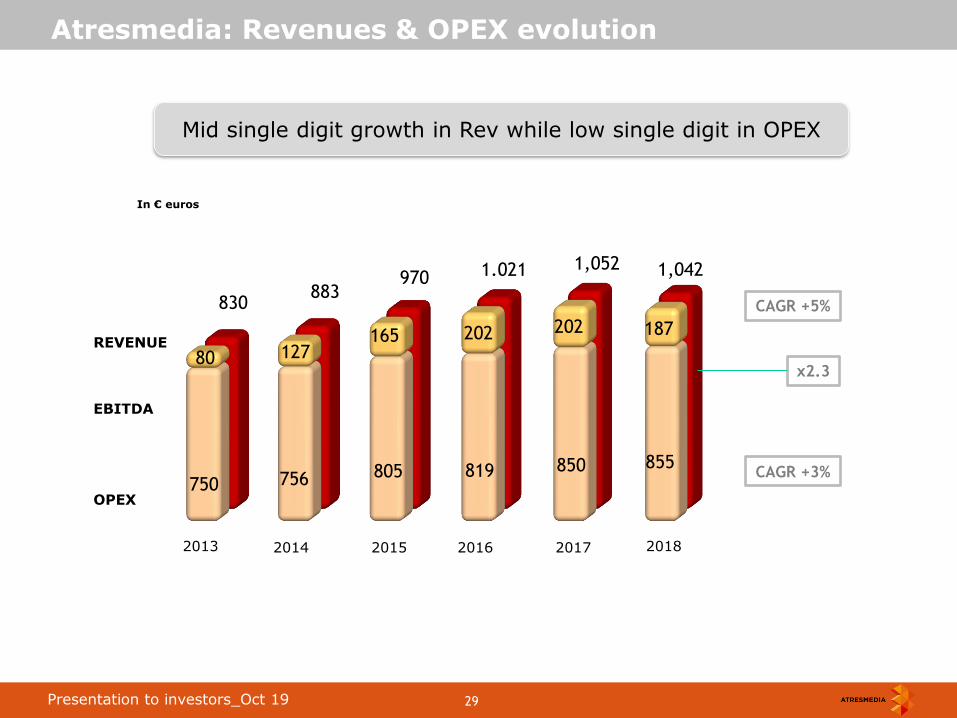
830 883
970 1.021 1,052 1,042
750 756 805 819 850 855
80 127 165 202 202 187
Mid single digit growth in Rev while low single digit in OPEX
Atresmedia: Revenues & OPEX evolution
CAGR +3%
REVENUE
CAGR +5%
OPEX
In € euros
2016 2015 2014 2013 2017
EBITDA
x2.3
2018

30 Roadshow back up_Mar 2013 30 Presentation to investors_Oct 19
Atresmedia: OPEX
Personnel & Overheads
Programming
29%
€855mill
56%
Total OPEX
RADIO
92%
8%
Programming costs, the bulk of Atresmedia’s OPEX
OPEX breakdown
2018
AUDIOVISUAL
Variable costs
16%

31 Roadshow back up_Mar 2013 31 Presentation to investors_Oct 19
Atresmedia TV: Programming costs
In-house production
Total Programming
3rd party content
1/3
2/3 of programming is in-house production
2/3
35%
50%
15%
News & Current affairs
Entertainment
Scripted
Programming hours by format (weighted average based on channels’ audience) In %
Films & Series

32 Roadshow back up_Mar 2013 32 Presentation to investors_Oct 19
Source: Infoadex + Kantar Media.
26,2%
28,3%
26,3%
24,1%
22,4%
24,6%
27,9%
30,5%
35,2%
42,6%
41,5% 42,0%
42,1% 41,4%
40,5% 41,7%
20,8% 21,3%
19,6%
17,8% 17,0% 16,6%
15,8% 17,1%
20,5%
28,8% 27,7%
26,8% 27,1% 26,6%
26,8% 26,9%
2004 2005 2006 2007 2008 2009 2010 2011 2012 2013 2014 2015 2016 2017 2018 1H19
1.7x
1.5x
1.5x
1.3x 1.3x
1.4x 1.5x
Atresmedia Television: Competitive performance
1.3x
Atresmedia Television: A successful story
1.6x
1.8x
1.5x
1.3x
1.8x
1.6x
Ad market share
Audience share
1.5x 1.6x
1.5x
33 Roadshow back up_Mar 2013 33 Presentation to investors_Oct 19
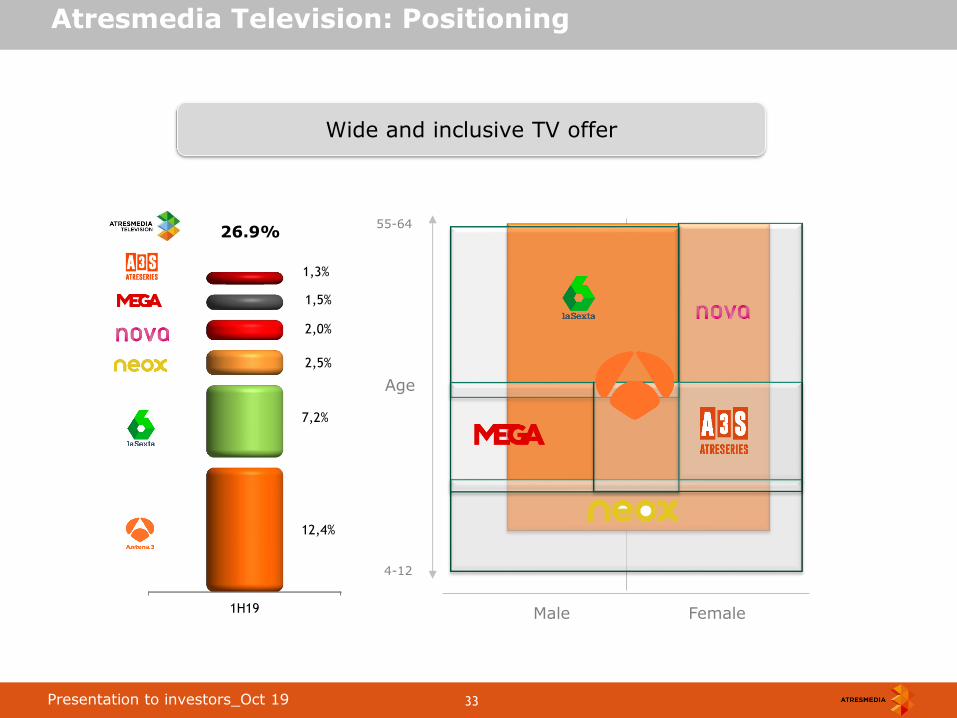
Wide and inclusive TV offer
Atresmedia Television: Positioning
Male Female
55-64
4-12
Age
1H19
12,4%
7,2%
2,5%
2,0%
1,5%
1,3%
26.9%
34 Roadshow back up_Mar 2013 34 Presentation to investors_Oct 19
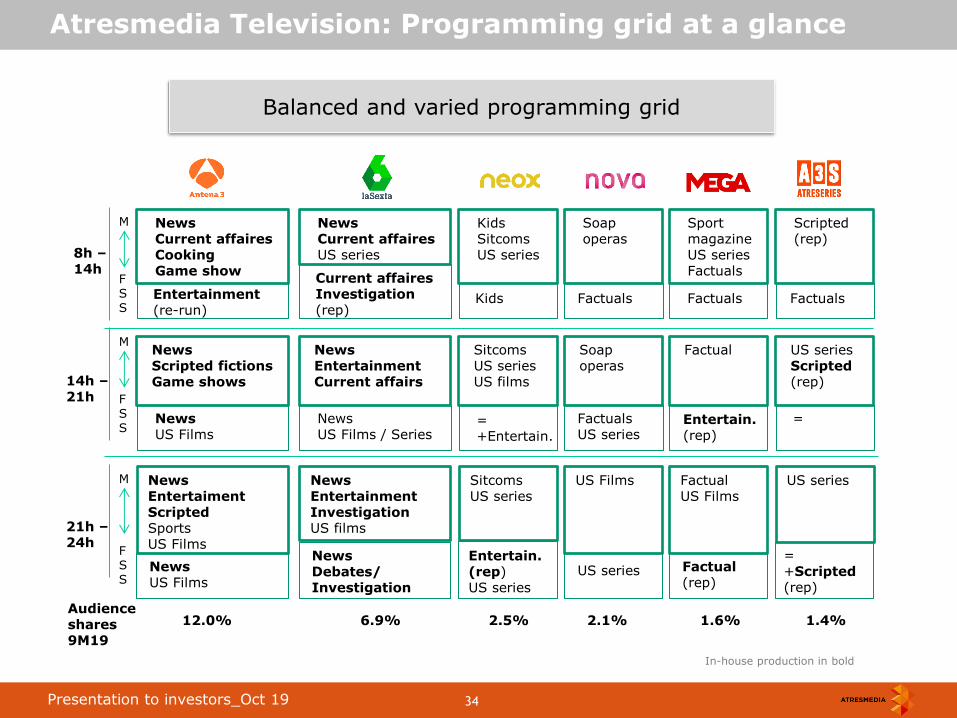
Atresmedia Television: Programming grid at a glance
Entertainment (re-run)
News Scripted fictions Game shows
News Entertaiment Scripted Sports US Films
News US Films
News US Films
News Current affaires Cooking Game show
Current affaires Investigation (rep)
News Entertainment Current affairs
News Entertainment Investigation US films
News US Films / Series
News Debates/ Investigation
News Current affaires US series
Kids
Sitcoms US series US films
Sitcoms US series
Kids Sitcoms US series
Soap operas
US Films
Soap operas
Factual
Factual US Films
Sport magazine US series Factuals
US series Scripted (rep)
US series
Scripted (rep)
= +Entertain.
Entertain.(rep) US series
Factuals
Factuals US series
US series
Entertain. (rep)
Factual (rep)
Factuals Factuals
=
= +Scripted (rep)
8h – 14h
14h – 21h
21h – 24h
Balanced and varied programming grid
12.0% 6.9% 2.5% 2.1% 1.6% 1.4% Audience shares 9M19
In-house production in bold
M F S S
M F S S
M F S S

35 Roadshow back up_Mar 2013 35 Presentation to investors_Oct 19
13,4 13,6 13,5 12,8
12,3 12,3
12,0
13,5 14,5 14,8
14,4
13,3
14,1 14,5
10,2 10,0 9,8
10,1 10,4 10,5
9,2
2013 2014 2015 2016 2017 2018 9M19
13,4 13,8
13,5 12,8
12,1 11,9 11,6
12,2
13,6
14,1 13,5
12,4
13,4 13,8
8,2 7,9 7,8
8,8 8,5 8,6 7,6
2013 2014 2015 2016 2017 2018 9M19
Antena 3: Stable audience ratings
Total Individuals 24h
Commercial Target 24h
Source: Kantar Media. Total Individuals (4y+)
Atresmedia Television: TV audiences by core channel
Source: Kantar Media • 2012-2015: Commercial Target (16-54 y) • As of 2016: Commercial Target (25-59 y)

36 Roadshow back up_Mar 2013 36 Presentation to investors_Oct 19
6,0
7,2 7,4 7,1
6,8 6,9
6,9
6,0
6,7
7,2
6,5 6,2 6,0
5,3
8,5
7,8 7,3 7,2
7,4 7,6 7,9
2013 2014 2015 2016 2017 2018 9M19
6,6
7,9 8,1
8,1
7,4
7,4
7,4 7,4
8,2 8,4
7,6 7,2
7,3
6,4
5,8
5,2
4,8
5,3 5,7 5,7 5,7
2013 2014 2015 2016 2017 2018 9M19
La Sexta: High Commercial Target
Total Individuals 24h
Commercial Target 24h
Source: Kantar Media. Total Individuals (4y+)
Atresmedia Television: TV audiences by second channel
Source: Kantar Media • 2012-2015: Commercial Target (16-54 y) • *As of 2016: Commercial Target (25-59 y)

37 Roadshow back up_Mar 2013 37 Presentation to investors_Oct 19
16,7 16,7 16,7 16,8 16,6 16,5 15,4
29,0 30,7 31,0
30,2 28,7 28,8 28,8
28,8 27,7 26,8 27,1 26,6 26,8 26,5
2013 2014 2015 2016 2017 2018 9M19
13,8 13,6 13,4 14,4 13,6 13,2 12,5
31,4 33,3 33,6
31,0 30,0 30,5 30,3
31,0 30,0 29,2 29,7
28,5 28,4 28,0
2013 2014 2015 2016 2017 2018 9M19
Atresmedia TV: Reducing the gap with its main competitor
Total Individuals 24h
Commercial Target 24h
Source: Kantar Media. Total Individuals (4y+)
Atresmedia Television: TV group audiences
Source: Kantar Media • 2012-2015: Commercial Target (16-54 y) • As of 2016: Commercial Target (25-59 y)

38 Roadshow back up_Mar 2013 38 Presentation to investors_Oct 19
Programming costs: In-house vs external production
In-house 25%
3rd parties
75%
2/3 of the programming costs are internally produced
In-house 75%
3rd parties
25%
In-house vs external programming costs In broadcasting hours
In-
house 64%
3rd parties
36%
Weighted average (based on audience per channel)
Top 50 most watched programmes at Atresmedia are in-house

39 Roadshow back up_Mar 2013 39 Presentation to investors_Oct 19
Atresmedia Digital
Atresplayer, our digital flagship
WEBs, Verticals & MCNs
Latam
AVoD
SVoD
• Largest national online media agency • Footprint in Latam countries
Atresmedia’s OTT

40 Roadshow back up_Mar 2013 40 Presentation to investors_Oct 19
Atresmedia Digital
One of the largest Spanish players in the digital market
ATRESMEDIA SITES
Latam
9th Most visited sites Ranking (Comscore)
Unique users (June 19 Comscore)
>24 mill
72%
78%
28% 22%
Sales Q1 19
By Format * Incl Rich media
By Type of sale
Video*
Non Video
Direct Sales
Programmatic
2.6 mill
Registrations (June 19)
6.8 mill
Videoplayer users (Avg 19)
41 Roadshow back up_Mar 2013 41 Presentation to investors_Oct 19
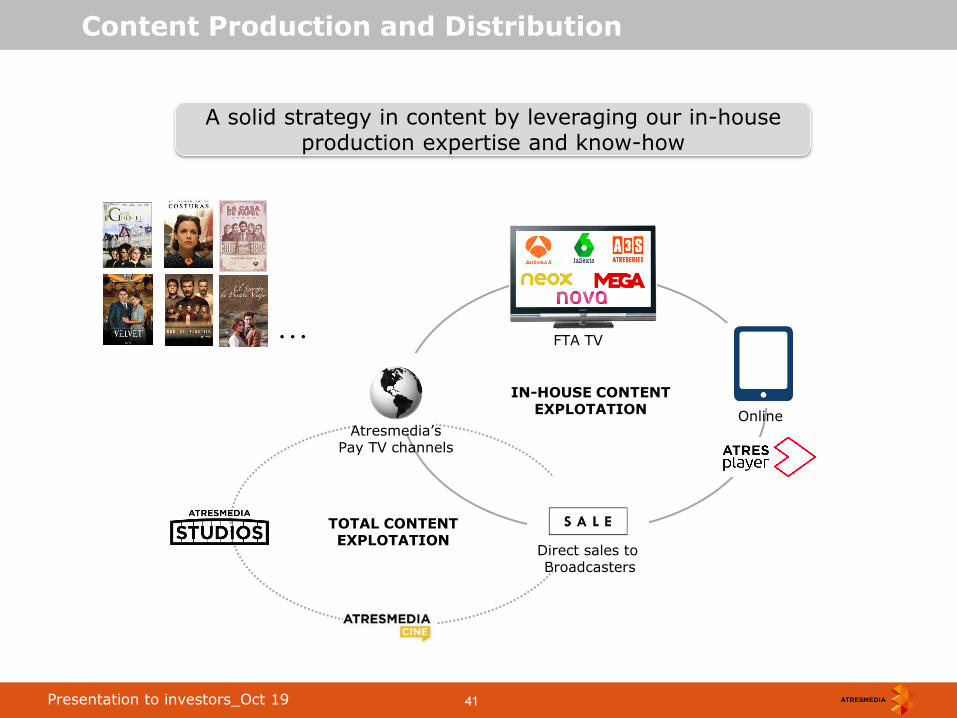
Content Production and Distribution
Direct sales to Broadcasters
A solid strategy in content by leveraging our in-house production expertise and know-how
FTA TV
Atresmedia’s Pay TV channels
Online
…
TOTAL CONTENT EXPLOTATION
IN-HOUSE CONTENT EXPLOTATION

42 Roadshow back up_Mar 2013 42 Presentation to investors_Oct 19
Production & Content sales: Atresmedia International
> 30 countries
> 100 Pay TV operators
1996 2004 2013 2018
17
55
4 1
Subscribers In millions
USA
11%
Latam
59%
Mexico
26%
Europe
4%
2018
55 mill
Up to 57 mill subscribers in our international channels
57
1H19

43 Roadshow back up_Mar 2013 43 Presentation to investors_Oct 19
Production & Content sales: Atresmedia Studios
Atresmedia Studios, a new brand division for 3rd parties content production
DUAL CONTENT
PRODUCTION
APPROACH
COMMISIONING CO-PRODUCTION
Originals IP: No Margins: ~10% Potential clients: Movistar +, Netflix, Amazon, HBO, Apple,…
Multiplatform: OTT, Broadcaster, International Sales,… IP: Yes Margins: ~10-15% Potential markets: Europe Latam RoW
Format: 16 X 50´ Producted by: Atresmedia Studios & Vancouver Media Client: Movistar+ Premiere: Q1 2019
Format: 8 X 50´ Producted by: Atresmedia Studios Co-production Client: Amazon Prime Video Premiere: Nov 2018

44 Roadshow back up_Mar 2013 44 Presentation to investors_Oct 19
Atresmedia Cinema in 2018
Production & Content sales: Atresmedia Cinema
30% of total revenues generated by Spanish films in 2018

45 Roadshow back up_Mar 2013 45 Presentation to investors_Oct 19
Media for Equity
Media for Equity: Exploring new business models
Media for Equity
Exit in 2016
Exit in 2018
Partial exit in 2018
Exit in 2018

46 Roadshow back up_Mar 2013 46 Presentation to investors_Oct 19
Atresmedia Radio: 17% market share
Atresmedia Radio: Positioning & Strategy
# 3 talk radio 1.9 mill listeners
# 3 music radio 1.3 mill listeners
#3 radio player in Spain
3.5 million listeners
17% market share
Source: EGM Q2 19 yearly average Market Share: Infoadex & internal estimates
New music radio
234k listeners
47 Roadshow back up_Mar 2013 47 Presentation to investors_Oct 19
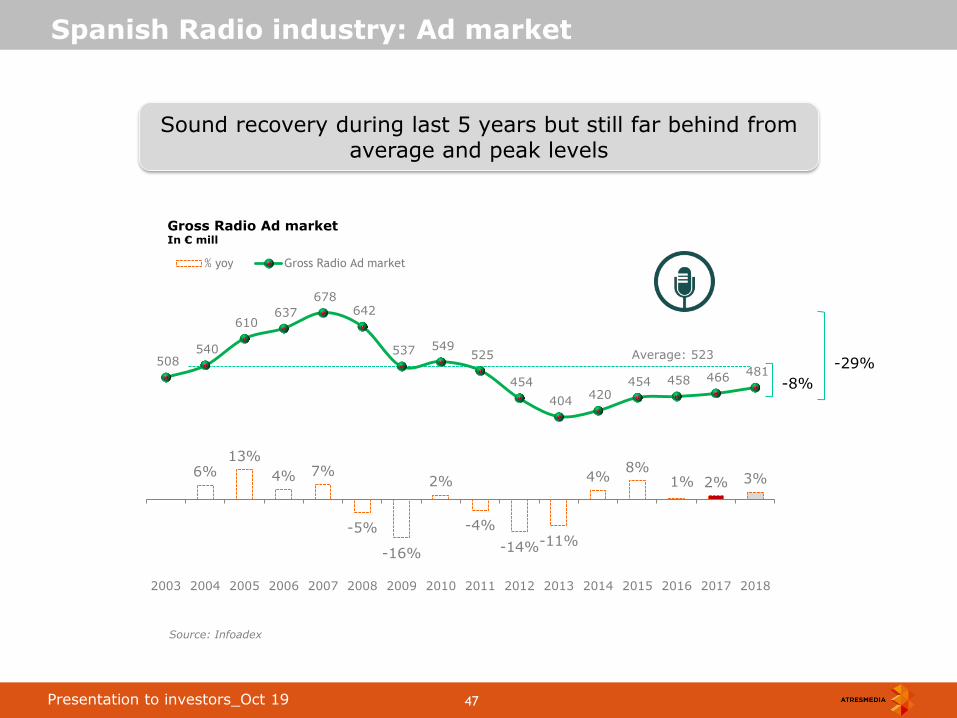
Sound recovery during last 5 years but still far behind from average and peak levels
Gross Radio Ad market In € mill
Source: Infoadex
Spanish Radio industry: Ad market
6% 13%
4% 7%
-5%
-16%
2%
-4%
-14% -11%
4% 8%
1% 2% 3%
508 540
610 637
678 642
537 549 525
454
404 420
454 458 466 481
2003 2004 2005 2006 2007 2008 2009 2010 2011 2012 2013 2014 2015 2016 2017 2018
% yoy Gross Radio Ad market
Average: 523
-8%
-29%

48 Roadshow back up_Mar 2013 48 Presentation to investors_Oct 19
Atresmedia Radio: 3.5 million listeners
Atresmedia Radio: Audiences
Source: EGM Surveys Monday to Friday (.000) (Moving average).
Thousand of listeners
4.119 4.153 4.106 4.091 4.012 3.947 3.875 3.664 3.568 3.470
1.902
1.920 1.910
1.922 1.898 1.961 1.975 1.909 1.908 1.926
1.943
1.947 1.912
1.871 1.805 1.713 1.651
1.522 1.410 1.310
274 286 284 298 309 273 249 233 250 234
2nd 16 3rd 16 1st 17 2nd 17 3rd 17 1st 18 2nd 18 3rd 18 1st 19 2nd 19

49 Roadshow back up_Mar 2013 49 Presentation to investors_Oct 19
Atresmedia’s business guidelines
Atresmedia

50 Roadshow back up_Mar 2013 50 Presentation to investors_Oct 19
Our main business guidelines
DIVERSIFICATION
CONSOLIDATE
AND EXPAND
OUR CORE
BUSINESS
CONTENT
MONETIZATION
Three main business guidelines

51 Roadshow back up_Mar 2013 51 Presentation to investors_Oct 19
Distribution
Atresplayer
Addressable TV
Our main business guidelines
1. CONSOLIDATE
AND EXPAND
OUR CORE
BUSINESS
+ Flexibility
+ Better consumer experience
+ Higher brand awareness
Focus on
digital transformation
Reach
(A3M + Smartclip)
Data
Atresdata
New
TV commercial policy
Leveraging Atresmedia’s
unique reach The highest and most varied of
the market
TV
Radio
Online
video
Display
Expanding our core business by leveraging Atresmedia’s unique position on the spanish market

52 Roadshow back up_Mar 2013 52 Presentation to investors_Oct 19
FREEMIUM MODEL
IP RIGHTS RETENTION LEADING BRANDS
HYPERDISTRIBUTION
Our main business guidelines
2. ENHANCE
OUR CONTENT
PRODUCTION AND
DISTRIBUTION
CAPABILITIES
+ ATRESMEDIA STUDIOS
AVOD + SVOD
Maximizing Atresmedia’s content production and distribution in all possible ways
53 Roadshow back up_Mar 2013 53 Presentation to investors_Oct 19
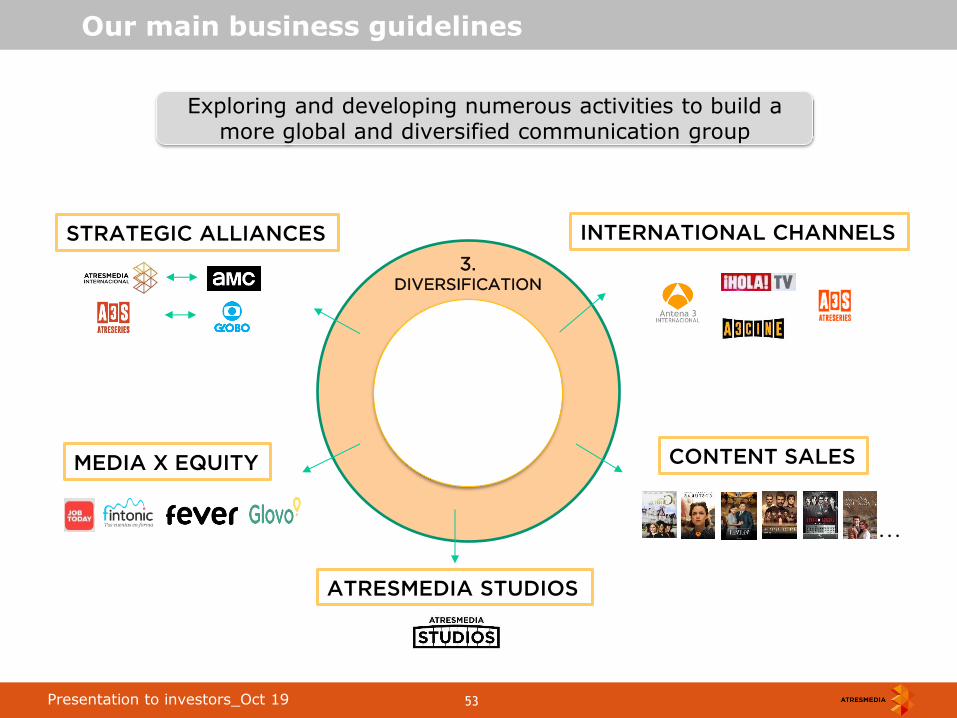
Our main business guidelines
3. DIVERSIFICATION
ATRESMEDIA STUDIOS
INTERNATIONAL CHANNELS
CONTENT SALES
STRATEGIC ALLIANCES
MEDIA X EQUITY
…
Exploring and developing numerous activities to build a more global and diversified communication group

54 Roadshow back up_Mar 2013 54 Presentation to investors_Oct 19
Our main business guidelines
Dividend policy Total Net Debt Target
PAYOUT RATIO ≥80%
€ 250 mill
€ 200 mill
Operating Cash Flow
≥ 90% EBITDA
Confirming our financial targets
Dividend (€/share)
2014
2015
2016
2017
2018
Payout
0.20
82% 0.36
96%
0.45+0.47* 82%*
0.52 83%
81% 0.45
* Special dividend. Not included in the payout
€ 218 mil (1H19)

55 Roadshow back up_Mar 2013 55 Presentation to investors_Oct 19
Ownership Structure
No significant changes in the ownership structure over the last years
Planeta-De Agostini: RTL: Imagina: Treasury stock: Free-float:
41.7% 18.7% 4.2% 0.3%
35.1%
2019
Mr. Silvio González
CEO Executive
Ms. Patricia Estany Coordinating Director
Ms. Aurora Catá Member
Ms. María Entrecanales Member
Mr. Elmar Heggen Member
Proprietary
Mr. Carlos Fernández
Member Proprietary Ms. Mónica Ribé
Member
Mr Nicolas de Tabernaust
Member Proprietary
PASA
(Planeta
deAgostini)
(4)
UFA (RTL)
(2)
Independents
(4)
Mr. José Creuheras Chairman:
Executive and proprietary
Mr. Javier Bardají
Executive
Mr. Maurizio Casals Member
Proprietary
Mr. Marco Drago Member
Proprietary Executives
(2)
Board of Directors

56 Roadshow back up_Mar 2013 56 Presentation to investors_Oct 19
Back up: Financial Results
Back up
57 Roadshow back up_Mar 2013 57 Presentation to investors_Oct 19
<<<
<<<<<<<<<<<<<<<<<
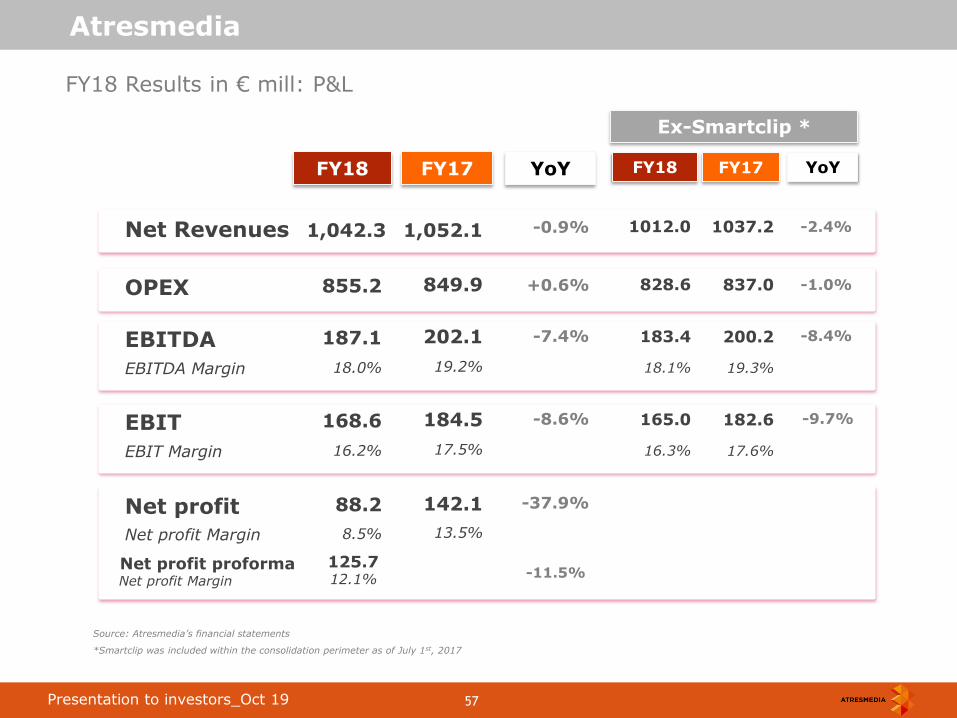
<< Net Revenues 1,042.3
EBITDA 187.1
Net profit 88.2
FY18 FY17
-0.9%
-7.4%
YoY
-37.9%
OPEX 855.2 +0.6%
Atresmedia
FY18 Results in € mill: P&L
EBITDA Margin 18.0%
Net profit Margin 8.5%
Source: Atresmedia’s financial statements
*Smartclip was included within the consolidation perimeter as of July 1st, 2017
EBIT 168.6 -8.6%
EBIT Margin 16.2%
1,052.1
202.1
142.1
849.9
19.2%
13.5%
184.5
17.5%
1012.0
183.4
FY18
-2.4%
-8.4%
YoY
828.6 -1.0%
18.1%
165.0 -9.7%
16.3%
Ex-Smartclip *
1037.2
200.2
FY17
837.0
19.3%
182.6
17.6%
125.7 12.1% -11.5%
Net profit proforma Net profit Margin
58 Roadshow back up_Mar 2013 58 Presentation to investors_Oct 19
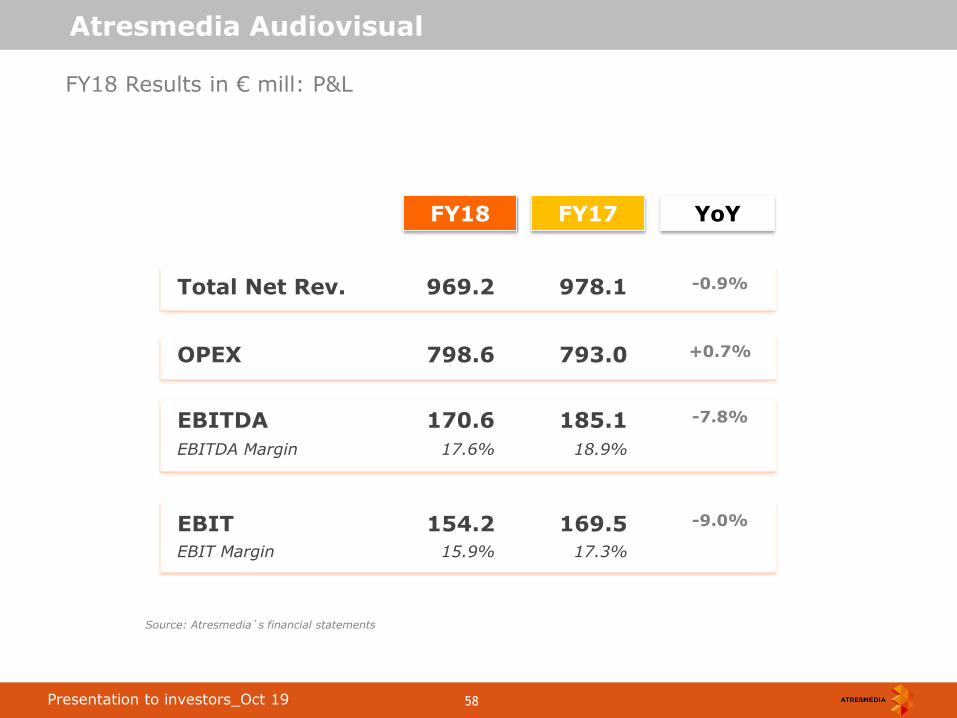
Total Net Rev. 969.2 978.1
EBITDA 170.6 185.1
EBIT 154.2 169.5
FY18 FY17
-0.9%
-7.8%
YoY
-9.0%
OPEX 798.6 793.0 +0.7%
Atresmedia Audiovisual
FY18 Results in € mill: P&L
EBITDA Margin 17.6% 18.9%
EBIT Margin 15.9% 17.3%
Source: Atresmedia`s financial statements

59 Roadshow back up_Mar 2013 59 Presentation to investors_Oct 19
Net Revenues 82.5 83.5
EBITDA 16.5 17.1
EBIT 14.4 15.0
FY18 FY17
-1.2%
-3.3%
YoY
-3.8%
OPEX 66.0 66.5 -0.7%
Atresmedia Radio
FY 18 Results in € mill: P&L
EBITDA Margin 20.0% 20.4%
EBIT Margin 17.5% 18.0%
Source: Atresmedia’s financial statements

60 Roadshow back up_Mar 2013 60 Presentation to investors_Oct 19
Atresmedia
1H 19 Results in € mill: P&L
Source: Atresmedia’s financial statements
<<<
<<<<<<<<<<<<<<<<<
<< Net Revenues 540.0
EBITDA 103.8
Net profit 69.6
1H 19
-1.9%
+2.5%
YoY
+0.5%
OPEX 436.1 -2.9%
EBITDA Margin 19.2%
Net profit Margin 12.9%
EBIT 94.0 +2.5%
EBIT Margin 17.4%
550.6
101.3
69.3
449.4
18.4%
12.6%
91.7
16.6%
1H 18
61 Roadshow back up_Mar 2013 61 Presentation to investors_Oct 19
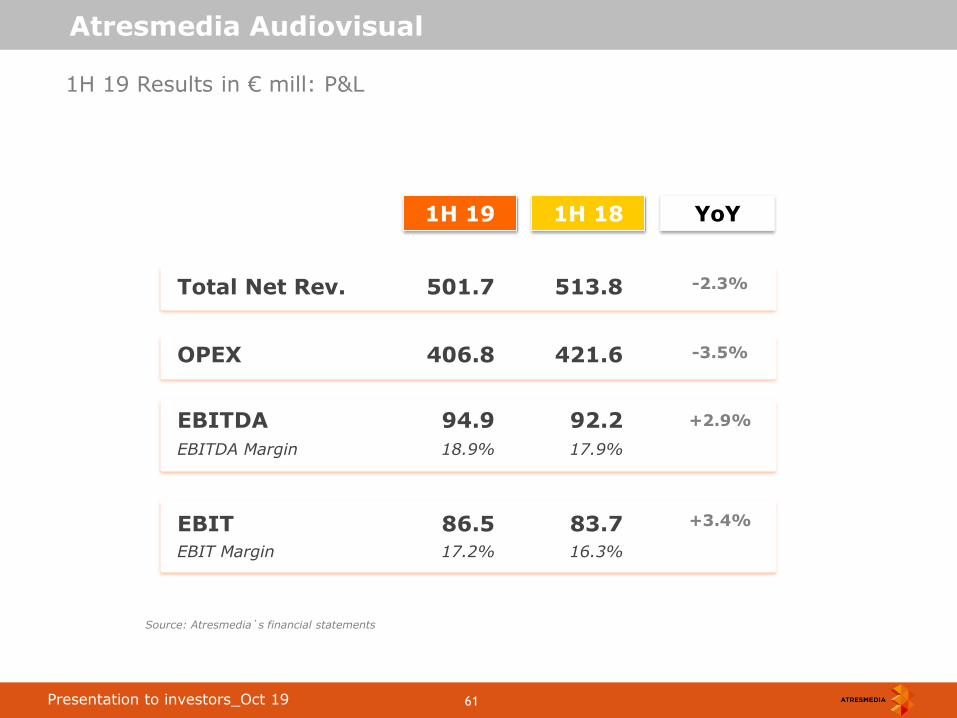
Atresmedia Audiovisual
1H 19 Results in € mill: P&L
Source: Atresmedia`s financial statements
Total Net Rev. 501.7
EBITDA 94.9
EBIT 86.5
1H 19
-2.3%
+2.9%
YoY
+3.4%
OPEX 406.8 -3.5%
EBITDA Margin 18.9%
EBIT Margin 17.2%
513.8
92.2
83.7
1H 18
421.6
17.9%
16.3%
62 Roadshow back up_Mar 2013 62 Presentation to investors_Oct 19
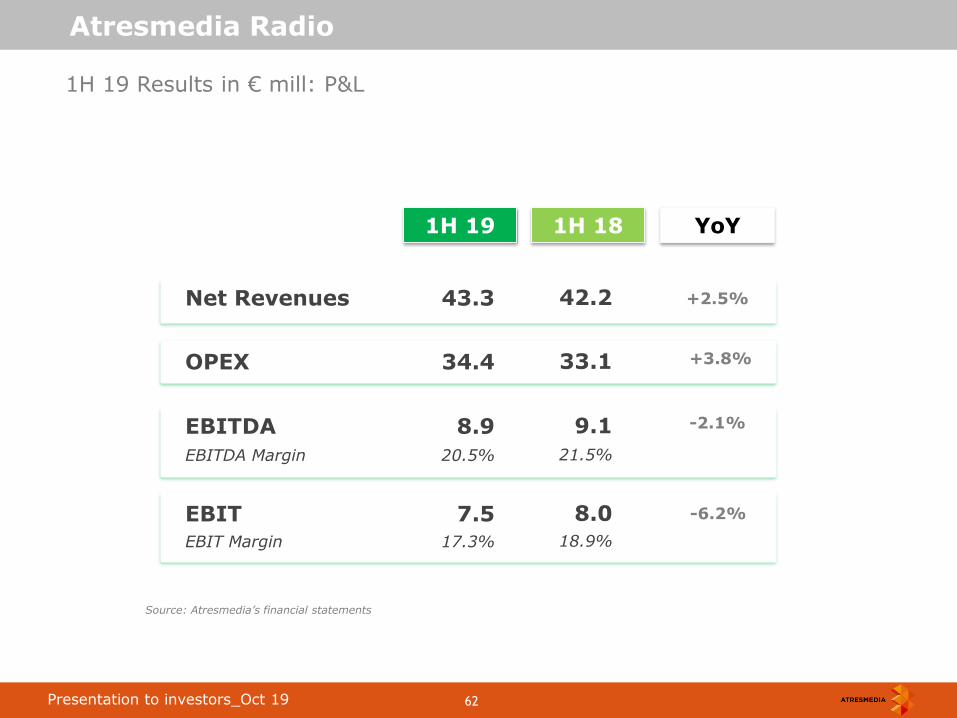
Atresmedia Radio
1H 19 Results in € mill: P&L
Net Revenues 43.3
EBITDA 8.9
EBIT 7.5
1H 19 1H 18
+2.5%
-2.1%
YoY
-6.2%
OPEX 34.4 +3.8%
EBITDA Margin 20.5%
EBIT Margin 17.3%
Source: Atresmedia’s financial statements
42.2
9.1
8.0
33.1
21.5%
18.9%
63 Roadshow back up_Mar 2013 63 Presentation to investors_Oct 19
Legal Notice
The information contained in this presentation has not been independently verified and is, in any case, subject to
negotiation, changes and modifications.
None of the Company, its shareholders or any of their respective affiliates shall be liable for the accuracy or completeness
of the information or statements included in this presentation, and in no event may its content be construed as any type of
explicit or implicit representation or warranty made by the Company, its shareholders or any other such person. Likewise,
none of the Company, its shareholders or any of their respective affiliates shall be liable in any respect whatsoever
(whether in negligence or otherwise) for any loss or damage that may arise from the use of this presentation or of any
content therein or otherwise arising in connection with the information contained in this presentation. You may not copy or
distribute this presentation to any person.
The Company does not undertake to publish any possible modifications or revisions of the information, data or statements
contained herein should there be any change in the strategy or intentions of the Company, or occurrence of unforeseeable
facts or events that affect the Company’s strategy or intentions.
This presentation may contain forward-looking statements with respect to the business, investments, financial condition,
results of operations, dividends, strategy, plans and objectives of the Company. By their nature, forward-looking
statements involve risk and uncertainty because they reflect the Company’s current expectations and assumptions as to
future events and circumstances that may not prove accurate. A number of factors, including political, economic and
regulatory developments in Spain and the European Union, could cause actual results and developments to differ materially
from those expressed or implied in any forward-looking statements contained herein.
The information contained in this presentation does not constitute an offer or invitation to purchase or subscribe for any
ordinary shares, and neither it nor any part of it shall form the basis of or be relied upon in connection with any contract or
commitment whatsoever.
Investor Relations Department
Additional information
Phone: +34 91 623 46 14
E-mail: [email protected]
Web: www.atresmediacorporacion.com