presentación de powerpoint - falabella.com · 1 mall 26,000 m2 gla. key figures 5 ... management...
TRANSCRIPT

SACI FALABELLA
CORPORATE PRESENTATION
AUGUST 2015
CONTENTS
• The Company
• Key Investment Highlights
• Consolidated Statements
• Corporate Structure
• Overview per Business Unit

FIVE BUSINESS UNITS – 126 YEARS OF HISTORY
3
DEPARTMENT
STORES
HOME
IMPROVEMENTSUPERMARKETS
FINANCIAL
SERVICESREAL ESTATE
US$ 4,055 mRevenues
US$ 5,713mRevenues1
US$ 1,986 mRevenues
US$ 6,038 mLoan Book
2.0 millionm2 GLA2
1 million m2 of additional GLA in free standing stores in the
region.
100 stores 244 stores 102 stores4.7 million
CMR accounts20 / 19
Malls / Power
& Shopping Centers
Note: Revenues as of June 2015 LTM. Number of stores/malls as of August 25th 2015. Number of CMR accounts as of June 2015. FX rates as of July 1st, 2015 (639.04 CLP/US$).
Data includes Sodimac Colombia and Aventura Plaza, which do not consolidate.
1. Does not include Uruguay revenue.
2. The Falabella Group owns 991.000 m2 of additional GLA in free standing stores across the region.

PRESENCE IN 6 COUNTRIES IN LATIN AMERICA
4
Note: Number of stores and sales area as of August 25th 2015. Number of CMR accounts with balance and employees as of June 2015.
Includes Sodimac Colombia and Aventura Plaza in Peru, which the Company does not consolidate.
DEPARTMENT STORESHOME
IMPROVEMENTSUPERMARKETS FINANCIAL SERVICES REAL ESTATE
45 stores
304,000 m2
85 stores
703,000 m2
53 stores
187,000 m2
2,353,000 active
CMR cards
25 malls
1,422,000 m2 GLA
26 stores
162,000 m2
57 stores
372,000 m2
49 stores
182,000 m2
1,033,000 active
CMR cards
18 stores
114,000 m2
35 stores
338,000 m2
817,000 active
CMR cards
11 stores
58,000 m2
8 stores
84,000 m2
519,000 active
CMR cards
58 stores
132,000 m2
1 store
12,000 m2
13 malls
521,000 m2 GLA
1 mall
26,000 m2 GLA

KEY FIGURES
5
Note: Revenues and EBIDA does not consider Sodimac Colombia and Aventura Plaza in Peru, which do not consolidate.
Number of stores and sales area as of August 25th 2015.
CMR Accounts
446stores
39malls
Loan Book
2,649,000 m2
sales area
1,969,000 m2
GLA
6,038 M US$ +4,722,000
Total Revenues
12,475 M US$
Mix by Country (LTM)
+49,900
+29,200
+14,600
+5,500
+3,500
+200
Employees in the Region
Main Figures
59%
25%
6%
7% 2% <1%
Revenues
Total: 102,900
71%
21%
5%4%
EBITDA

CONTENTS
• The Company
• Key Investment Highlights
• Consolidated Statements
• Corporate Structure
• Overview per Business Unit
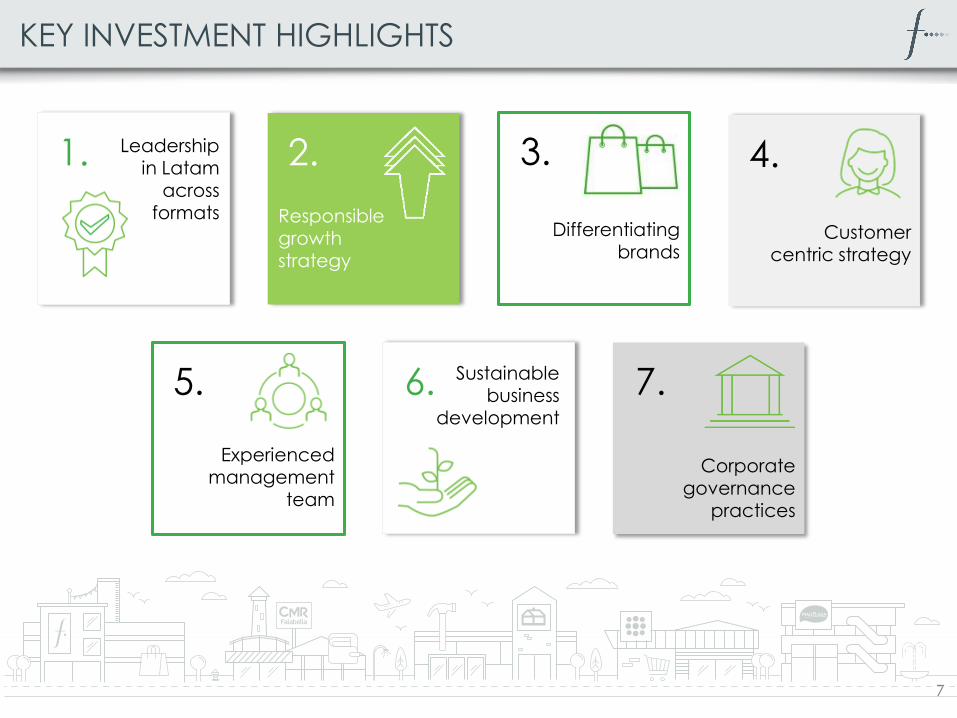
KEY INVESTMENT HIGHLIGHTS
7
1. 2. 3. 4.
5. 6. 7.
Leadership in Latam
across formats Responsible
growth strategy
Customer
centric strategy
Experienced management
team
Differentiating
brands
Sustainable business
development
Corporate governance
practices

CMR Accounts
2,353,000
1,033,000
817,000
519,000
Revenues
1,003 M US$
983 M US$
Revenues
2,986 M US$
891 M US$
1,275 M US$
263 M US$
297 M US$
1. LEADERSHIP IN LATAM ACROSS FORMATS
8
Home Improvement Financial Services
Revenues
2,040 M US$
895 M US$
581 M US$
538 M US$Only relevant player
Department Stores Real Estate
25 Shopping Malls
GLA 1.4 M m²
13 Shopping Malls
GLA 0.5 M m²
1 Shopping Mall
Supermarkets
Market position
Department Stores in Chile Home Improvement in Chile Supermarkets in Peru
1. Revenues as of June 2015 LTM. Number of CMR accounts, malls and GLA as of June 2015. FX rates as of July 1st, 2015 (639.04 CLP/US$).
2. Sales per square meter as of March 2015. FX rates as of April 1st, 2015 (626,67 CLP/US$). Tottus’ sales area excludes check out area, in order to compare with peer’s reported sales per
square meter.
Sales / m2 (US$)2
#1
#1
#1
#1
#1
#1
Market position Market position
#2
#3
#4
#4
Market position Market position
#1
#1
#1
#1
Market Position1
2013
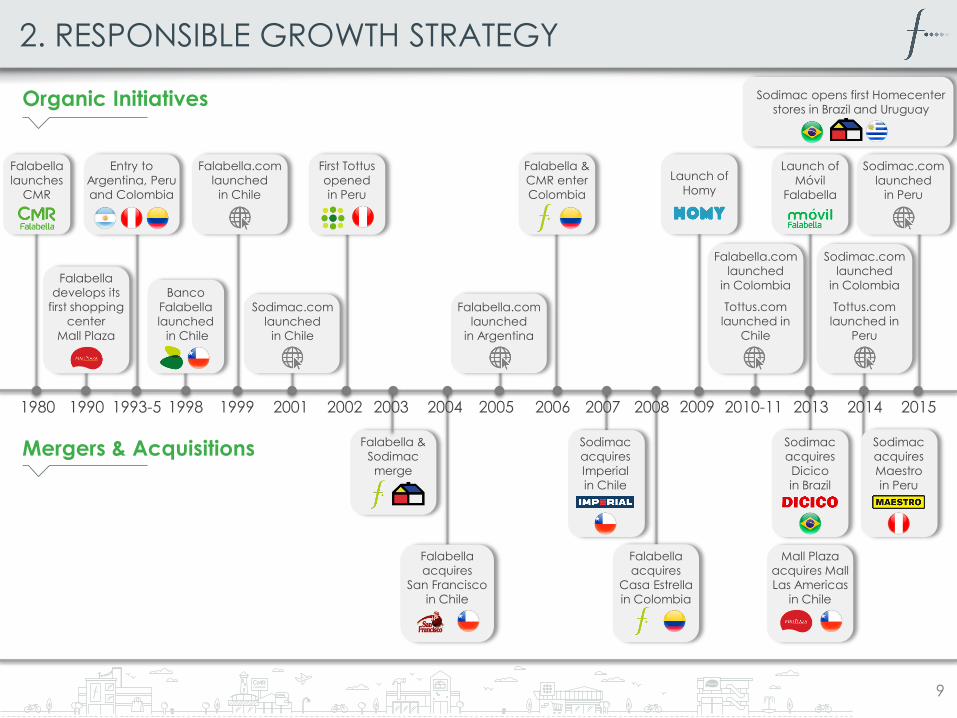
2. RESPONSIBLE GROWTH STRATEGY
9
2002 2003 2004 2006 2007 2014
Launch of
Móvil
Falabella
Falabella
acquires
San Francisco
in Chile
First Tottus
opened
in Peru
Falabella &
CMR enter
Colombia
Sodimac
acquires
Dicico
in Brazil
Sodimac
acquires
Imperial
in Chile
1980 1990 1993-5
Falabella
launches
CMR
Falabella
develops its
first shopping
center
Mall Plaza
Entry to
Argentina, Peru
and Colombia
Sodimac
acquires
Maestro
in Peru
19991998
Banco
Falabella
launched
in Chile
2005 2010-112001
Falabella.com
launched
in Chile
Falabella.com
launched
in Argentina
Sodimac.com
launched
in Peru
Sodimac.com
launched
in Colombia
Tottus.com
launched in
Peru
Sodimac.com
launched
in Chile
2008
Falabella
acquires
Casa Estrella
in Colombia
Mall Plaza
acquires Mall
Las Americas
in Chile
Sodimac opens first Homecenter
stores in Brazil and Uruguay
2015
Organic Initiatives
Mergers & Acquisitions
Falabella.com
launched
in Colombia
Tottus.com
launched in
Chile
Falabella &
Sodimac
merge
2009
Launch of
Homy
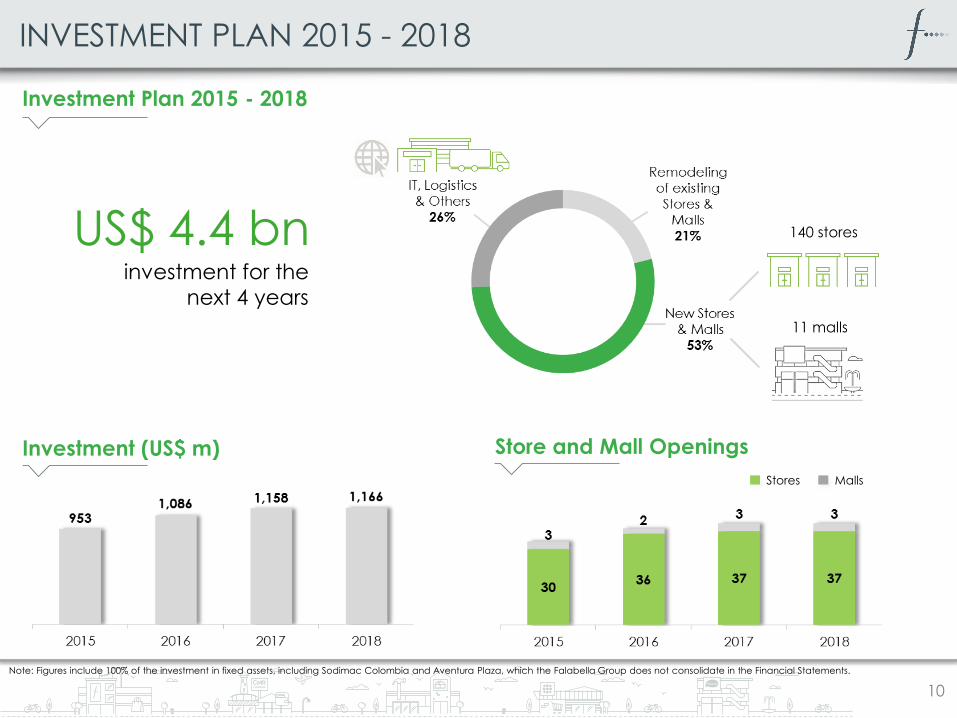
Investment Plan 2015 - 2018
10
Investment (US$ m)
investment for the
next 4 years
Store and Mall Openings
140 stores
11 malls
Note: Figures include 100% of the investment in fixed assets, including Sodimac Colombia and Aventura Plaza, which the Falabella Group does not consolidate in the Financial Statements.
US$ 4.4 bn
INVESTMENT PLAN 2015 - 2018
Stores Malls

3. DIFFERENTIATING BRANDS
11
Exclusive Brands
Private Labels

4. CUSTOMER CENTRIC STRATEGY
12
+290million
transactions in our retail businesses
350million
visits to our shopping centers
in the region
+4.7million
CMR accounts with a balance
+1.4million
bank accounts withBanco Falabella
Passengers travelled using
Viajes Falabella
300,000
Commercial
Platform
Self Service
Stations
ATM
Contact
Center
Points of
Sale
Social
Networks
Mobile
Apps
Websites
→
→
→
→ When does
she purchase
What does
she like
How much
does she
spend
Means of
payment
What does
she buy
Where
does she
purchase
→
→
Our Customers1
Customer knowledge through consistent interaction
1. Number of CMR accounts as of June 2015. Other data as of December 2014.

5. EXPERIENCED MANAGEMENT TEAM
13
CEO- 20 years -
General
Counsel
- 20 years -
Peru Country
Manager
- 26 years -
Colombia
Country
Manager
- 20 years -
Chief
Planning and
Development
Officer
- 6 years -
CFO
- 8 years -
Argentina
Country
Manager
- 16 years -
Brazil Country
Manager
- 2 years -
CIO
- 23 years -
Department
Stores GM
- 15 years -
Home
Improvement
GM
- 13 years -
Supermarkets
GM
- 13 years -
Financial
Services GM
- 6 years -
Mall Plaza
GM
- 25 years -
Open Plaza
GM
- 20 years -
+102,900employees
46%women
+75,000employees
evaluated
+3.6million hours
of training
30%of employees
belong to a union.
53% in Chile.
16 years
in averagein the Group
Note: Number of employees as of June 2015. Other figures as of December 2014.
Main Executives
Employees
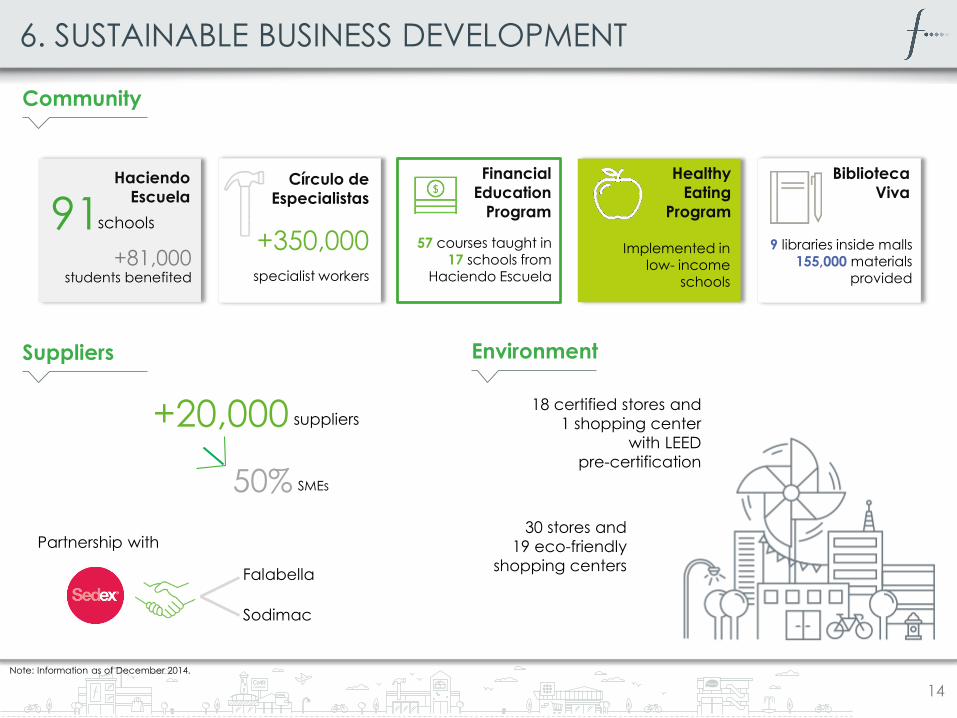
6. SUSTAINABLE BUSINESS DEVELOPMENT
14
57 courses taught in17 schools from
Haciendo Escuela
Financial
Education
Program
Implemented in low- income
schools
Partnership with
18 certified stores and
1 shopping center
with LEED
pre-certification
30 stores and
19 eco-friendly
shopping centers
91schools
+81,000students benefited
Haciendo
Escuela
specialist workers
Círculo de
Especialistas
Note: Information as of December 2014.
+20,000 suppliers
50% SMEs
Community
Suppliers Environment
Healthy
Eating
Program
Biblioteca
Viva
9 libraries inside malls155,000 materials
provided
+350,000
Falabella
Sodimac

7. CORPORATE GOVERNANCE PRACTICES
15
Note: Information as of 31st March 2015
Audit
Committee
Strategy
Committee
Compensation
and Talent
Committee
Presence of an
independent
director at
holding level
and in relevant
subsidiaries
Chairman
Carlo Solari Donaggio 2014
Vice-Chairman
Juan Carlos Cortés Solari 2014
Directors
José Luis del Rio Goudie 2003
Sergio Cardone Solari 1986
Carolina del Rio Goudie 2011
María Cecilia Karlezi Solari 2003
Paola Cuneo Queirolo 2014
Carlos Alberto Heller Solari 2002
Independent Director
Hernán Büchi Buc 1996
Controlling
Group
consisting of
7 families
Free Float
19%
Controlling
Group
81%
Board of Directors Board Committee

CONTENTS
• The Company
• Key Investment Highlights
• Consolidated Statements
• Corporate Structure
• Overview per Business Unit

CONSOLIDATED STATEMENTS
17Note: Financial information at FX rates as of July 1st, 2015 (639.04 CLP/US$).
Income Statement
(USD Million) 2Q14 2Q15 Var % 1S14 1S15 Var %
Total Revenues 2,845 3,133 10.1% 5,543 6,183 11.6%
Gross Profit 994 1,121 12.8% 1,919 2,172 13.2%
Gross Margin 34.9% 35.8% 34.6% 35.1%
SG&A Expenses (701) (799) 14.0% (1,366) (1,562) 14.3%
SG&A / Revenues (24.6%) (25.5%) (24.7%) (25.3%)
Operational Income 293 322 9.9% 553 610 10.4%
Operational Margin 10.3% 10.3% 10.0% 9.9%
Depreciation + Amortization 77 90 152 181
EBITDA 370 411 11.2% 704 791 12.3%
EBITDA Margin 13.0% 13.1% 12.7% 12.8%
Other Income / (Expenses) (2) 1 1 (6)
Net Financial Income / (Cost) (72) (79) (125) (123)
Profit / (Loss) in Associates 7 8 18 19
Exchange Rate Differences (5) (1) (24) (16)
Non-Operating Profit (71) (70) (1.2%) (131) (126) (4.2%)
Profit Before Tax Expenses 221 251 13.5% 422 485 14.9%
Income Tax (43) (54) (82) (108)
Minority Interest (15) (16) (29) (30)
Net Profit / (Loss) 164 181 10.0% 311 346 11.5%
Net Margin 5.8% 5.8% 5.6% 5.6%

CONSOLIDATED STATEMENTS
18
Note: Financial information at FX rate as of July 1st, 2015 (639.04 CLP/US$).
Balance Sheet
(USD Million) Dec 14 Jun 15 (USD Million) Dec 14 Jun 15
Cash & cash equivalents 331 274 Other current financial liabilit ies 1,153 1,123
Current trade & other receivables 2,286 2,361 Current trade & other payables 1,512 1,275
Inventories 1,595 1,603 Others 448 396
Others 277 267
Total Non-Banking Current Assets 4,489 4,506 Total Non-Banking Current Liabilit ies 3,112 2,794
Non-Current trade & other receiv ables 323 316 Other non-current financial liabilit ies 3,625 3,828
Goodwill 724 716 Others 685 687
PP&E & Investment properties 6,638 6,724
Others 891 1,006
Total Non-Banking Non-Current Assets 8,575 8,762 Total Non-Banking Non-Current Liab. 4,310 4,515
Total Non-Banking Operations Assets 13,064 13,267 Total Non-Banking Oper. Liabilit ies 7,421 7,309
Loans & accounts receiv able from clients 3,412 3,588 Total Banking Oper. Liabilit ies 3,857 4,281
Others 1,278 1,484 TOTAL LIABILITIES 11,278 11,590
Total Banking Operations Assets 4,690 5,071 Shareholders' Equity 6,476 6,748
TOTAL ASSETS 17,754 18,339 TOTAL EQUITY & LIABILITIES 17,754 18,339
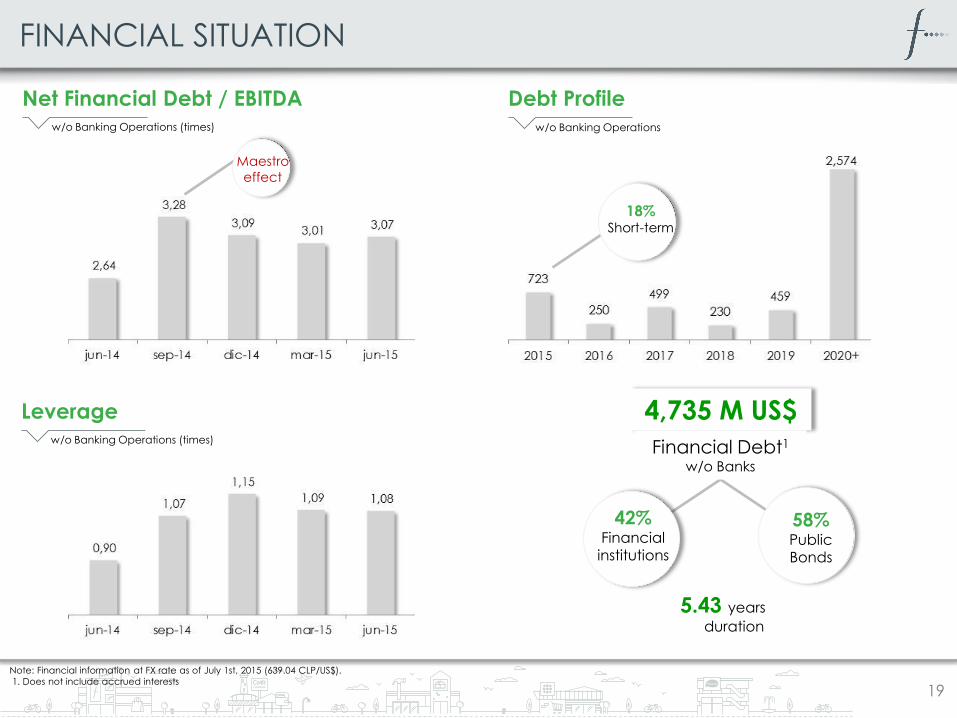
FINANCIAL SITUATION
19
w/o Banking Operations (times)
4,735 M US$
58%PublicBonds
42%Financialinstitutions
Note: Financial information at FX rate as of July 1st, 2015 (639.04 CLP/US$).
1. Does not include accrued interests
5.43 years
duration
w/o Banking Operations
Net Financial Debt / EBITDA Debt Profile
w/o Banking Operations (times)
Leverage
Financial Debt1
w/o Banks
Maestro
effect
18%Short-term

CONTENTS
• The Company
• Key Investment Highlights
• Consolidated Statements
• Corporate Structure
• Overview per Business Unit

CORPORATE STRUCTURE
21
SACI Falabella
Chile Peru1 Argentina Colombia
94%
Brazil Uruguay
Sodimac 100%
Imperial 60%
Tottus 88%
CMR 100%
Banco Falab.100%
Open Plaza 100%
Mall Plaza 60%
Falabella 100% Saga Falab. 95%
Sodimac 100%
Tottus 100%
Banco Falab.100%
Open Plaza 100%
Avent. Plaza 40%2
Falabella 100%
Sodimac 100%
CMR 100%
Falabella 65%
Banco Falab. 65%
Sodimac 49%2
Mall Plaza
100%
20%
Dicico 50.1%
Maestro 100%
Sodimac 100%
1 Through Falabella Perú S.A.A..
2 Does not consolidate.

CONTENTS
• The Company
• Key Investment Highlights
• Consolidated Statements
• Corporate Structure
• Overview per Business Unit
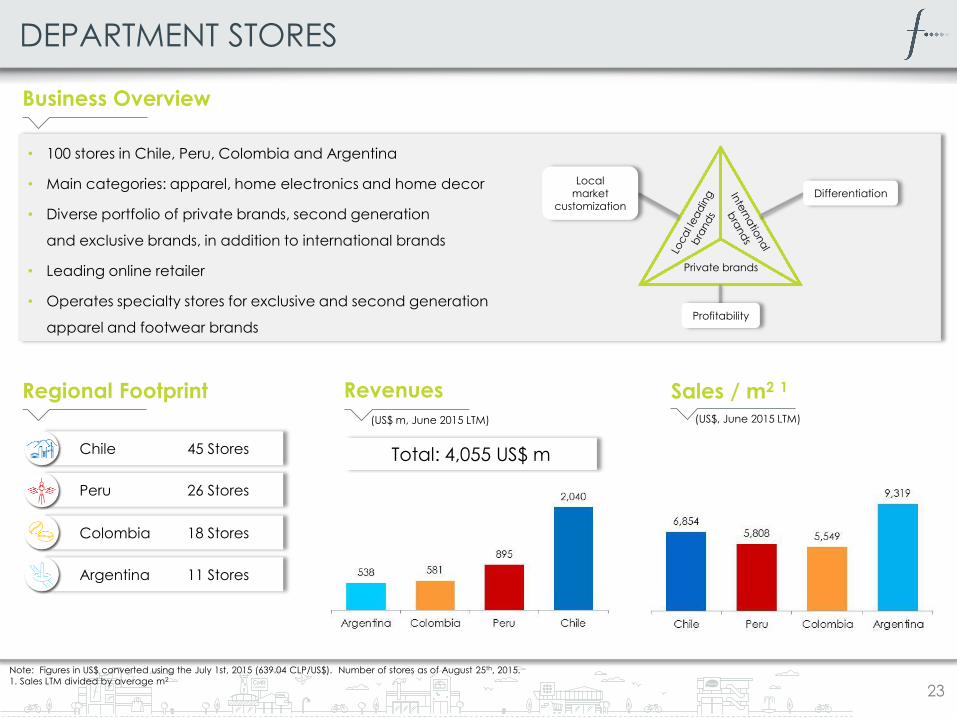
• 100 stores in Chile, Peru, Colombia and Argentina
• Main categories: apparel, home electronics and home decor
• Diverse portfolio of private brands, second generation
and exclusive brands, in addition to international brands
• Leading online retailer
• Operates specialty stores for exclusive and second generation
apparel and footwear brands
DEPARTMENT STORES
23
Peru 26 Stores
Colombia 18 Stores
Chile 45 Stores
Argentina 11 Stores
Note: Figures in US$ converted using the July 1st, 2015 (639.04 CLP/US$). Number of stores as of August 25th, 2015.
1. Sales LTM divided by average m2
Revenues Sales / m2 1
(US$, June 2015 LTM)(US$ m, June 2015 LTM)
Total: 4,055 US$ m
Private brands
Localmarket
customizationDifferentiation
Profitability
Business Overview
Regional Footprint

• 244 stores in Chile, Peru, Colombia, Argentina, Brazil and Uruguay
• Main categories: construction materials and home improvement
products , carpentry, design furniture and home terminations
• Six formats: Homecenter, Sodimac Constructor, Imperial,
Homy, Dicico and Maestro
• Expertise in selling directly to construction sector players and large companies
• Strong online sales strategy
Brazil 58 Stores
Uruguay 1 Stores
Peru 57 Stores
Colombia 35 Stores
Chile 85 Stores
Argentina 8 Stores
HOME IMPROVEMENT
24
Business Overview
Regional Footprint Revenues Sales / m2 1
(US$ m, June 2015 LTM) (US$, June 2015 LTM)
Total 2 : 5,713 US$ m
Note: Figures in US$ converted using the July 1st, 2015 exchange rate (639.04 CLP/US$). Number of stores as of June 2015.
1. Sales LTM divided by average m2
2, Does not include revenue from Uruguay.
DIY
Families
Contractors &specialists
Construction companies

• Started operations in 2002 in Peru under Tottus brand and entered
Chilean market in 2004 with the acquisition of San Francisco
• Operates 102 stores in Chile and Peru, with three formats:
hypermarkets , supermarkets and Hiperbodega Precio1
• Increased penetration of private labels
• E-commerce platform
Peru 49 Stores
Chile 53 Stores
SUPERMARKETS
25
Business Overview
Regional Footprint Revenues
(US$ m, June 2015 LTM)
Sales / m2 1
(US$, June 2015 LTM)
Total: 1,986 US$ m
Note: Figures in US$ converted using the July 1st, 2015 exchange rate (639.04 CLP/US$). Number of stores as of June 2015.
1. Sales LTM divided by average m2
Sales area considered for Tottus does not include the cash area in order to be comparable with peer’s sales area.
Price positioning
SupermarketsHypermarkets
Bodegas
Private labelproducts
Weekly deals

• Falabella Financiero offers a mix of integrated financial products and services.
• Provides customers access to credit, combining the traditional financial business with the proximity to customers through retail formats.
• Five business units: CMR Falabella (credit card), Banco Falabella (bank), Seguros Falabella (insurance broker), Viajes Falabella (travel agency) and Móvil Falabella (mobile virtual operator)
• Operates in Chile, Peru, Colombia and Argentina
Peru
Colombia
Chile
Argentina
FINANCIAL SERVICES
26
1. Per local regulation (not comparable across the countries)
Note: Figures in US$ converted using the July 1st, 2015 exchange rate (639.04 CLP/US$).
Business Overview
Regional Footprint Loan Loss Provision1
(%, June 2015)
2.3 m CMR accounts95 bank branches
1.0 m CMR accounts60 bank branches
0.8 m CMR accounts54 bank branches
0.5 m CMR accounts
Total: 6,038 US$ m
Gross Loan Portfolio
(US$ m, June 2015)
Integratedoffering
LoyaltyFrequency
Immediate needs
TransparencyConvenience
Simplicity
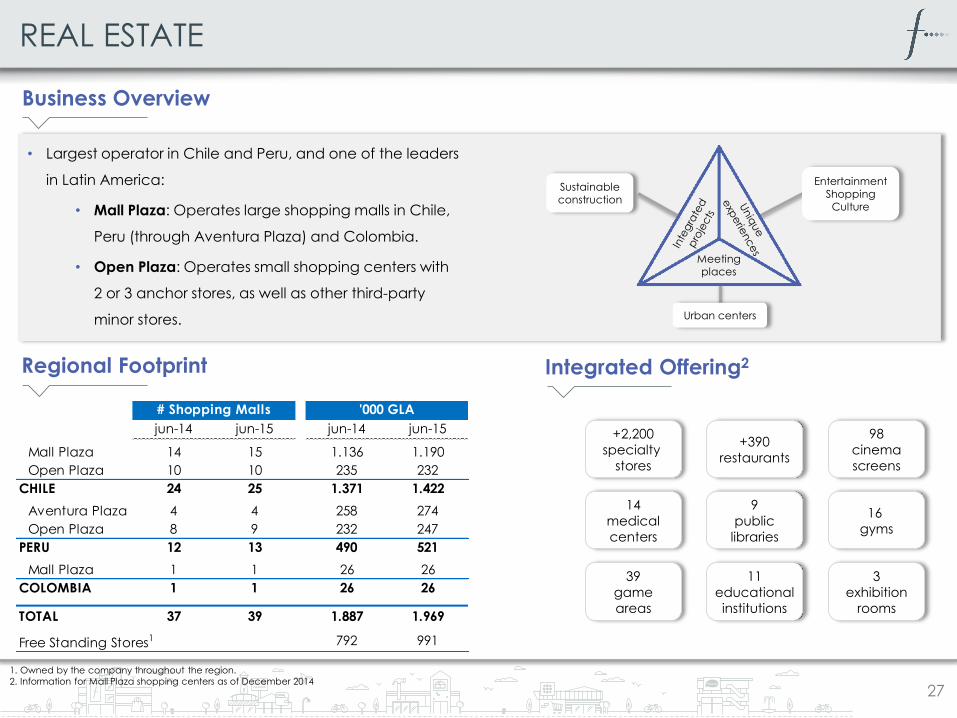
• Largest operator in Chile and Peru, and one of the leaders
in Latin America:
• Mall Plaza: Operates large shopping malls in Chile,
Peru (through Aventura Plaza) and Colombia.
• Open Plaza: Operates small shopping centers with
2 or 3 anchor stores, as well as other third-party
minor stores.
REAL ESTATE
27
1. Owned by the company throughout the region.
2. Information for Mall Plaza shopping centers as of December 2014
Business Overview
Regional Footprint
Meetingplaces
Urban centers
Sustainableconstruction
EntertainmentShoppingCulture
+2,200
specialty
stores
9
public
libraries
+390
restaurants
11
educational
institutions
39
game
areas
98
cinema
screens
16
gyms
3
exhibition
rooms
14
medical
centers
Integrated Offering2
jun-14 jun-15 jun-14 jun-15
Mall Plaza 14 15 1.136 1.190
Open Plaza 10 10 235 232
CHILE 24 25 1.371 1.422
Aventura Plaza 4 4 258 274
Open Plaza 8 9 232 247
PERU 12 13 490 521
Mall Plaza 1 1 26 26
COLOMBIA 1 1 26 26
TOTAL 37 39 1.887 1.969
Free Standing Stores1 792 991
# Shopping Malls '000 GLA

CONTACT INFORMATION
Jordi Gaju
Chief Development Officer
Alejandro González
Chief Financial Officer
Isabel Darrigrandi
Head of IR
María Paz Fernández
IR Analyst
www.falabella.com/inversionistas
Phone: +56 2 2380 2012

DISCLAIMER
This presentation contains forward-looking statements, including statements
regarding the intent, belief or current expectations of the Company and its
management. Investors are cautioned that any such forward-looking
statements are not guarantee of future performance and involve a number
of risks and uncertainties including, but not limited to, the risks detailed in the
Company’s financial statements, and the fact that actual results could differ
materially from those indicated by such forward-looking statements.
