presentación de powerpoint - uest.ntua.gruest.ntua.gr/adapt2clima/proceedings/presentation/sanchez...
TRANSCRIPT
With the support of:
LIFE AgriAdaptVulnerability assessment
in Southern European pilot farmsV. Sánchez, N. Metayer, J. Domingo, L. García, S, Doublet, C.
Wackerhagen
2nd International Conference ADAPTtoCLIMATE24-25 June 2019
Heraklion, Crete island, Greece

With the support of:
AgriAdapt partnership
With the support of:
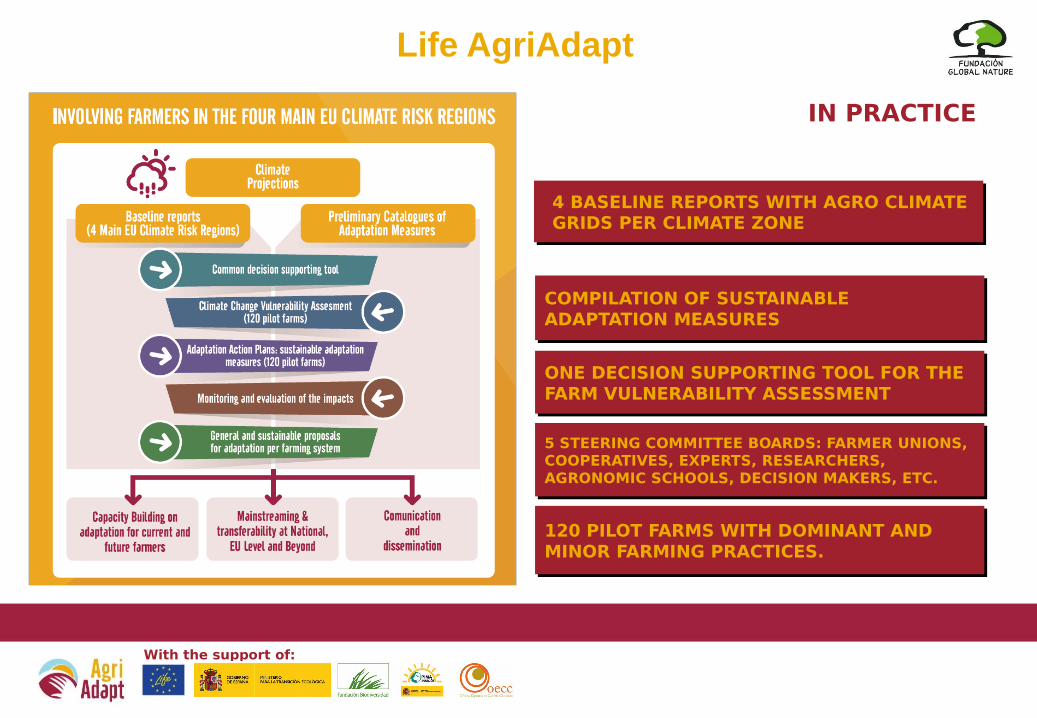
4 BASELINE REPORTS WITH AGRO CLIMATE GRIDS PER CLIMATE ZONE4 BASELINE REPORTS WITH AGRO CLIMATE GRIDS PER CLIMATE ZONE
COMPILATION OF SUSTAINABLE ADAPTATION MEASURESCOMPILATION OF SUSTAINABLE ADAPTATION MEASURES
120 PILOT FARMS WITH DOMINANT AND MINOR FARMING PRACTICES.120 PILOT FARMS WITH DOMINANT AND MINOR FARMING PRACTICES.
IN PRACTICE
ONE DECISION SUPPORTING TOOL FOR THE FARM VULNERABILITY ASSESSMENTONE DECISION SUPPORTING TOOL FOR THE FARM VULNERABILITY ASSESSMENT
5 STEERING COMMITTEE BOARDS: FARMER UNIONS, COOPERATIVES, EXPERTS, RESEARCHERS, AGRONOMIC SCHOOLS, DECISION MAKERS, ETC.
5 STEERING COMMITTEE BOARDS: FARMER UNIONS, COOPERATIVES, EXPERTS, RESEARCHERS, AGRONOMIC SCHOOLS, DECISION MAKERS, ETC.
Life AgriAdapt
With the support of:
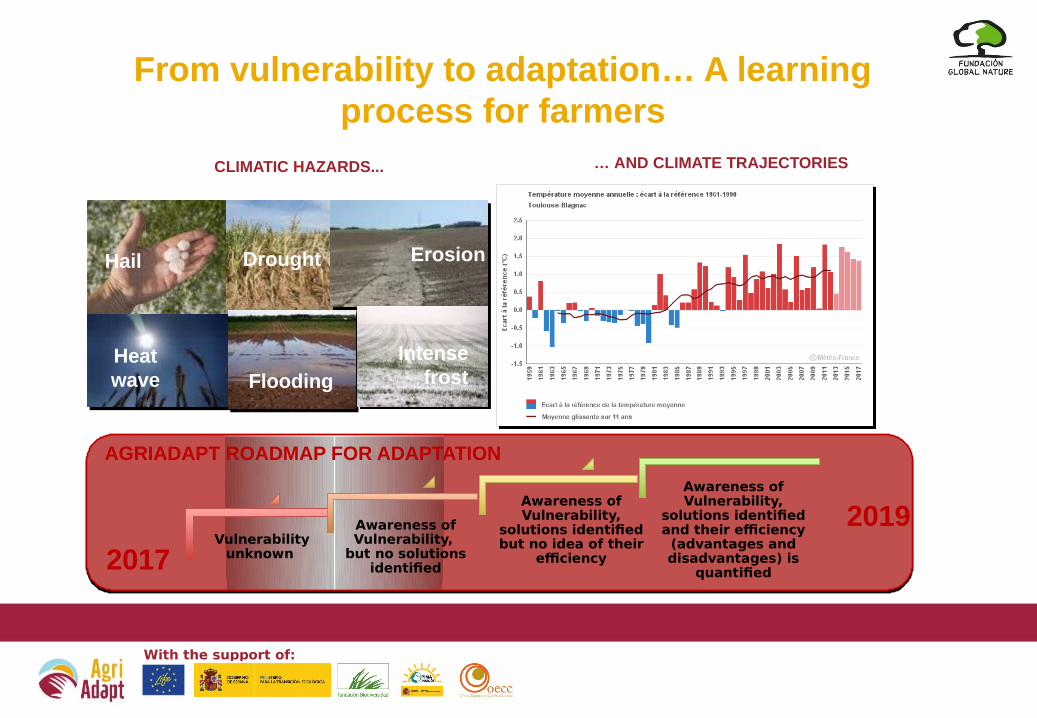
Vulnerability unknown
Awareness of Vulnerability,
but no solutions identified
Awareness of Vulnerability,
solutions identified but no idea of their
efficiency
Awareness of Vulnerability,
solutions identified and their efficiency (advantages and disadvantages) is
quantified
2019
2017
… AND CLIMATE TRAJECTORIES
Hail
Intense frost
ErosionDrought
FloodingHeat wave
AGRIADAPT ROADMAP FOR ADAPTATION
CLIMATIC HAZARDS...
From vulnerability to adaptation… A learning process for farmers

With the support of:
5
AGRIADAPT VULNERABILITY ASSESSMENT
ExposureExposure ImpactImpact
Vu
lnera
bili
ty
EXPOSURE Frequency of climate stress(i.e., key climatic parameters)
The vulnerability level (or risk level) combine the probability of occurrence of climate stress (exposure) and the extent of the consequences (crop impact).
IMPACT OR SENSITIVITY% of crop yield reduction experienced
VULNERABILITY = EXPOSURE X IMPACT

With the support of:
6
AGRIADAPT VULNERABILITY ASSESSMENT
6 6 12 18 24 30 3641-50% 5 5 10 15 20 25 3031- 40% 4 4 8 12 16 20 2421-30% 3 3 6 9 12 15 1811-20% 2 2 4 6 8 10 12
1 1 2 3 4 5 61 2 3 4 5 6
Insignificant<5% 6- 10% 11-15% 16-25% 26-30%
Major>30%
Veryfrequent(>50%)
Rare<10%
EXPO
SURE
SEVERITYOFCONSEQUENCES(Yieldimpact%)
AGRIADAPTVULNERABILITYMATRIX
The assessment help to prioritize the level of vulnerability.
No scientific unit to measure a risk. To assess the levels of Exposure and Sensitivity, qualitative evaluation trough rating scale is then required.
AGRIADAPT VULNERABILITY MATRIX
With the support of:
7
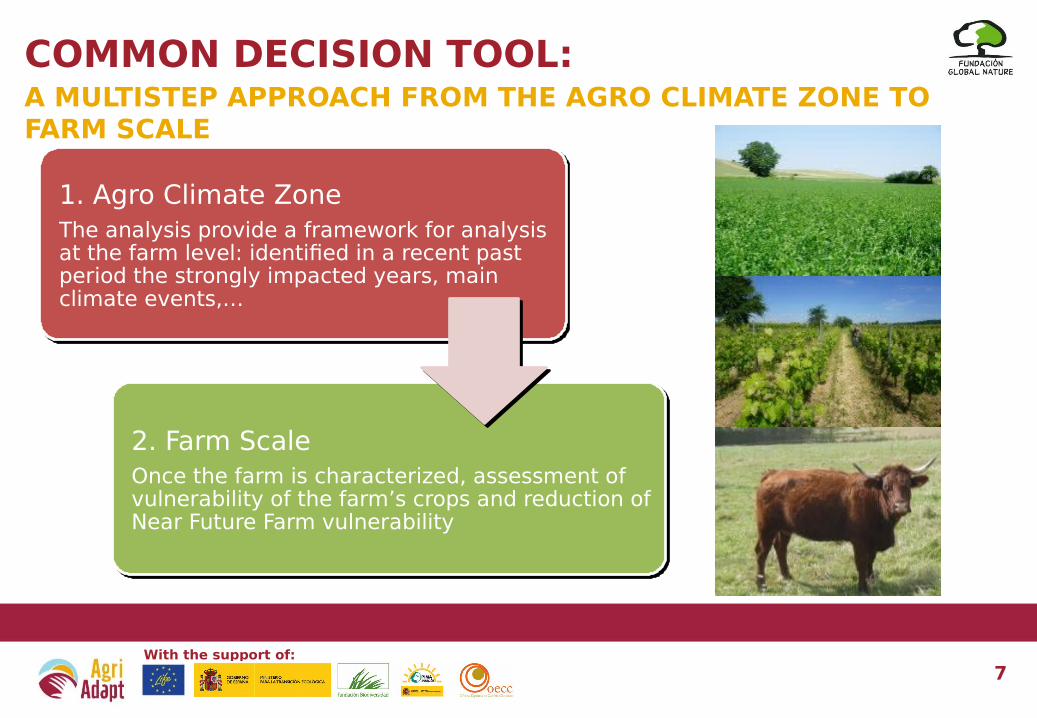
COMMON DECISION TOOL: A MULTISTEP APPROACH FROM THE AGRO CLIMATE ZONE TO FARM SCALE
1. Agro Climate ZoneThe analysis provide a framework for analysis at the farm level: identified in a recent past period the strongly impacted years, main climate events,…
1. Agro Climate ZoneThe analysis provide a framework for analysis at the farm level: identified in a recent past period the strongly impacted years, main climate events,…
2. Farm ScaleOnce the farm is characterized, assessment of vulnerability of the farm’s crops and reduction of Near Future Farm vulnerability
2. Farm ScaleOnce the farm is characterized, assessment of vulnerability of the farm’s crops and reduction of Near Future Farm vulnerability

With the support of:
8
COMMON DECISION TOOL: RELEVANT POINTS
Crop yields: Regional scale (statistics): annual yield of the last 15
yearsFarm scale (average,
minimum & maximum)
Crop yields: Regional scale (statistics): annual yield of the last 15
yearsFarm scale (average,
minimum & maximum)
Climatic data :Climate daily observations
(30 last years) for the Recent Past (RP)
Climate daily projection (30 years) for the Near
Future (NF)
Climatic data :Climate daily observations
(30 last years) for the Recent Past (RP)
Climate daily projection (30 years) for the Near
Future (NF)
Farm interview: Agronomic, livestock,
economic, climatic data
Farm interview: Agronomic, livestock,
economic, climatic data
Vulnerability scoring:Qualitative (agronomic
expertise & bibliography) and quantitative
information
Vulnerability scoring:Qualitative (agronomic
expertise & bibliography) and quantitative
information
COMMON DECISION
TOOL
COMMON DECISION
TOOL

With the support of:
9
ACZ TOOLAgri4Cast Resources PortalCovering all the EU Member states and free accessClimate observations available from 1975 to the last calendar year completed (25x25 km grid)Future daily weather data for Europe (25x25 km grid) for time horizon 2030, (SRES Scenario A1B, 3 GCM RCMs available). For pilot farms assessment, only one climate model (ETHZ-CLM-HadCM3Q0 model) was used in order to show the pilot farmers the impacts of climate change in a simplified way.
CLIMATE DATA
With the support of:
A g r i A d a p t - E C C A 2 0 1 7
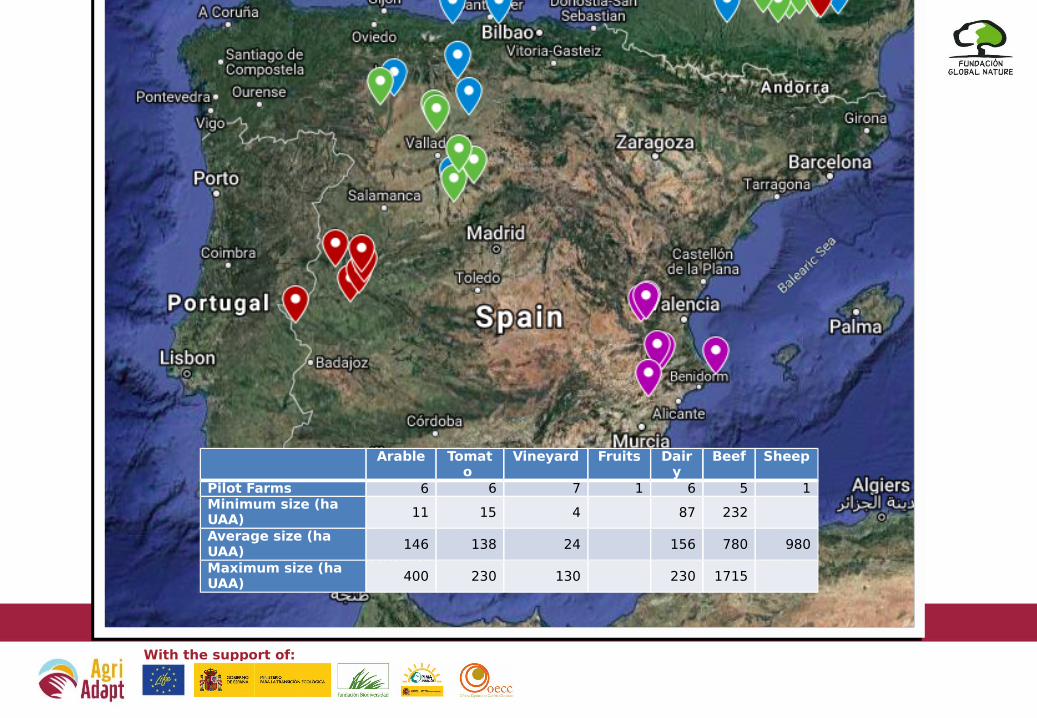
AgriAdapt pilot farms Southern Region. Spain
Arable Tomato
Vineyard Fruits Dairy
Beef Sheep
Pilot Farms 6 6 7 1 6 5 1Minimum size (ha UAA) 11 15 4
87 232
Average size (ha UAA) 146 138 24
156 780 980
Maximum size (ha UAA) 400 230 130
230 1715

With the support of:
Yield variability
Barley – Valladolid (Spain)
Solagro from Agri4Cast
SOFT WHEAT Yields 1990 - 20151990 2068,00
1991 1819,001992 175,001993 4011,001994 2993,251995 1428,001996 3044,671997 1808,871998 2750,001999 2778,002000 4183,362001 1716,462002 1611,272003 2766,082004 2913,752005 1258,502006 2119,252007 3609,922008 4139,002009 1618,072010 2870,002011 2954,002012 2023,002013 3848,002014 2240,002015 2470,00
0 5 10 15 20 25 30 350
20
40
60
80
100
120
140
160
180
Rainfall & hot days - Observed
Nb of days >30°C. 01/05 & 30/06
Ra
infa
ll 0
1/0
5 &
30/0
6

With the support of:
Yield variability
Barley – Valladolid (Spain)
Solagro from Agri4Cast
Yields 1990 - 2015
1990 2068,001991 1819,001992 175,001993 4011,001994 2993,251995 1428,001996 3044,671997 1808,871998 2750,001999 2778,002000 4183,362001 1716,462002 1611,272003 2766,082004 2913,752005 1258,502006 2119,252007 3609,922008 4139,002009 1618,072010 2870,002011 2954,002012 2023,002013 3848,002014 2240,002015 2470,00
0 5 10 15 20 25 30 350
20
40
60
80
100
120
140
160
180
Rainfall & hot days - Observed
Nb of days >30°C. 01/05 & 30/06
Ra
infa
ll 0
1/0
5 &
30/0
6

With the support of:
Agro Climate Indicators (ACIs)
Automatic calculation of 70 different ACIs- General (x13): rainfall, temperatures, etc.- Fodder (x11): date for grass regrowth, date for 1st
grazing , etc.- Cereal crops (x12): end of cycle thermal and hydric
stress, etc.- Summer crops (x9) : temperatures > 32°C, summer
hydric deficit, etc.- Vineyards (x13): date of late frost, Huglin index, etc- Rapeseed (x4), Field tomatoes (x5), Field peas (x1) - Irrigation (x2): winter reload, etc.- Livestock (x3): Temperature-Humidity Index, etc.
-300
-250
-200
-150
-100
-50
0
1987
1989
1991
1993
1995
1997
1999
2001
2003
2005
2007
2009
2011
2013
2015
2018
2020
2022
2024
2026
2028
2030
2032
2034
2036
2038
2040
2042
2044
2046
Rain
fall
-ETP
(mm
)
ACI -C3 -Hydric deficit (May to June)
-300
-250
-200
-150
-100
-50
0
1987
1989
1991
1993
1995
1997
1999
2001
2003
2005
2007
2009
2011
2013
2015
2018
2020
2022
2024
2026
2028
2030
2032
2034
2036
2038
2040
2042
2044
2046
Rain
fall
-ETP
(mm
)
ACI -C3 -Hydric deficit (May to June)
0
5
10
15
20
25
30
35
1987
1989
1991
1993
1995
1997
1999
2001
2003
2005
2007
2009
2011
2013
2015
2018
2020
2022
2024
2026
2028
2030
2032
2034
2036
2038
2040
2042
2044
2046
Num
berof
days
perye
ar
ACI-M1-HeatstressCorn(Tx>32°C01-06to30-09)
0
5
10
15
20
25
30
35
1987
1989
1991
1993
1995
1997
1999
2001
2003
2005
2007
2009
2011
2013
2015
2018
2020
2022
2024
2026
2028
2030
2032
2034
2036
2038
2040
2042
2044
2046
Num
berof
days
perye
ar
ACI-M1-HeatstressCorn(Tx>32°C01-06to30-09)

With the support of:
ACI : Cereal crops
0
10
20
30
40
50
60
70
RP NF RP NF RP NF RP NF RP NF
ESTREMADURA(Mérida)
ESTREMADURA(Plasencia)
VALENCIA(Requena)
CASTILE AND LEON(Medina del Campo)
CANTABRIA(Santander)
SPAIN*
ACI -C1 -Heat stress -Cereals(Tx > 30°C 15/04 to 15/07)
Quartile 1
MIN
Median
MAX
Quartile 3

With the support of:
ACI Livestock
0
20
40
60
80
100
120
RP NF RP NF RP NF RP NF RP NF
ESTREMADURA(Mérida)
ESTREMADURA(Plasencia)
VALENCIA(Requena)
CASTILE AND LEON(Medina del Campo)
CANTABRIA(Santander)
SPAIN*
ACI -A1 -THI Moderate severe stress
Quartile 1
MIN
Median
MAX
Quartile 3
With the support of:
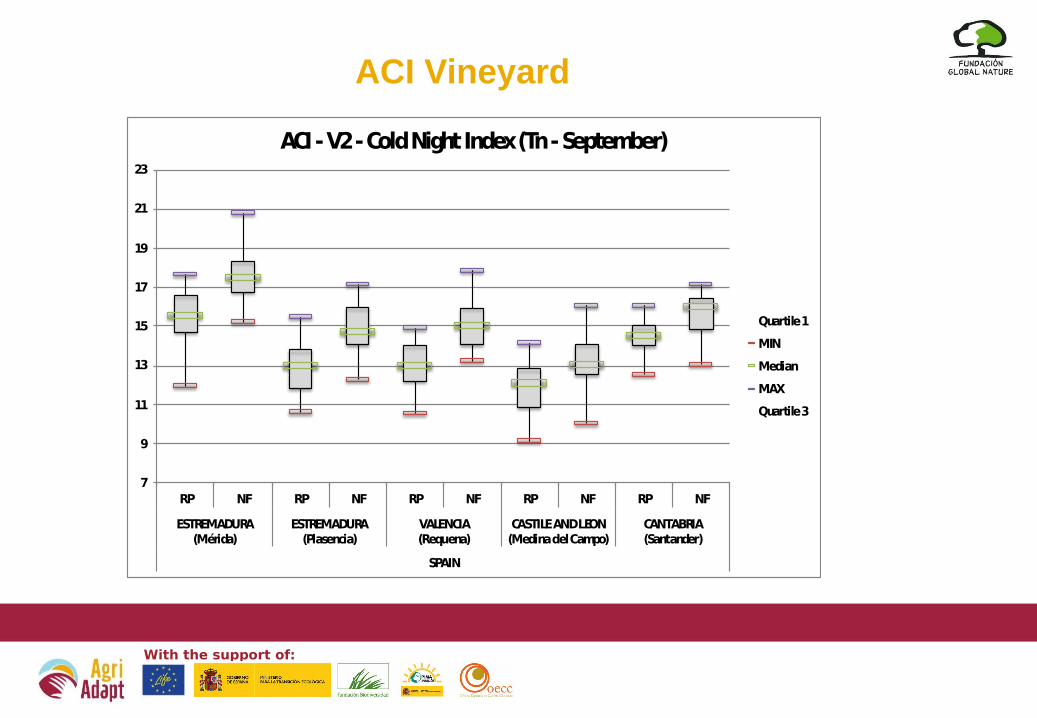
ACI Vineyard
7
9
11
13
15
17
19
21
23
RP NF RP NF RP NF RP NF RP NF
ESTREMADURA(Mérida)
ESTREMADURA(Plasencia)
VALENCIA(Requena)
CASTILE AND LEON(Medina del Campo)
CANTABRIA(Santander)
SPAIN
ACI -V2 -Cold Night Index (Tn -September)
Quartile 1
MIN
Median
MAX
Quartile 3

With the support of:
Climate projections
3%
-25%
7% 11% 5%
-4%-17%
-1%
100%
55%
100%
-29%
3%
100%
-100%
-80%
-60%
-40%
-20%
0%
20%
40%
60%
80%
100%
SPAIN (extremadure) - From Recent Past to Near Future
2% 2%
61%
9% 8% 6%
-1%-10% -5%
-87%
60%
37%
100%
19% 17% 17%
-100%
-80%
-60%
-40%
-20%
0%
20%
40%
60%
80%
100%
SPAIN (Castilla y Léon) - From Recent Past to Near Future

With the support of:
How to disseminate adaptation?
Climate services actorsModule 1
Farm vulnerability
quiz
Module 1
Farm vulnerability
quiz
Module 2
Yield & Climate
Module 2
Yield & Climate
Module 3
Sustainable adaptation measures
Module 3
Sustainable adaptation measures
AgriAdaptWebtool
for Adaptation
AgriAdaptWebtool
for Adaptation

With the support of:
STRENGTHS
• Adaptation options already in place
• Agricultural insurance• Varieties adapted to CC• High professionalized crops
(horts)• Diversified crops, extensive
agroforestry systems. Agroecology.
WEAKNESSES•Water: long-term availability? Deficit irrigation necessary•High dependence on Monoculture•Insufficient management of Grasslands
OPPORTUNITIES Higher productivity in temperature- limited areas if water is ensured
Increased pasture production in autumn/winter due to increased temperature• Possibility for new crops
through warmer winters
THREATS: limits for some crops• Heat waves in summer• Less rainfall in Winter-spring• Hydric déficit <-300 mm in
Spring• Increase in days with Tª
Max>30ºC in April and May and days >35-38ºC in summer
SOUTHERN CLIMATE ZONE SWOT

With the support of:
Farm vulnerability components
Cereal crops
SOIL & Farming practices (soil management, sowing date, density, …)
Market
Crop systemVarieties
Water dependency
Insurance
Policies
Cereal crops
SOIL & Farming practices (soil management, sowing date, density, …)
Market
Crop systemVarieties
Water dependency
Insurance
Policies
AnimalsAnimal Welfare
Market
Fodder system & concentrates
Water dependency
Herd management• Breeds• Renewal rate• Stocking rate• Ration• Birth strategy
Insurance
AnimalsAnimal Welfare
Market
Fodder system & concentrates
Water dependency
Herd management• Breeds• Renewal rate• Stocking rate• Ration• Birth strategy
Insurance
Vineyards /
Orchards
Soil management
Market
Management practices
• Density• Pruning• Nets• New plantationPlant and grape
varieties
Water dependency Processing
Insurance
Vineyards /
Orchards
Soil management
Market
Management practices
• Density• Pruning• Nets• New plantationPlant and grape
varieties
Water dependency Processing
Insurance

With the support of:
Sustainable adaptation: examples

With the support of:
RECOMMENDATIONS FOR ARABLE CROPS• Create a varietal bouquet
• Diversify crops and rotations to avoid main climate stress
• Improve soils: OM & structure, no bare soil
• Comfort or Deficit irrigation
• Hedgerow and flower strips plantations
With the support of:
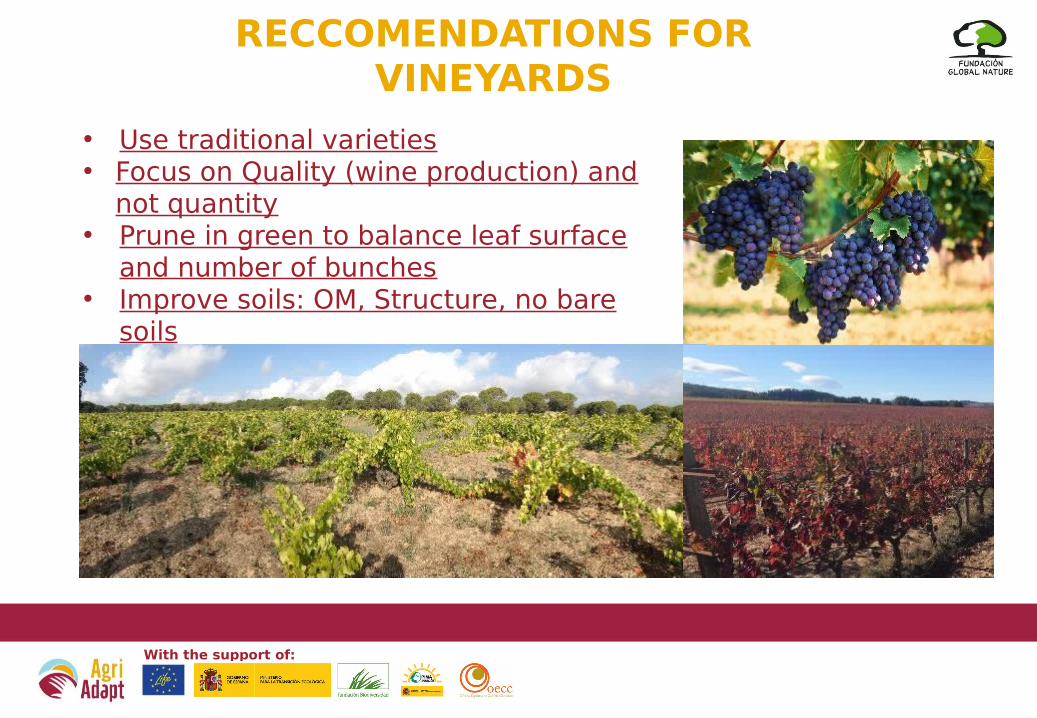
RECCOMENDATIONS FOR VINEYARDS
• Use traditional varieties • Focus on Quality (wine production) and
not quantity• Prune in green to balance leaf surface
and number of bunches• Improve soils: OM, Structure, no bare
soils

With the support of:
RECOMMENDATIONS FOR ANIMALS
• DAIRY:• Fodder autonomy and diversification. • Balance farmland surface and number of
animals. • Infrastructures designed to ensure passive
ventilation • Active ventilation systems. • Appropriate density of animals in buildings
• EXTENSIVE BEEF (DEHESAS)• Grazing management plans to increase
quantity and quality of pasture• Native seeds sowing for pasture improvement• Keyline design to maximize beneficial use of
water resources

With the support of:
AgriAdapt “Training Pack”
Downloadable from www.agriadapt.eu
“Self service” of digital resources about farming adaptation • Life AgriAdapt, Vulnerability context in EU and per
climate zone, methodology for farm level assessment, sustainable adaptation
• Cases studies: soft wheat, grasslands, rapeseed, maize, field peas, vineyards, livestock buildings
Video clips• Experts interviews• Pilot farms adaptation strategy
Baseline report
Baseline report
Case studies
Videoclips
PostersFINAL CONFERENCE IN MADRID NOVEMBER 2019. WORKSHOPS

With the support of:
A g r i A d a p t - E C C A 2 0 1 7
Some conclusions
• The agrarian practices
related to the soil are a key
for adaptation at all the
crops and all the regions.
Stop looking at the sky to look at the soil
• Adaptation is efficient at farm level, resilience depends not
only con climate expected projection but even on farming
practices, .

With the support of:
Thanks for your attention