presentación resultados 3q2016 - odinsa · 1 increase in construction revenues by ~ ∆+13.5k...
TRANSCRIPT

Financial
ResultsMarch 31st 2019

1. Odinsa Consolidated Results
2.Concessions Results
AGENDA

1. Odinsa
Consolidated
Results

1.1
Consolidated
Results

20.14525.195
46.118
2018 2019 Ppto
124.755141.802
155.683
2018 2019 Ppto
183.889199.240
229.964
2018 2019 Ppto
5Consolidated Results – March 2019
32%
COP 1.33
Relevant Numbers – Consolidated Income Statement
COP Millions
Revenues
EBITDA
Net Income
8%
14%
25%
1
2
3
Revenue increase mainly due to the excellent performance of
Highway Concessions, specially ADN and BTA.
All the segments make an important contribuition to revenues
comparing year to year.
EBITDA increase mainly due to the excellent performance of
Highway Concessions and higher revenues from subordinated
debt interests of Pacífico II.
Result from previous explanations.
Positive variation in Deferred Tax mainly due to AKF and
Odinsa SA plus negative contribuition in ADN and BTA
Negative variation in Income Tax mainly due to ADN.
3
2
1

1.6
Revenues, EBITDA
and Net Income
Contribuition
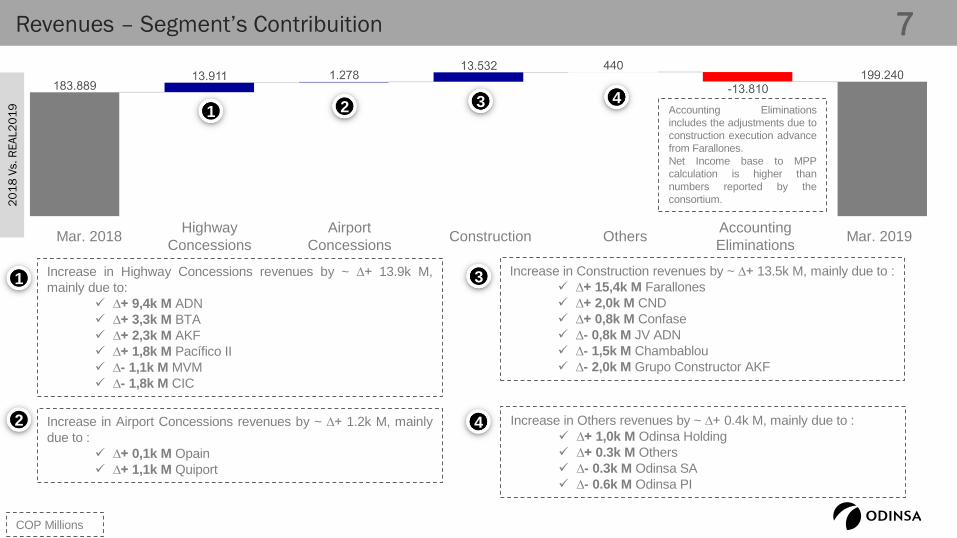
Revenues – Segment’s Contribuition2
01
8 V
s. R
EA
L2
01
9 1
Increase in Highway Concessions revenues by ~ ∆+ 13.9k M,
mainly due to:
✓ ∆+ 9,4k M ADN
✓ ∆+ 3,3k M BTA
✓ ∆+ 2,3k M AKF
✓ ∆+ 1,8k M Pacífico II
✓ ∆- 1,1k M MVM
✓ ∆- 1,8k M CIC
1Increase in Construction revenues by ~ ∆+ 13.5k M, mainly due to :
✓ ∆+ 15,4k M Farallones
✓ ∆+ 2,0k M CND
✓ ∆+ 0,8k M Confase
✓ ∆- 0,8k M JV ADN
✓ ∆- 1,5k M Chambablou
✓ ∆- 2,0k M Grupo Constructor AKF
3
2 Increase in Airport Concessions revenues by ~ ∆+ 1.2k M, mainly
due to :
✓ ∆+ 0,1k M Opain
✓ ∆+ 1,1k M Quiport
4 Increase in Others revenues by ~ ∆+ 0.4k M, mainly due to :
✓ ∆+ 1,0k M Odinsa Holding
✓ ∆+ 0.3k M Others
✓ ∆- 0.3k M Odinsa SA
✓ ∆- 0.6k M Odinsa PI
2 3 4
7
Mar. 2018Highway
Concessions
Airport
ConcessionsConstruction Others
Accounting
EliminationsMar. 2019
Accounting Eliminations
includes the adjustments due to
construction execution advance
from Farallones.
Net Income base to MPP
calculation is higher than
numbers reported by the
consortium.
COP Millions

EBITDA – Segment’s Contribuition
12 3
4
Increase in Highway Concessions EBITDA by ~ ∆+ 7.6k M, mainly
due to :
✓ ∆+ 10,9k M ADN
✓ ∆+ 3,7k M BTA
✓ ∆+ 1,8k M Pacífico II
✓ ∆- 1,5k M CIC
✓ ∆- 7,1k M AKF
1 Increase in Construction EBITDA by ~ ∆+ 18.6k M, mainly due to :
✓ ∆+ 15,4k M Farallones
✓ ∆+ 3,0k M Chambablou
✓ ∆+ 2,0k M CND
✓ ∆- 0,5k M JV ADN
✓ ∆- 0,5k M JV BTA
✓ ∆- 0,7k M Grupo Constructor AKF
3
2 Increase in Airport Concessions EBITDA by ~ ∆+ 0.9k M, mainly
due to :
✓ ∆+ 0,1k M Opain
✓ ∆+ 1,1k M Quiport
✓ ∆- 0,2k M Black-Red Coral
4
Increase in Others EBITDA by ~ ∆+ 9.5k M, mainly due to :
✓ ∆+ 8.4k M Odinsa SA
✓ ∆+ 0,6k M Marjoram
✓ ∆+ 0,5k M Odinsa Holding
✓ ∆+ 0.3k M Others
✓ ∆- 0,4k M Odinsa PI
20
18
Vs. R
EA
L2
01
9
8
Mar. 2018Highway
Concessions
Airport
ConcessionsConstruction Others
Accounting
EliminationsMar. 2019
COP Millions

Net Income – Segment’s Contribuition
1
2 3
4
Increase in Highway Concessions Net Income by ~ ∆+ 6.4k M, mainly
due to :
✓ ∆+ 2,0k M ADN
✓ ∆+ 1,8k M Pacífico II
✓ ∆+ 1,8k M AKF
✓ ∆+ 0,8k M BTA
✓ ∆- 0,1k M CIC
1 Increase in Construction Net Income by ~ ∆+ 18.8k M, mainly due to :
✓ ∆+ 15,4k M Farallones
✓ ∆+ 2,8k M Chambablou
✓ ∆+ 2,0k M CND
✓ ∆- 0,2k M Confase
✓ ∆- 0,4k M Grupo Constructor AKF
✓ ∆- 0,6k M JV ADN/BTA
3
2 4 Decrease in Others Net Income by ~ ∆- 1.5k M, mainly due to :
✓ ∆+ 2,6k M Odinsa SA
✓ ∆+ 0.3k M Others
✓ ∆- 0,2k M Odinsa PI
✓ ∆- 1,5k M Odinsa Holding
✓ ∆- 2,7k M Marjoram
20
18
Vs. R
EA
L2
01
9
Increase in Airport Concessions Net Income by ~ ∆+ 0.9k M, mainly
due to :
✓ ∆+ 0,1k M Opain
✓ ∆+ 1,1k M Quiport
✓ ∆- 0,2k M Black-Red Coral
9
Mar. 2018Highway
Concessions
Airport
ConcessionsConstruction Others
Accounting
EliminationsMar. 2019
COP Millions

2.Concessions
Results

2.1
Airport
Concessions

5,30 5,19
2,68 2,87
2018 2019
0,65 0,66
0,57 0,59
2018 2019
12Airport Concession’s Traffic
* Domestic Passengers
* International Passengers
OPAIN Quiport
Millon passengers – Accumulated data, March
2%
7%
1%
2%
8.077.97
1.251.22
2%
2%
2018 includes seasonal effect due to Holidays (Easter); this fact will impact 2019 from April onwards.

4.8755.158
4.116
2018 2019 Ppto
13OPAIN
REVENUES
COP millons
EBITDA
COP millons
NET INCOME
COP millons
Revenues increase +18% mainly due to:
• Higher regulated revenues by ~ ∆+ COP
14.7k M.
• Higher non regulated revenues by ~ ∆+ COP
7.4k M.
• Revenues returned registered in 2018 by ~
∆- COP 12k M.
• Construction revenues increase by ~ ∆+
COP 5.1k M.
EBITDA increase +14%, mainly due to:
• ∆+ COP 39.4k M total revenues
• Higher costs and expenses by ~ ∆+ COP
30.8k M mainly due to:
✓ Construction ~ ∆+ COP 21.5k M.
✓ Fees ~ ∆+ COP 2.8k M.
✓ Maintenance ~ ∆+ COP 4.5k M.
• Other revenues increase mainly due to
recoveries ~ ∆+ COP 1.8k M.
Net Income increase +6%, mainly due to:
• ∆+ COP 10.3k M EBITDA
• Higher D&A ~ ∆+ COP 7.5k M.
• Interest expenses increase by ~ ∆+ COP 3.0k M
• Lower foreign Exchange balance variation, net ~ ∆-
COP 1.7k M
• Deferred Tax increase by ~ ∆+ COP 1.3k M
223.654
263.135 262.412
2018 2019 Ppto
72.133
82.454 79.016
2018 2019 Ppto
18% 14% 6%

14Quiport
REVENUES
USD millons
EBITDA
USD millones
NET INCOME
USD millons
Variation in total revenues ∆+ 4%, mainly
due to:
• Higher regulated revenues ~ ∆+ USD 1.0
M
• Higher non regulated revenues ~ ∆+
USD 0.5 M
+7% Increase in EBITDA, mainly due to:
• ∆+ USD 1.5 M, total revenues
• Lower direct expenses ~ ∆- USD 0.6 M, mainly
due to:
✓ ∆- USD 0.2 M, personnel.
✓ ∆- USD 0.3 M, profesional services
✓ ∆- USD 0.1 M, marketing and sales
• Increase in indirect expenses by ~ ∆+ USD 0.2 M,
(legal 0.1 and O&M 0.1)
+16% increase in Net Income, mainly due to:
• Increase in EBITDA ~ ∆+ USD 1.8 M
• Higher D&A ~ ∆+ USD 0.2 M
• Higher interest expense ~ ∆+ USD 1.1 M
mainly due to Senior Debt.
• Decrease by ~ ∆- USD 1.6 M legal reserves
40,7 42,2 44,0
2018 2019 Ppto
27,229,0 29,6
2018 2019 Ppto
13,8
16,0
18,3
2018 2019 Ppto
4%7% 16%

2.2
Highway
Concessions

3,00 3,09
2018 2019
1,061,20
2018 2019
0,42 0,45
2018 2019
1,66 1,73
2018 2019
Highway Concessions’ Traffic
AKF ADN BTA
MVM La Pintada
Million vehicles – Accumulated data, March
16
3% 13% 7%
5% 0,63 0,64
2018 2019
2%
2018 includes seasonal effect due to Holidays (Easter); this fact will impact 2019 from April onwards.
44.02546.366 45.738
2018 2019 Ppto
26.293
19.107
14.174
2018 2019 Ppto
11.401
14.531
11.127
2018 2019 Ppto
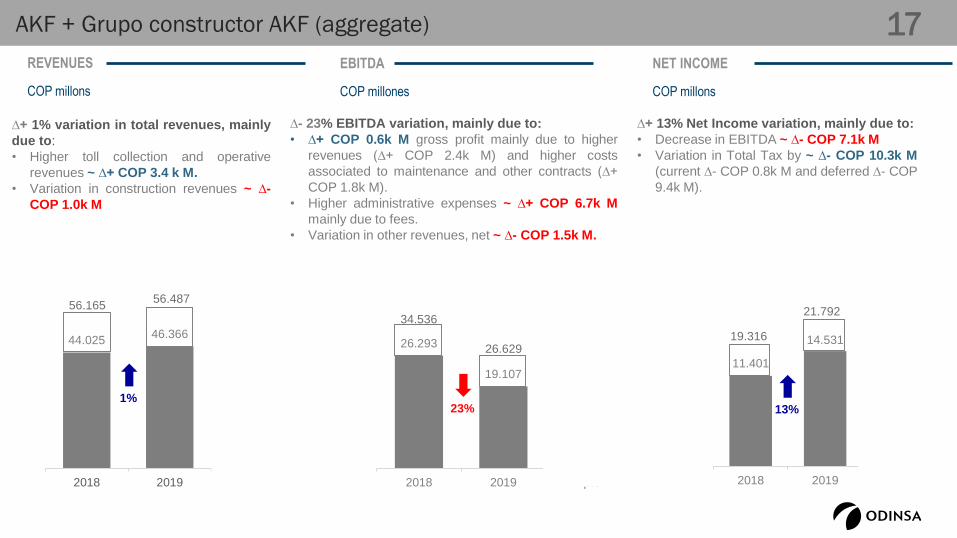
AKF + Grupo constructor AKF (aggregate)
REVENUES
COP millons
EBITDA
COP millones
NET INCOME
COP millons
∆+ 13% Net Income variation, mainly due to:
• Decrease in EBITDA ~ ∆- COP 7.1k M
• Variation in Total Tax by ~ ∆- COP 10.3k M
(current ∆- COP 0.8k M and deferred ∆- COP
9.4k M).
∆+ 1% variation in total revenues, mainly
due to:
• Higher toll collection and operative
revenues ~ ∆+ COP 3.4 k M.
• Variation in construction revenues ~ ∆-
COP 1.0k M
∆- 23% EBITDA variation, mainly due to:
• ∆+ COP 0.6k M gross profit mainly due to higher
revenues (∆+ COP 2.4k M) and higher costs
associated to maintenance and other contracts (∆+
COP 1.8k M).
• Higher administrative expenses ~ ∆+ COP 6.7k M
mainly due to fees.
• Variation in other revenues, net ~ ∆- COP 1.5k M.
17
1%23% 13%
56.16556.487 60.148
34.536
26.629
23.095
19.316
21.792
19.766

18ADN
REVENUES
USD millons
EBITDA
USD millons
NET INCOME
USD millons
Increase in revenues +15%, mainly due to:
• Higher toll collection ~ ∆+ USD 1.7 M.
• Higher financial revenues ~ ∆+ USD 0.2 M.
Increase in EBITDA +25%, mainly due to:
• Increase in revenues ~ ∆+ USD 1.9 M
• Higher operating costs ~ ∆+ USD 0.6k M
• Higher administration expenses ~ ∆+ USD 0.2
M, mainly due to insurances.
• Higher other revenues ~ ∆+ USD 1.5 M
Increase in Net Income +15%, mainly due to:
• Increase in EBITDA ~ ∆+ USD 2.6k M
• Lower interest expenses ~ ∆- USD 0.3 M.
• Taxes registered in 2019 ~ ∆+ COP 2.1k M.
12,6
14,5 14,3
2018 2019 Ppto
10,1
12,711,8
2018 2019 Ppto
4,2
4,8
3,8
2018 2019 Ppto
15% 25%15%

19BTA
REVENUES
USD millons
EBITDA
USD millons
NET INCOME
USD millons
Variation ∆+ 0.1% in total revenues, mainly
due to:
• Higher toll collection ~ ∆+ USD 0.4 M
• Lower financial revenues ~ ∆- USD 0.3k M
Variation ∆+ 5% in EBITDA, mainly due to:
• ∆+ USD 0.4 M administration expenses by
insurances and operating costs.
• Variation in other revenues ~ ∆+ USD 0.8 M
Increase +4% in Net Income, mainly due to:
• Increase in EBITDA ~ ∆+ USD 0.5 M
• Lower interest expenses, net ~ ∆- USD 0.2 M.
• Variation in Tax (deferred) ~ ∆ USD 0.5 M.
11,2 11,3 11,4
2018 2019 Ppto
8,6 9,1 8,8
2018 2019 Ppto
3,4
3,5
3,6
2018 2019 Ppto
0.1% 5% 4%

20Pacífico II
REVENUES
COP millons
EBITDA
COP millons
NET INCOME
COP millons
Variation in Revenues ∆- 8%, mainly due to:
• Lower Construction revenues ~ ∆+ COP
11.9k M
Increase in EBITDA ~ ∆+ 25.2k M, mainly
due to:
• Increase in gross profit ~ ∆+ COP 24.8k M
due to revenues ~ ∆- COP 11.9k M and
costs ∆- COP 37k M
• Higher other revenues, net ~ ∆+ COP 0.3k M
Increase in Net Income ~ ∆+ COP 2.3k M, mainly due
to:
• Increase in EBITDA ~ ∆+ COP 25.3k M
• Variation in interest expenses ~ ∆+ COP 10.1k M
• Variation in financial revenues ~ ∆- COP 3.9k M
• Variation in foreign Exchange balance ~ ∆- COP 3.8k
M
• Tax variation ~ ∆+ COP 4.9k M. Deferred tax due to
hedge accounting.
128% 26% 415% 99%
336% 193%141.924
129.947
194.736
2018 2019 Ppto
12.657
37.800
67.960
2018 2019 Ppto
9.36511.617
36.776
2018 2019 Ppto
8% 199% 24%

10.6439.498
14.363
2018 2019 Ppto
-333 -404
-3.142
-443-723
-3.309
21Malla vial del Meta
REVENUES
COP millons
EBITDA
COP millons
NET INCOME
COP millons
Decrease in EBITDA 21%, mainly due to:
• Lower revenues ~ ∆- COP 1.1k M.
• Lower Construction costs ~ ∆- COP 1.5k M.
Decrease in total revenues 11%, mainly due to:
• Lower construction revenues ~ ∆- COP 1.5k M.
• Higher toll collection ~ ∆- COP 0.4k M.
Decrease in Net Income 63%, mainly due to:
• Decrease in EBITDA ~ ∆- COP 0.1k M
• Variation in Tax ~ ∆+ COP 0.2k M
21% 63%
11%

22Green Corridor
REVENUES
USD millons
EBITDA
USD millones
NET INCOME
USD millons
Variation ~ ∆- USD 0.1 M in Net Income,
mainly due to:
• Decrease in EBITDA ~ ∆- USD 0.6 M
• Lower interest expenses ~ ∆- COP 0.1k M
• Lower Tax ~ ∆- COP 0.4k M
Variation ∆- 30% in total revenues, mainly
due to:
• Lower construction revenues ~ ∆- USD 1.3 M
• Higher financial revenues ~ ∆+ USD 0.5 M.
Variation ~ ∆- USD 0.6 M in EBITDA, mainly
due to:
• Lower gross profit ~ ∆- USD 0.1 M due to
revenues ~ ∆- USD 0.8 M and costs ∆- USD
0.7 M
• Higher administration expenses ~ ∆+ USD
0.3 M fees.
• Lower other revenues ~ ∆- USD 0.2 M
2,7
1,91,8
2018 2019 Ppto
1,8
1,2 1,2
2018 2019 Ppto
0,7
0,6
0,2
2018 2019 Ppto
30% 35%15%