presentación de powerpoint - isa€¦ · transversal del sisga – usd 482 ... management of...
TRANSCRIPT

Investor Presentation
9th Annual Andean Conference 2015
Santiago de Chile. March 17-19, 2015

Disclaimer
Certain statements contained in this report constitute "forward-looking statements" within the meaning of
the Private Securities Litigation Reform Act of 1995.
These forward-looking statements reflect our current views with respect to future events and are based
on assumptions and subject to risks and uncertainties. Also, these forward-looking statements present
our estimates and assumptions only as of the date of this report. Except for our ongoing obligation to
disclose material information as required by federal securities laws, we do not intend to update you
concerning any future revisions to any forward-looking statements to reflect events or circumstances
occurring after the date of this report.
Amounts expressed in US dollars are for information purposes only, and do not reflect
accounting conversion techniques usually applied.
2

AGENDA
3

Corporate Strategy ISA 2020
4
Aspirations and General Definitions
Ratification of countries and businesses
Higher Profitability
Growth based on profitability
ISA Vocation: Generate value from the operation
and excellency in infrastructure development Vision 2020
By 2020, ISA will have tripled its profits, by capturing the most
profitable growth opportunities in its businesses existing in Latin
America, the boost of operational efficiency and the optimization of its
business portfolio.
For the long-term cycle, 2014 was
established as a key year to seize early
victories

Significant advancement of Strategic Plan: two years from its implementation
reached 2,2x
Growth with higher
profitability Current business
profitability Management of
business portfolio
~60% Success Rate
~470 USD million
Investment
3
12
17
32
Brazil 1, Chile 1, Colombia 11, Peru 4
MANAGED
BIDS
18
30
52
100
Probable¹ Identified² Required Total
Business 65%, Support 35%
OPEX SAVINGS
BY 2020
1 Eventual savings: Achieved in Opex and with contract in CAPEX 2 Identified savings: With strategic project under execution
Methodology developed and applied
to investment portfolio.
Internexa scale increase in operations.
159 USD million
Savings (with agreements) in
CAPEX
1 2 3
5
Corporate Strategy ISA 2020

AGENDA
6

Proposition 2015
Ordinary $ 208
Extraordinary $ 60
Total $ 268
Shareholders Structure and Dividend Policy
The Colombian State is the controller
…31.44% is the free float
160 172 179 188 214
0
50
100
150
200
250
2010 2011 2012 2013 2014
Dividend
December, 2014 SHARES %
STATE INVESTORS 682.078.108 61,58%
THE COLOMBIAN STATE 569.472.561 51,41%
EMPRESAS PÚBLICAS DE MEDELLÍN 112.605.547 10,17%
COMPANIES WITH PUBLIC AND PRIVATE CAPITAL 77.373.530 6,99%
ECOPETROL 58.925.480 5,32%
EMPRESA DE ENERGÍA DE BOGOTA 18.448.050 1,67%
PRIVATE INVESTORS 348.226.256 31,44%
INSTITUTIONAL INVESTORS 202.887.650 18,32%
INDIVIDUALS 66.712.392 6,02%
LEGAL PERSONS 16.645.184 1,50%
FOREIGN INVESTORS 60.971.105 5,50%
ISA ADR PROGRAM 1.009.925 0,09%
SUBSCRIBED AND PAID CAPITAL INTO
CIRCULATION 1.107.677.894 100,00%
7

ISA’s Board of Directors
Principal members Alternative members
Ministry of Mines and Energy: Minister Ministry of Mines and Energy: Vice-Minister
Ministry of Finance and Public Credit: Ministry of Finance and Public Credit:
General Vice-Minister Director General of Public Credit and National
Treasury
Carlos Mario Giraldo Moreno* Henry Medina González*
EPM: General Manager Jesús Aristizábal Guevara*
Santiago Montenegro Trujillo* Camilo Zea Gómez*
Alejandro Linares Cantillo
Bernardo Vargas Gibsone* Carlos Felipe Londoño Álvarez*
*Independent members
President: Mr. Santiago Montenegro Trujillo
Secretary: Sonia Margarita Abuchar Alemán, ISA's Secretary General.
8
AGENDA
9

ISA in Latin America is focused on four
businesses…
ISA, directly and through its 33 affiliates and subsidiaries, is currently implementing
important infrastructure projects that boost the continent's progress and contribute to
the development of the inhabitants of Colombia, Brazil, Peru, Chile, Bolivia, Ecuador,
Argentina, Panama, and Central America.
10
2010 2011 2012 2013 2014
Energy Transportation 90% 80% 80% 68% 70%
Toll road concessions 5% 16% 17% 26% 21%
Telecommunications Transport 3% 2% 3% 4% 6%
Smart Management of Real
Time Systems 2% 2% 2% 2% 3%

Energy Transportation
• 19 companies in Colombia, Peru, Central America, Bolivia,
Brazil and Chile.
• 41.650 km circuits of transmission lines in operation (40,630
km in 2013), 8.071 km circuits under development (includes
Chile’s projects).
• Transformation capacity: 77.710 MVA (75.960 MVA in 2013).
• Majority participation in Colombia and Peru, greater
transmission operator in the state of Sao Paulo in Brazil, and
an important participation in Bolivia.
• Network availability in 2014: ISA 99,86%, TRANSELCA
99,91%, REP 99,60%, Transmantaro 99,52%, ISA Peru
99,90%, ISA Bolivia 99,64% and CTEEP 99,95%.
Strategy
OPEX and CAPEX efficiencies
Evaluate investment opportunities and invest in
those that are relevant for ISA.
MAP: March 2014
11

Energy Transportation
12
New Projects 2014 Estimated investment: USD 1.100 million
Colombia, UPME projects: Caracolí substation. Caracolí – Las Flores (22 km) and Caracolí – Sabana (31 km) lines. (1 USD 7,54)
Montería substation, Chinú substation expansion. Montería - Chinú (71 km) and Montería - Urabá (124 km) lines. (1 USD 9,00)
Reforma to Guavio – Tunal circuit conection. (1 USD 0,50)
Peru, Proinversión projects: Planicie – Industriales (11,7 km) line and associated substations. (1 USD 5,50)
Friaspata – Mollepata (90 km) line and associated substations. Orcotuna substation and Huayucachi - Carabayllo connection.
(1 USD 5,70)
ISA Perú expansion 3
Chile: Installation of autotransformers banks at Cardones, Maitland and Sugarloaf substations and second circuit at Encounter –
Lagunas line. (1 USD 2,60)
1.3
30
1.4
64
1.4
01
1.0
23
1.1
43
98
7
1.0
73
1.0
01
53
6
65
3
86
0
59
5
45
0
44
7
42
6
7.082 7.441 7.229 6.671
7.531
0
1.000
2.000
3.000
4.000
5.000
6.000
7.000
8.000
0
500
1.000
1.500
2.000
2010 2011 2012 2013 2014
revenues EBITDA investments assets
Business evolution
74,2% 73,3% 71,4% 52,4% 57,1%
2010 2011 2012 2013 2014
EBITDA Margin
1 Estimated revenues in million
USD million. Exchange rate: COP 2.392,46
Energy Transportation
13
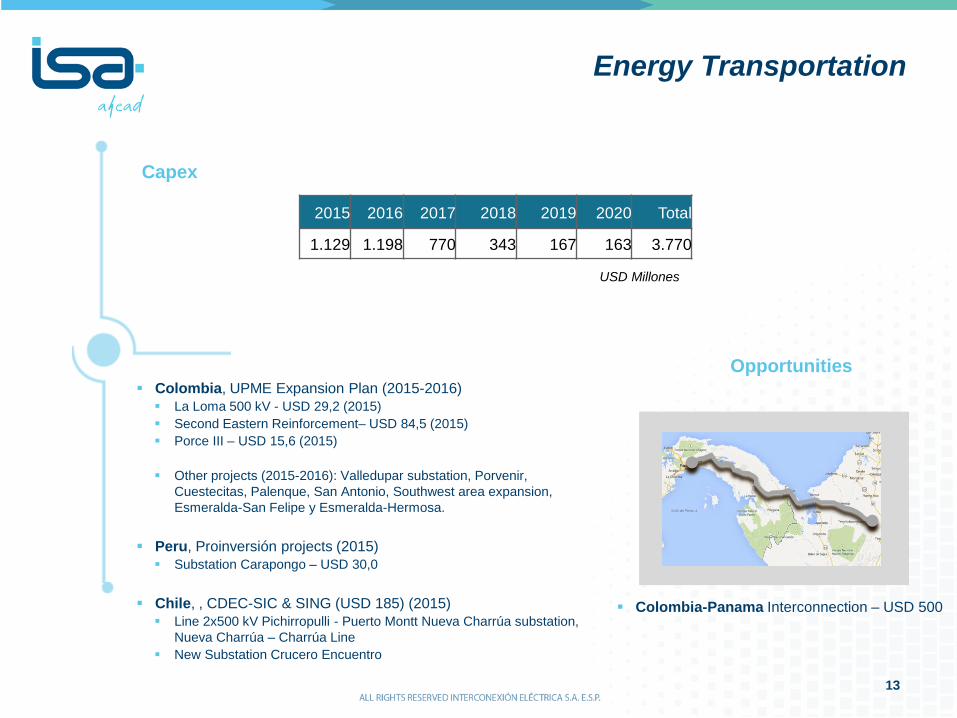
Colombia, UPME Expansion Plan (2015-2016)
La Loma 500 kV - USD 29,2 (2015)
Second Eastern Reinforcement– USD 84,5 (2015)
Porce III – USD 15,6 (2015)
Other projects (2015-2016): Valledupar substation, Porvenir,
Cuestecitas, Palenque, San Antonio, Southwest area expansion,
Esmeralda-San Felipe y Esmeralda-Hermosa.
Peru, Proinversión projects (2015)
Substation Carapongo – USD 30,0
Chile, , CDEC-SIC & SING (USD 185) (2015)
Line 2x500 kV Pichirropulli - Puerto Montt Nueva Charrúa substation,
Nueva Charrúa – Charrúa Line
New Substation Crucero Encuentro
Opportunities
Capex
2015 2016 2017 2018 2019 2020 Total
1.129 1.198 770 343 167 163 3.770
USD Millones
Colombia-Panama Interconnection – USD 500

Toll road concessions
• Largest toll road concession operator in Chile.
• 907 km of toll road infrastructure in operation.
• Used by over 100 million vehicles in 2014. (99 million in
2013)
• 95 toll plazas.
• 293 bridges, 368 structures (overpasses, connections,
among others), 188 pedestrian walkways.
• Design speed is 120 km/hour.
• Award for road safety in all concessions during 2014, which
implies higher revenues.
Enter the toll road concession operation in
Colombia.
Develop service and security works in existing
roads.
Strategy
14
MAP: March 2014

Opportunities
Capex
USD Millones
Toll road concessions
Colombia, ANI Projects – 4G bids. Concessions
where ISA is prequalified (figures in million) (2015-
2016)
Girardot Neiva 191 km - USD 648
Cruz del Viso-Carreto-Palmar de Varela
204 km– USD 644
Popayán-Santander de Quilichao 76 km -
USD 884
Other concessions: (2015-2016)
Villavicencio-Yopal – USD 1.525
Rumichaca-Pasto – USD 1.104
Transversal del Sisga – USD 482
Chile, third runways in Maipo, pedestrian
connections in Maule and Bosque (USD 200
million) and Third runaways in Maipo (USD 200
million) (2015).
15
2015 2016 2017 2018 2019 2020 Total
44 22 66
Business evolution
69
29
1
31
3
38
4
35
2
51
17
3
19
6
29
1
25
9
25
17
6
13
18
22
3.477 3.440 3.295 3.634
4.150
0
500
1.000
1.500
2.000
2.500
3.000
3.500
4.000
4.500
5.000
0
100
200
300
400
500
2010 2011 2012 2013 2014
revenues EBITDA investments assets
73,9% 59,4% 62,8%
75,9% 73,5%
2010 2011 2012 2013 2014
EBITDA Margin
USD million. Exchange rate: COP 2.392,46. 2010: 3 months

Telecommunication Infrastructure
• 26,717 km in operation, the largest open information
transportation network in South America. (2013:
25.465 km)
• Presence in Colombia, Ecuador, Peru, Chile,
Argentina and Brazil and connections with
Venezuela and Bolivia.
• 460 operators serviced, in local as well as national,
regional and international needs.
• 2.5 Tbps in capacity in the region, served from local
nodes and international connections via agreements
with the most important agents in the industry.
• 2014 average service availability 97,53% in the
region.
Strategy
Consolidate operations in Chile, Argentina and Brazil
and keep the position reached in Colombia, Ecuador y
Peru. MAP: March 2014
16

Capex
2015 2016 2017 2018 2019 2020 Total
64 38 13 20 18 15 169
Telecommunication Infrastructure
Deepen into the leadership achieved in the
distribution of Internet traffic in the region.
Increase regional traffic and fidelity of operators
on INTERNEXA's network.
USD Millones
Opportunities
Business evolution
37
41
48
62
97
14
15
11
11
31
20
23
25
36
43
125 156 155
274 307
0
50
100
150
200
250
300
350
0
20
40
60
80
100
120
2010 2011 2012 2013 2014
revenues EBITDA investments assets
12.029
19.912 22.730 25.465 26.717
0
10.000
20.000
30.000
2010 2011 2012 2013 2014
37,5% 37,8%
22,8% 17,6% 31,5%
2010 2011 2012 2013 2014
EBITDA Margin
Fiber optic km
USD million. Exchange rate: COP 2.392,46
17

Intelligent Management of Real-time Systems
REAL TIME SYSTEMS
Planning, coordination and supervision of the SIN operation in
Colombia. 24.912 km in lines, 38.646 MVA of transformation, 15.489
MW in installed capacity.
Planning and operation of the mobility control center of affiliates in
Medellin, Colombia.
Support and maintenance service in control centers in Colombia and
Peru.
Projects under construction: Control Center for toll road information
Antioquia, Colombian.
MARKET MANAGEMENT
Management of comercial exchange programs of the wholesale energy market (Colombia). Payment,
management of accounts and billing 49.5% of property in DERIVEX – negotiations system and registering of
operations of financial energy products in Colombia.
7.18% of property in CRCC – Central risk agency of the counterparty – compensation service as central
operations counterparty
Strategy
Expand services to other sectors and strengthen synergistic services within Grupo ISA.
18
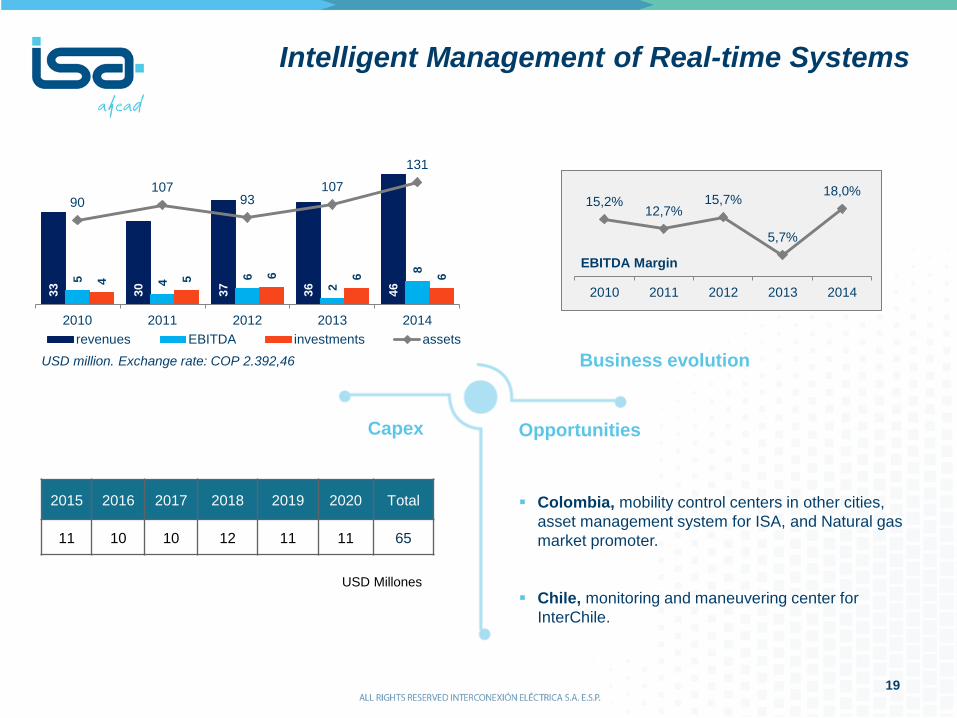
Opportunities Capex
2015 2016 2017 2018 2019 2020 Total
11 10 10 12 11 11 65
Intelligent Management of Real-time Systems
Colombia, mobility control centers in other cities,
asset management system for ISA, and Natural gas
market promoter.
Chile, monitoring and maneuvering center for
InterChile.
USD Millones
Business evolution
33
30
37
36
46
5
4 6
2
8
4 5 6
6
6
90 107
93 107
131
0
50
100
150
0
10
20
30
40
50
2010 2011 2012 2013 2014
revenues EBITDA investments assets
15,2% 12,7%
15,7%
5,7%
18,0%
2010 2011 2012 2013 2014
EBITDA Margin
USD million. Exchange rate: COP 2.392,46
19

AGENDA
20

2010 2011 2012 2013 2014
Revenues
EBITDA
Consolidated Income Statement
AOM
USD million. Exchange rate: COP 2.392,46
1.469 1.826 1.799
1.505 1.639
2010 2011 2012 2013 2014
561 585 664 688
2010 2011 2012 2013 2014
1.056 1.265 1.213
841 951
413
21

2010 2011 2012 2013 2014
Net
Income
Consolidated Income Statement
Margins
144 141 114
181
248
USD million. Exchange rate: COP 2.392,46
53% 50% 47%
43% 48%
72% 69% 68%
56% 58%
10% 8% 6% 12% 15%
2010 2011 2012 2013 2014
Operating EBITDA Net
22

3.114 3.638
1.549 1.774
6.024
6.707
2013 2014
Equity Minority interest Liabilities
Consolidated Balance Sheet
Assets by Country
Assets by Business
Asse
ts
Assets in December 2014 totaled USD 12.119 million, -
13,4% increase compared to 2013
Assets 10.687 12.119
USD million. Exchange rate: COP 2.392,46
13,4%
11,4%
16,8%
14,5%
Energy 62,1%
Roads 34,2%
Telecommunications
2,5%
SMRTS 1,1%
COLOMBIA 28,1%
CHILE 34,4%
BRAZIL 23,9%
PERU 13,1%
OTHERS 0,5%
23

BRL 11,3%
COP 17,6%
USD 23,7%
UF + CLP 47,4%
Others 0,1%
Consolidated Financial Debt
USD million. Exchange rate: COP 2.392,46
millions 2013 2014 Change
%
2014
USD
CHILE 4.217.278 4.482.666 6,3% 1.874
COLOMBIA 1.788.574 1.784.963 -0,2% 746
BRAZIL 1.169.464 1.164.658 -0,4% 487
PERU 1.464.947 1.934.281 32,0% 808
BOLIVIA 51.134 51.947 1,6% 22
ARGENTINA 7.071 6.994 -1,1% 3
TOTAL 8.698.468 9.425.510 8,4% 3.940
Breakdown by Rate Breakdown by Source Breakdown by Currency
4,1 4,5
4,7 4,7 4,5 4,3 4,2
4,5
3,2 3,4 3,4 3,1
3,6 3,7
4,2 4,4
1Q13 2Q13 3Q13 2013 1Q14 2Q14 3Q14 4Q14
Debt / EBITDA EBITDA / Interest
Fixed 19,9%
CDI 5,4%
ICP 13,5%
TJLP 3,9%
TAB 6,8%
Libor 5,2%
DTF 4,1%
UF 40,6%
Other 0,6%
Capital Market 73,1%
Banks 26,1%
Other 0,8%
24

ISA's ratings reflect the strong financial profile of
the company, with stable and predictable cash
flows.
25
Rating for bonds issued
AAA(col)
International Corporate Ratings
BBB
Stable outlook
May 2014
International Corporate Ratings
Baa2
Stable outlook
August 2014
International Corporate Ratings
BBB
Stable outlook
August 2014

An investment of USD 4.070 million supports future
growth ...
Investment by country COP %
Colombia 4.249 42,8%
Peru 1.739 17,6%
Brazil 2.448 24,6%
Chile 1.442 14,6%
Others 29 0,3%
Investment by business COP %
Energy 9.176 92,6%
Toll Roads 159 1,6%
Telecommunications 412 4,2%
SMRTS 161 1,6%
COP billions
Projections February 2015
COP 9.908 billion
(USD 4.070 million)
Long-term investment plan ensures ongoing companies growth
2015 2016 2017 2018 2019 2020
Colombia Perú Brasil Chile Otros
3.075
1.939
927 488 475
3.004
26

Investor Relations
Contact
Email [email protected]
Website www.isa.co
Telephone +574 315 7470
@ISA_Avanza /ISAAvanza Interconexión
Eléctrica ISA /CanalISAAvanza
27

ANEXOS

Taxes
29
Colombia 34% + 5% CREE surcharge
Brazil 34%
Chile In the semi-integrated system 27% (as of 2018). From 2014 to 2017 will
rise progressively from 20% to 25,5%.
Bolivia 25%
Peru REP:27% ISA Perú: 22% CTM: 30% PDI: 30% (2015 and 2016: 28%;
2017 and 2018: 27%, and from 2019 hereinafter 26%) in REP, Peru and
CTM ISA rates will not change because they have stability agreement .
Nominal tax rate by country:
2014 breakdown by country and business
Colombia Brasil Perú Chile Otro Total
Energy Transportation 55% 18% 14% 0% 2% 88%
Toll road concessions 0% 0% 0% 9% 0% 9%
Telecommunications Transport 0% 0% 0% -1% 0% 1%
Smart Management of Real Time
Systems 2% 0% 0% 0% 0% 2%
57% 19% 14% 8% 2% 100%
consolidated
effective tax 29%

Compensation for unamortized and/or depreciated
assets existing as of May 2000 at CTEEP
30
08/13/14: A technical assessment report was submitted to ANEEL, which amounted to BRL 5.186 million (*).
01/08/15: CTEEP received the fiscalization report with an estimated compensation amount of BRL 3.605
million (*).
01/06/15: Reconsideration petition was filed to object the value informed in the fiscalization report.
To be done: Definition of the compensation value, monetary restatement, form and term of payment and tax
treatment.
March 2015 SFF will issue pronouncement with its final position
March 2015 CTEEP may file recourse before ANEEL’s Directorship
April 24, 2015 ANEEL’s Directorship approval of compensation value
(CTEEP will have an instance before the Directorship to defend its position)
June 2015 Definition by the Ministry of Mines and Energy –MME– of monetary restatement, term and form
of payment, eventually through tariff for final consumer payable as from July 2015
NEXT STEPS (estimated dates)

Tariff Revision in Colombia
31
2014: CREG issued official letters based on the consulting surveys that were published
regarding remuneration methodologies and Constructive Units, as well as the resolution
draft with the methodology proposal for rate calculation.
02/19/14: CREG published Resolution 178 introducing the resolution draft with the
methodology proposal for transmission remuneration.
What’s next: Review of project by ISA, in order to issue observations and comments (3
months) and issuance of the final resolution by CREG’s Regulatory Agenda (2Q15 –
estimated date).
Aspects under review:
Methodology to calculate remuneration of assets:
Value of Replacement to New Asset Depreciated
Optimized Replacement Cost (DORC)
Methodology to calculate AOM:
From VRN * 3.41% to an efficient methodology
Review of WACC parameters
Aspects not yet defined or not ruled:
Methodology to calculate seniority of assets.
Definition of AOM efficiency factor.
How are new investments for expansions and
replacements approved?
Compensation and energy not provided where CREG and
UPME have not approved reinforcements, investments or
replacements
It affects (related to 2014):
58% of the transmission
revenues in Colombia.
27% of the transmission
revenues
19% of the consolidated
revenues
