presentatie lighthouse 2014 prestatiebelonen een …...2014/06/24 · - staatsblad 15 mei 2014...
TRANSCRIPT
25/06/2014
1
PRESTATIEBELONEN
= EEN PERFORMANT
LOONBELEID?
24 JUNI 2014

25/06/2014
2
AGENDA
Prestatiebelonen = Een performant loonbeleid?
� Inleiding
� Generieke Salarisstudie Hudson
� Evolutie 2014 – 2013
� Genderanalyse
� Strategisch belonen
� From pay to performance
� Resultaten onderzoek CAO 90
� Receptie
AGENDA
Prestatiebelonen = Een performant loonbeleid?
� Inleiding
� Generieke Salarisstudie Hudson
� Evolutie 2014 – 2013
� Genderanalyse
� Strategisch belonen
� From pay to performance
� Resultaten onderzoek CAO 90
� Receptie

25/06/2014
3
AGENDA
Prestatiebelonen = Een performant loonbeleid?
� Inleiding
� Generieke Salarisstudie Hudson
� Evolutie 2014 – 2013
� Genderanalyse
� Strategisch belonen
� From pay to performance
� Resultaten onderzoek CAO 90
� Receptie
6
GENERIEKE SALARISSTUDIE HUDSONMETHODOLOGIE
1. Voorbereidingvan de studie
2. Opstart van de studie
3. Data-inzameling& datacleaning
4. Dataverwerkinganalyse
5. Rapporteringresultaten
6. Feedback verzamelen over
de survey

25/06/2014
4
7
GENERIEKE SALARISSTUDIE HUDSONSTEEKPROEFSAMENSTELLING
21ste editie
541 bedrijven
112.207 observaties
199 referentiefuncties
23 diploma’s
8
GENERIEKE SALARISSTUDIE HUDSONSTEEKPROEFSAMENSTELLING
25%
13%
21%
16%
15%
10%
Aantal werknemers < 50 Werknemers 50 - 99 Werknemers
100 - 249 Werknemers 250 - 499 Werknemers
500 - 999 Werknemers > 1000 Werknemers
28%
18%
12%
23%
19%
Omzet
< 15 Miljoen € 15 - 49,99 Miljoen €
50 - 124,99 Miljoen € 125 - 249,99 Miljoen €
> 250 Miljoen €

25/06/2014
5
9
GENERIEKE SALARISSTUDIE HUDSONSTEEKPROEFSAMENSTELLING
24%
2%
32%9%
7%
7%
19%
Industrie (29%)
Chemie/Farmacie Textiel
Metaal Voeding
Bouw Elektriciteit/Elektronica
Overige Productie
47%
17%4%
4%
1%
27%
Diensten (66%)
Financiële Diensten ICT
Vervoer/Logistiek Advies en bijstand
Non-profit Overige Diensten
28%
72%
Handel (5%)
Groothandel
Retail
AGENDA
Prestatiebelonen = Een performant loonbeleid?
� Inleiding
� Generieke Salarisstudie Hudson
� Evolutie 2014 – 2013
� Genderanalyse
� Strategisch belonen
� From pay to performance
� Resultaten onderzoek CAO 90
� Receptie

25/06/2014
6
EVOLUTIE 2014 – 2013VOORAF
Loonorm:
- Om de twee jaar vastgelegd
- Bepaalt hoeveel de loonkosten mogen stijgen
- Met als doel de loonkostenontwikkeling in België preventief aan te passen aan de verwachte
evolutie bij onze voornaamste handelspartners Duitsland, Nederland en Frankrijk
- 2013 - 2014: de loonnorm is 0%
- Uitzonderingen: o.a. Index, bestaande loonschalen (barema’s), verhoging loonmassa door
toename VTE, CAO afspraken gericht op wegwerken loonkloof mannen/vrouwen, CAO 90
plannen, …
- Een werkgever die de loonnorm niet respecteert kan een boete opgelegd krijgen van 250 tot
5.000 euro
Periode
1997-
1998
1999-
2000
2001-
2002
2003-
2004
2005-
2006
2007-
2008
2009-
2010
2011-
2012
2013-
2014
Norm 6,10% 5,90% 6,4-7% 5,40% 4,50% 5,00% 250 euro 0,30% 0,00%
EVOLUTIE 2014 – 2013VOORAF
De loonkloofwet van 22 april 2012:
- Voor bedrijven met minstens 50 werknemers
- Analyse van de bezoldigingsstructuur van de vrouwelijke en mannelijke werknemers binnen de
onderneming
- Als hieruit een ongelijkheid tussen mannen en vrouwen zou blijken, moeten werkgever en vakbonden samen een actieplan opstellen om dit op te lossen
- Staatsblad 15 mei 2014 (koninklijk en ministerieel besluit): details en modellen van het analyseverslag dat moet worden opgemaakt
- 1ste verslag slaat op het boekjaar dat in 2014 wordt afgesloten
- Deze analyse zal tweejaarlijks moeten gebeuren
- Analyseverslag moet worden overgemaakt aan de ondernemingsraad (indien niet aanwezig
aan de vakbondsafgevaardigde)
- Bij ongelijkheid inzake verloning is het wenselijk om een actieplan op te stellen met als doel
een genderneutrale bezoldigingsstructuur
- Aanstellen van een bemiddelaar: onderdersteunt o.a. de opmaak van het actieplan en de voortgangsrapportage bij de bestrijding van de loonkloof

25/06/2014
7
EVOLUTIE 2014 – 2013BELONINGSBELEID
Top 3 doelstellingen - 2014:
1. Retentie van medewerkers
2. Streven naar marktconforme beloning
3. Loonkostenbeheersing
Top 3 wijzigingen - 2013 & 2014:
1. Variabel loon
2. Bedrijfswagenbeleid
3. Basissalaris
Ondanks de verwachtingen dat het
eenheidsstatuut een meer prominente rol zou
innemen in 2014, blijkt dit minder het geval te zijn
(20%)
Verhogingen van Basissalaris in
2014 (incl. automatische, merit en
collectieve verhogingen, excl.
indexatie, promotie, nieuwe
werknemers)
Poll november ‘13
EVOLUTIE 2014 – 2013METHODOLOGIE
Trends in beloning gebaseerd op een analyse van dezelfde personen in dezelfde functie in dezelfde organisatie
2. Identieke
organisatiesA B C X B Y DD
Organisatie D:
- ID 1
- ID 2
- ID 3
- ID 4
- ID 6
- ID 7
3. Identieke
personen
4. Identieke
functies
2013 20141. Dataset
- functie A
- functie B
- functie C
- functie D
Company D:
- ID 1
- ID 2
- ID 3
- ID 4
- ID 8
- ID 9
- functie A
- functie B
- functie X
- functie Y

25/06/2014
8
EVOLUTIE 2014 – 2013BASISLOON
De gemiddelde salarisstijging voor basissalaris in de Belgische markt
tussen februari 2013 en februari 2014 (exclusief promoties)
BASISSALARIS
Salarisstijging bovenop indexatie: + 1,0%
BASISSALARIS
+ 2,0 %
2013 2014
Indexatie: + 1,0 %
EVOLUTIE 2014 – 2013BASISLOON
4,0%
3,5%
3,8%4,0%
4,3%
5,9%
0,9%
3,7%
4,4%
3,3%
2,0%2,0% 1,9% 1,8% 1,7% 1,8%
4,4%
0,2%
2,2%
3,3%
2,4%
1,0%
2003-2004 2004-2005 2005-2006 2006-2007 2007-2008 2008-2009 2009-2010 2010-2011 2011-2012 2012-2013 2013-2014
Base Salary Indexatie
De gemiddelde salarisstijging voor basissalaris in de Belgische markt 2004 - 2014

25/06/2014
9
EVOLUTIE 2014 – 2013BASISLOON
Het cumulatief effect van indexatie en salarisstijgingen 2004 - 2014
4,0%
3,5%
3,8%
4,0%
4,3%
5,9%0,9%
3,7%
4,4%
3,3%
2,0%
2,0%1,9%
1,8%1,7%
1,8%
4,4% 0,2%2,2%
3,3%2,3%
1,0%
2003 2004 2005 2006 2007 2008 2009 2010 2011 2012 2013 2014
Base Salary Indexatie
+ 25,0%
+ 47,7%
EVOLUTIE 2014 – 2013BASISLOON
Grootorde van salarisstijgingen (excl. Index)
� 2/3de had een salarisevolutie van < 2%
� Wijziging ten opzichte van vorig jaar: - minder mensen hadden een salary freeze- meer mensen hadden een verhogingtussen 0% en 2%
� Het aantal mensen met een stijging van > 2% is gelijkaardig aan vorig jaar
0% 0% - 2% 2% - 4% 4% - 6% 6% - 10% > 10%
2013-2014 / 2012 - 2013
25/06/2014
10
EVOLUTIE 2014 – 2013BASISLOON
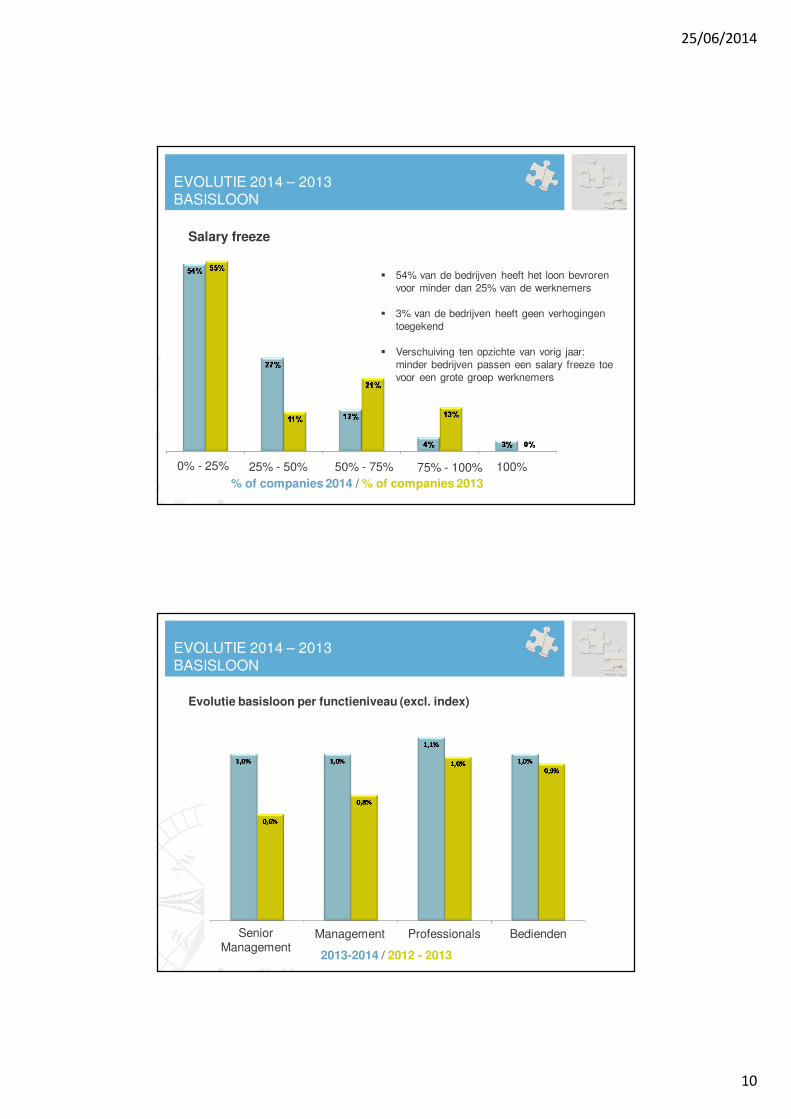
Salary freeze
� 54% van de bedrijven heeft het loon bevroren
voor minder dan 25% van de werknemers
� 3% van de bedrijven heeft geen verhogingen
toegekend
� Verschuiving ten opzichte van vorig jaar:
minder bedrijven passen een salary freeze toe
voor een grote groep werknemers
0% - 25% 25% - 50% 50% - 75% 75% - 100% 100%
% of companies 2014 / % of companies 2013
Evolutie basisloon per functieniveau (excl. index)
EVOLUTIE 2014 – 2013BASISLOON
2013-2014 / 2012 - 2013
Senior Management
Management Professionals EmployeesBedienden

25/06/2014
11
EVOLUTIE 2014 – 2013BASISLOON
Evolutie basisloon per bedrijfsgrootte (excl. index)
2013-2014 / 2012 - 2013
Type I Type II Type III
Is er een verschillende loonevolutie tussen mannen en vrouwen?
22
EVOLUTIE 2014 – 2013BASISLOON
0,98% 0,98%

25/06/2014
12
Conclusie
� Er is nog steeds een evolutie in het basissalaris (exclusief indexatie),
van 1%, dit is een quasi status quo ten opzichte van 2012 – 2013, waar
0,94% gold
� Daaruit kunnen we concluderen dat de loonnorm zich laat gelden.
� In de voorbije drie jaar zien we dat grotere evoluties (> 5%) binnen
het basissalaris jaar na jaar afnemen
� Ten opzichte van vorig jaar passen minder bedrijven een salary
freeze toe, waarbij de groepen waarvoor een salary freeze geldt,
kleiner worden
� Er is geen onderscheid in stijging in basissalaris tussen vrouwelijke
en mannelijke werknemers
EVOLUTIE 2014 – 2013BASISLOON
EVOLUTIE 2014 – 2013TOTAL CASH
TOTAL CASHBASISSALARIS
VARIABEL LOON
VARIABEL LOON (cash uitbetaald)
- Target bonus
- Discretionaire bonus
- CAO 90 bonus
- Commissie
- Markttoeslag
- Winstparticipatie

25/06/2014
13
EVOLUTIE 2014 – 2013TOTAL CASH
De gemiddelde salarisstijging voor Total Cash in de Belgische markt
tussen februari 2013 en februari 2014 (exclusief promoties)
Basissalaris Basissalaris
2013 2014
+ 2,0 %
Variabel loon
TOTAL CASH TOTAL CASH
+ 2,8 %
Variabel loon
EVOLUTIE 2014 – 2013TOTAL CASH
4,0%
3,5%
3,8%4,0%
4,3%
5,9%
0,9%
3,7%
4,4%
3,3%
2,0%2,0% 1,9% 1,8% 1,7% 1,8%
4,4%
0,2%
2,2%
3,3%
2,4%
1,0%
4,0%
3,3%
4,2% 4,1%
4,7%
6,1%
1,1%
4,4% 4,3%
3,3%
2,8%
2003-2004 2004-2005 2005-2006 2006-2007 2007-2008 2008-2009 2009-2010 2010-2011 2011-2012 2012-2013 2013-2014
Base Salary Indexatie Total Cash
De gemiddelde salarisstijging voor Total Cash in de Belgische markt 2004 - 2014

25/06/2014
14
4,0%3,5%
3,8%
4,0%
4,3%
5,9%0,9%
3,7%
4,4%
3,3%
2,0%
2,0%1,9%
1,8%1,7%
1,8%
4,4% 0,2%2,2%
3,3%2,3%
1,0%
4,0%
3,3%
4,2%
4,1%
4,7%
6,1%1,1%
4,4%
4,3%
3,3%
2,8%
2003 2004 2005 2006 2007 2008 2009 2010 2011 2012 2013 2014
Base Salary Indexatie Total Cash
+ 51,2%
EVOLUTIE 2014 – 2013TOTAL CASH
+ 25,0%
+ 47,7%
Variabel loon
� Hoogte variabel loon: Variabel loon als % van Basissalaris
EVOLUTIE 2014 – 2013TOTAL CASH
2013-2014 / 2012 - 2013
Bedienden Professionals Management Senior Management

25/06/2014
15
Variabel loon
� Voorkomen Bonussen: toename voorkomen CAO 90
EVOLUTIE 2014 – 2013TOTAL CASH
Bediende
Professional
Management
Senior Management
2014 2013
Bonus
30% 28%
42% 44%
63% 66%
65% 68%
2014 2013
CAO 90
40% 30%
40% 30%
36% 31%
30% 29%
€ 1.969 € 1.899
€ 3.106 € 3.175
€ 7.702 € 6.203
€ 12.181 € 12.087
Variabel loon
� Hoogte Bonussen
EVOLUTIE 2014 – 2013TOTAL CASH
Bediende
Professional
Management
Senior Management
2014 2013
Bonus
2014 2013
CAO 90
€ 1.025 € 973
€ 1.742 € 1.527
€ 2.217 € 2.358
€ 2.358 € 2.430
25/06/2014
16
EVOLUTIE 2014 – 2013TOTAL CASH
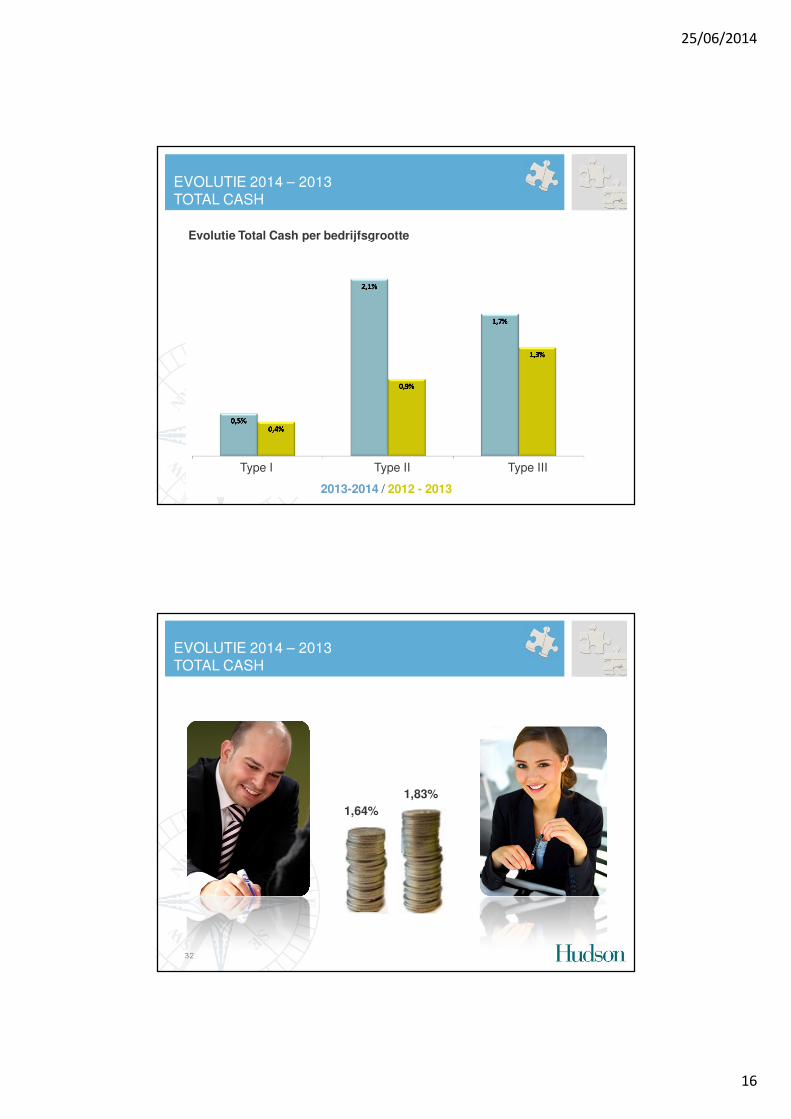
Evolutie Total Cash per bedrijfsgrootte
Type I Type II Type III
2013-2014 / 2012 - 2013
32
EVOLUTIE 2014 – 2013TOTAL CASH
1,64%
1,83%
25/06/2014
17
Conclusie
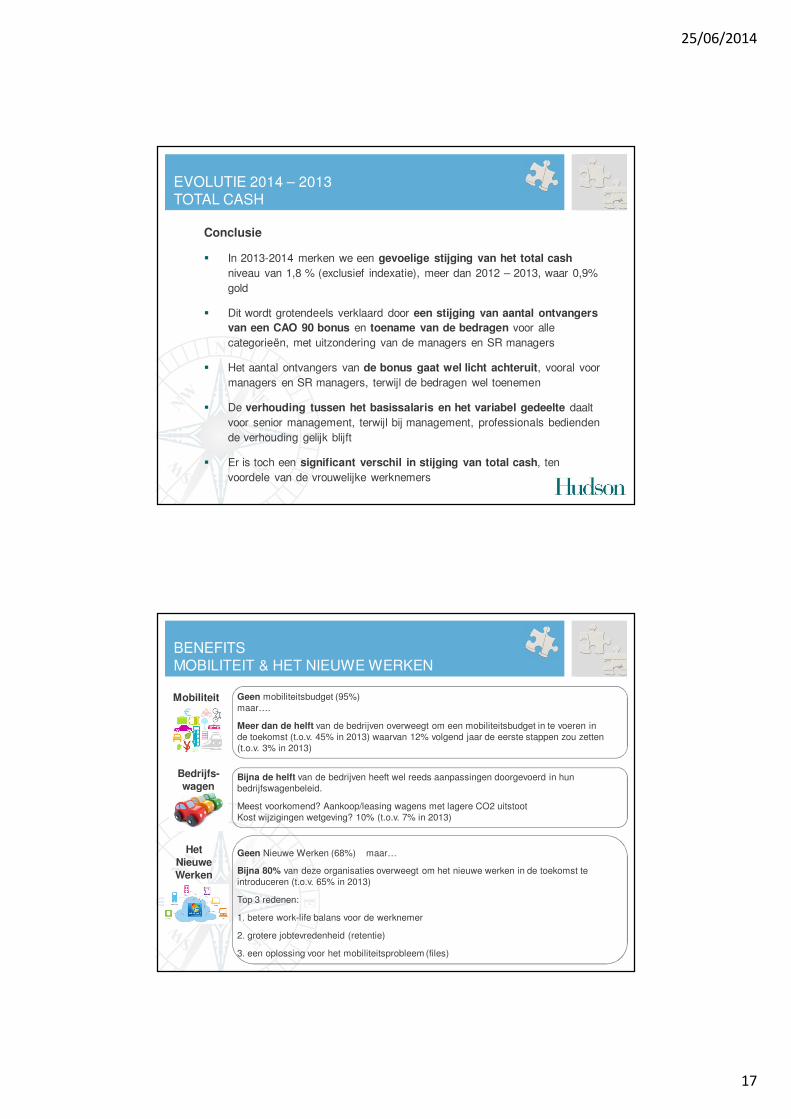
� In 2013-2014 merken we een gevoelige stijging van het total cash
niveau van 1,8 % (exclusief indexatie), meer dan 2012 – 2013, waar 0,9%
gold
� Dit wordt grotendeels verklaard door een stijging van aantal ontvangers
van een CAO 90 bonus en toename van de bedragen voor alle
categorieën, met uitzondering van de managers en SR managers
� Het aantal ontvangers van de bonus gaat wel licht achteruit, vooral voor
managers en SR managers, terwijl de bedragen wel toenemen
� De verhouding tussen het basissalaris en het variabel gedeelte daalt
voor senior management, terwijl bij management, professionals bedienden
de verhouding gelijk blijft
� Er is toch een significant verschil in stijging van total cash, ten
voordele van de vrouwelijke werknemers
EVOLUTIE 2014 – 2013TOTAL CASH
BENEFITSMOBILITEIT & HET NIEUWE WERKEN
Geen mobiliteitsbudget (95%)
maar….
Meer dan de helft van de bedrijven overweegt om een mobiliteitsbudget in te voeren in
de toekomst (t.o.v. 45% in 2013) waarvan 12% volgend jaar de eerste stappen zou zetten
(t.o.v. 3% in 2013)
Bijna de helft van de bedrijven heeft wel reeds aanpassingen doorgevoerd in hun
bedrijfswagenbeleid.
Meest voorkomend? Aankoop/leasing wagens met lagere CO2 uitstoot
Kost wijzigingen wetgeving? 10% (t.o.v. 7% in 2013)
Geen Nieuwe Werken (68%) maar…
Bijna 80% van deze organisaties overweegt om het nieuwe werken in de toekomst te
introduceren (t.o.v. 65% in 2013)
Top 3 redenen:
1. betere work-life balans voor de werknemer
2. grotere jobtevredenheid (retentie)
3. een oplossing voor het mobiliteitsprobleem (files)
Mobiliteit
Bedrijfs-
wagen
Het
Nieuwe
Werken

25/06/2014
18
AGENDA
Prestatiebelonen = Een performant loonbeleid?
� Inleiding
� Generieke Salarisstudie Hudson
� Evolutie 2014 – 2013
� Genderanalyse
� Strategisch belonen
� From pay to performance
� Resultaten onderzoek CAO 90
� Receptie
Vrouwen werken vaker deeltijds �maakt een groot deel uit van de ongelijkheid op de arbeidsmarkt
GENDERANALYSE
Bron: http://igvm-iefh.belgium.be/
Loonkloof bij leidinggevenden: 15%
Loonkloof stijgt met het aantal werknemers in de onderneming
Verschil op jaarbasis: 23%
Loonkloofrapport 2013 door Instituut voor de Gelijkheid van
Vrouwen en Mannen Vrouwen verdienen per uur gemiddeld 10% minder dan
mannen
Equal pay day: 18 maart 2014

25/06/2014
19
GENDERANALYSEBASISSALARIS
4%
-3%
-4%
-8%
Vrouwen
Mannen
Bedienden Professionals Management Senior Management
38
1%
-3%
-4%
-13%
GENDERANALYSETOTAL CASH
Vrouwen
Mannen
Bedienden Professionals Management Senior Management
Vrouwen
Mannen
25/06/2014
20
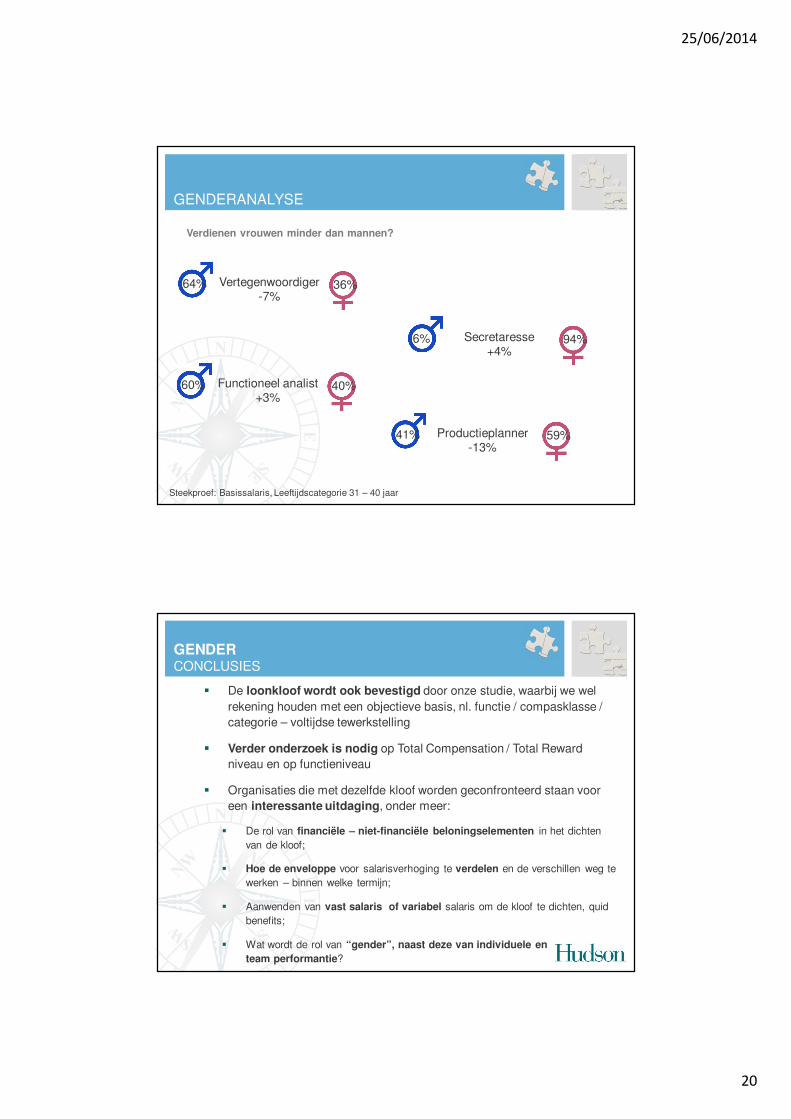
Verdienen vrouwen minder dan mannen?
GENDERANALYSE
Vertegenwoordiger-7%
64% 36%
Secretaresse+4%
6% 94%
Functioneel analist+3%
60% 40%
Steekproef: Basissalaris, Leeftijdscategorie 31 – 40 jaar
Productieplanner-13%
41% 59%
GENDERCONCLUSIES
� De loonkloof wordt ook bevestigd door onze studie, waarbij we wel
rekening houden met een objectieve basis, nl. functie / compasklasse /
categorie – voltijdse tewerkstelling
� Verder onderzoek is nodig op Total Compensation / Total Reward
niveau en op functieniveau
� Organisaties die met dezelfde kloof worden geconfronteerd staan voor
een interessante uitdaging, onder meer:
� De rol van financiële – niet-financiële beloningselementen in het dichten
van de kloof;
� Hoe de enveloppe voor salarisverhoging te verdelen en de verschillen weg te
werken – binnen welke termijn;
� Aanwenden van vast salaris of variabel salaris om de kloof te dichten, quid
benefits;
� Wat wordt de rol van “gender”, naast deze van individuele en
team performantie?

25/06/2014
21
AGENDA
Prestatiebelonen = Een performant loonbeleid?
� Inleiding
� Generieke Salarisstudie Hudson
� Evolutie 2014 – 2013
� Genderanalyse
� Strategisch belonen
� From pay to performance
� Resultaten onderzoek CAO 90
� Receptie
Beloningsstrategie
“Een verklaring die prioriteiten stelt voor de ontwikkeling en de opvolging van het
beloningsbeleid dat gealigneerd wordt op de organisatie- en HR-strategie en op
de noden van de mensen in de organisatie”
Een beloningsstrategie biedt een antwoord op volgende vragen:
� Waarvoor willen we belonen?
� Hoeveel willen we belonen?
� Hoe willen we belonen?
� Wie beslist er over de beloning?
STRATEGISCH BELONENDEFINITIE

25/06/2014
22
STRATEGISCH BELONENVLERICK MODEL
Functie Functiegewicht / Klasse
Anciënniteit Waarden
Kwalitatieve criteria Long term performantie
Individuele performantie Performantie van team
Kwantitatieve criteria Short term performantie
Competenties Technische expertise
STRATEGISCH BELONENSELECTEER DE RELEVANTE BELONINGSCRITERIA…
Objectieven
Potentieel
Mobiliteit
Performantie van
organisatie
Promotie
Diploma

25/06/2014
23
STRATEGISCH BELONENDE BELONINGSCRITERIA… VOORBEELD
0
0
0
1
5
6
7
0
6
1
3
6
4
4
2
0
4
0
6
0 1 2 3 4 5 6 7 8
niet-cijfermatige/kwalitatieve criteria
cijfermatige/objectieve criteria
short term
long term
performantie lokale organisatie
performantie van team/business unit
individuele performantie
performantie internationaleorganisatie
horizontale groei
verticale groei
technische expertise
potentieel
waarden
functiegewicht
functie
diploma
objectieven
anciënniteit
competenties
Strategisch belonen
Criteria
Waarvoor willen bedrijven belonen?
STRATEGISCH BELONENUITKOMST VAN RECENTE STRATEGISCHE WORKSHOPS
TOP 5 gekozen criteria TOP 5 niet gekozen criteria
Diploma Individuele prestaties
Bedrijfswaarden
Functiegewicht / klasse
Lange termijn prestaties
Teamprestaties
Kwantitatieve criteria
Competenties
Potentieel
Anciënniteit

25/06/2014
24
Hoeveel willen bedrijven verlonen?
� Voornaamste observatie: bescheidenheid heeft de bovenhand
� De keuze van referentiemarkt is gebaseerd op observaties uit de realiteit, op feiten en cijfers
� Beperkte differentiatie op vlak van positionering op de markt tussen verschillende
functieklassen of –families, keuze voor een meer egalitaire aanpak
� Bewuste positionering op de markt voor Basissalaris, Total Cash en Total Compensation
� Positionering op marktmediaan – voor een normaal prestatieniveau
� Voor hoge prestaties – mogelijkheid om tot het 75ste percentiel te verdienen van de referentiemarkt – Total Cash
� Meer regelmatige opvolging van de marktpraktijken voor specifieke profielen (IT, Accounting, …)
� Rekening houden met niet-financiële verloningselementen bij de aanpak van de markt:
� Employer branding, New Way of Work, carrièrekansen, training, ligging,…
� Redenen om iets onder de referentiemarkt te liggen voor het basisloon/ variabel loon
STRATEGISCH BELONENUITKOMST VAN RECENTE STRATEGISCHE WORKSHOPS
Hoe willen we belonen?
� De aanpak van “total reward” werd
volledig overgenomen
� Nadruk op marketing & communicatie
van het huidige pakket
� Veel aandacht voor de niet-financiële
elementen en de intrinsieke
motiveringsfactoren (leadership
programma’s, coaching, …) gegeven de
beperkte financiële ruimte
� Generatiebewust verloning waarbij de
“reward mix” in lijn ligt met de individuele
noden van de werknemers, op basis van
resultaten uit tevredenheidsenquêtes
� Keuze voor flexibele verloning, maar
nog veel aarzeling (budgettaire
beperkingen/ gebrek aan
zekerheid/juridische stabiliteit)…
STRATEGISCH BELONENUITKOMST VAN RECENTE STRATEGISCHE WORKSHOPS

25/06/2014
25
Wie beslist over de beloning?
� Er wordt veel aarzeling opgemerkt bij discussies over de rol van SR Managers
en eerstelijnsmanagers in beslissingen rond beloning
� Bevestiging van de rol van SR managers/ lijnmanagers in het performance &
development proces – succession management – workforce planning –
talent review
� Toenemende betrokkenheid van SR managers / lijnmanagers bij beslissingen
over functieclassificatie – meer autonomie om zelf het team samen te stellen
� Directiecomités willen SR managers de verantwoordelijkheid geven voor het
beheer van de loonmassa en de loonevolutie in co-ownership met Finance &
HR … maar twijfelen of dit op korte termijn haalbaar is
STRATEGISCH BELONENUITKOMST VAN RECENTE STRATEGISCHE WORKSHOPS
Wanneer we onze huidige klanten bekijken, zien we een duidelijke verschuiving in focus /investeringen:
Functie
Organisatie
Classificatiestructuur
Smalle functieclassificatie-
structuur / salarisbanden
Performance & Development
proces
Functiebeschrijving
Medewerker
Job crafting / design
Performance & Development
proces
Brede banden
/ brede salarisbanden
Leadership
Beschrijving rol/functiefamilie
STRATEGISCH BELONENUITKOMST VAN RECENTE STRATEGISCHE WORKSHOPS

25/06/2014
26
AGENDA
Prestatiebelonen = Een performant loonbeleid?
� Inleiding
� Generieke Salarisstudie Hudson
� Evolutie 2014 – 2013
� Genderanalyse
� Strategisch belonen
� From pay to performance
� Resultaten onderzoek CAO 90
� Receptie
FROM PAY TO PERFORMANCESPREKER: XAVIER BAETEN
Opleiding:
� 1987 - 1991 Universiteit Gent
Master in Economie
� 1991 - 1992 Vlerick Business School
Master na Master Tax & Accountancy
Huidige functie:
� Professor Vlerick Business School
� Head of the Center for Excellence in Strategic Rewards
Contactgegevens:
℡ 09 210 98 97

25/06/2014
27
FROM PAY TO PERFORMANCE
SPREKER: MAARTEN SIMON
Opleiding:
� 1995 – 2000 Universiteit GentMaster Rechten
Huidige functie:
� Counsel – lawyer: specialisatie in labour and employment law
Ervaring:
� He has assisted several clients during a number of important restructuring operations and offers assistance to companies in their queries concerning employment contracts, collective information and consultation, strikes, social elections, international employment and social security
� He is a regular speaker at Vlerick Business School and M&D Seminars
Contactgegevens:
℡ +32 (0)9 261 50 01

25/06/2014
28
FROM PAY TO PERFORMANCE!
PROF DR XAVIER BAETEN (VLERICK BUSINESS SCHOOL) &
MAARTEN SIMON (CLAEYS & ENGELS)
56

25/06/2014
29
© Vlerick Business School
AGENDA
57
Pay-for-performance: framing & research insights
CBA 90:
What?
Why?
CBA 90 as an instrument for strategic rewards
1PAY-FOR-PERFORMANCE:
FRAMING & RESEARCH INSIGHTS
58

25/06/2014
30
1.1PAY-FOR-PERFORMANCE: WHAT?
59
© Vlerick Business School
VARIABLE PAY: WHAT’S IN A NAME?
60
Meritpay/bonus
Stock appreciation
rights
Stock option plans
Share plans
Team incentives
GoalsharingGainsharing Profit sharing
Discretionarybonuses
Sales commissions
Piece rates

25/06/2014
31
© Vlerick Business School
VARIABLE PAY: STRUCTURING OUR THOUGHTS
61
Timeframe
Whichperformance?
Whoseperformance?
Payout
1.2PAY-FOR-PERFORMANCE:
SOME STAKEHOLDER OPINIONS
62

25/06/2014
32
© Vlerick Business School
COMP & BEN’S VOICE
63Centre for Excellence in Strategic Rewards
© Vlerick Business School
COMP & BEN’S VOICE
64Centre for Excellence in Strategic Rewards

25/06/2014
33
© Vlerick Business School
COMP & BEN’S VOICE
65Centre for Excellence in Strategic Rewards
© Vlerick Business School
THE EMPLOYEES’ VOICE -RATIO FIXED VERSUS VARIABLE PAY
On average, employees prefer 78% fixed pay and 22% variable
%0 20 40 60 80 100
Pct 25
Mean
Pct 75
Pct 25
Mean
Pct 75
DS
LL
Variable
Fixed
Centre for Excellence in Strategic Rewards

25/06/2014
34
© Vlerick Business School
THE EMPLOYEES’ VOICE -CRITERIA UNDERLYING VARIABLE PAY
1,0 1,5 2,0 2,5 3,0 3,5 4,0 4,5 5,0
Org./BU performance
Team performance
Behavioural measures
Competence/skill development
Individual performance
Centre for Excellence in Strategic Rewards
© Vlerick Business School
THE EMPLOYEES’ VOICE –KNOWLEDGE OF PAY
68Mulvey, LeBlanc, Heneman, & McInerney

25/06/2014
35
1.3PAY-FOR-PERFORMANCE:
INSIGHTS FROM ACADEMIC RESEARCH
69
© Vlerick Business School
RIGHT OR WRONG?
70
Yes No
Pay-for-performance increases performance
Rewards based on individual performance are more effective than team-based rewards
Merit pay has a stronger effect on futureperformance than bonuses

25/06/2014
36
© Vlerick Business School
“PAY-FOR-PERFORMANCE INCREASESPERFORMANCE”
71
• 44% increase in output• Increase in variance of output
Incentiveeffect
Sortingeffect
Rynes, Gerhart, & Minette
© Vlerick Business School
“PAY-FOR-PERFORMANCE INCREASESPERFORMANCE”
72
Meta-analysis – 146 studies:
Effect on performance: Yes!
Moderators
Task complexity
Qualitative measures
Garbers & Konradt

25/06/2014
37
© Vlerick Business School
“INDIVIDUAL INCENTIVES ARE MORE EFFECTIVE THAN TEAM-BASED REWARDS”
73
0,32
0,28
0,39
0,19
0,36 0,37
0,450,49
0,56
0,28
0,88
Hedge's g
Individual financial incentive Team-based rewards
Garbers & Konradt (2014)
© Vlerick Business School
“INDIVIDUAL INCENTIVES ARE MORE EFFECTIVE THAN TEAM-BASED REWARDS”
74Garbers & Konradt (2014)
Group characteristics
• Smaller teams• Interdependence• Strong groupperformance norms
• Collective self-efficacy
Procedure
• Feedback• Participative goal setting
• Involvement in design/ implementation
• Criteria under control by group

25/06/2014
38
© Vlerick Business School
“MERIT PAY HAS A STRONGER EFFECT ON FUTURE PERFORMANCE THAN BONUSES”
75Nyberg, Pieper, & Trevor
© Vlerick Business School
RIGHT OR WRONG?
76
Yes No
Pay-for-performance increases performance X
Rewards based on individual performance are more effective than team-based rewards
X
Merit pay has a stronger effect on futureperformance than bonuses
X

25/06/2014
39
2CBA 90: WHAT?
77
What is a CBA 90 bonus?
“non recurring advantages linked to results”
Bonus plan
• introduced through a specific procedure;
• which grants employees a tax-free bonus of up to € 3,131;
• Subject to realisation of predefined targets which must be:
– Transparant,
– Collective,
– Uncertain, and
– Objectively measurable.
78
25/06/2014
40
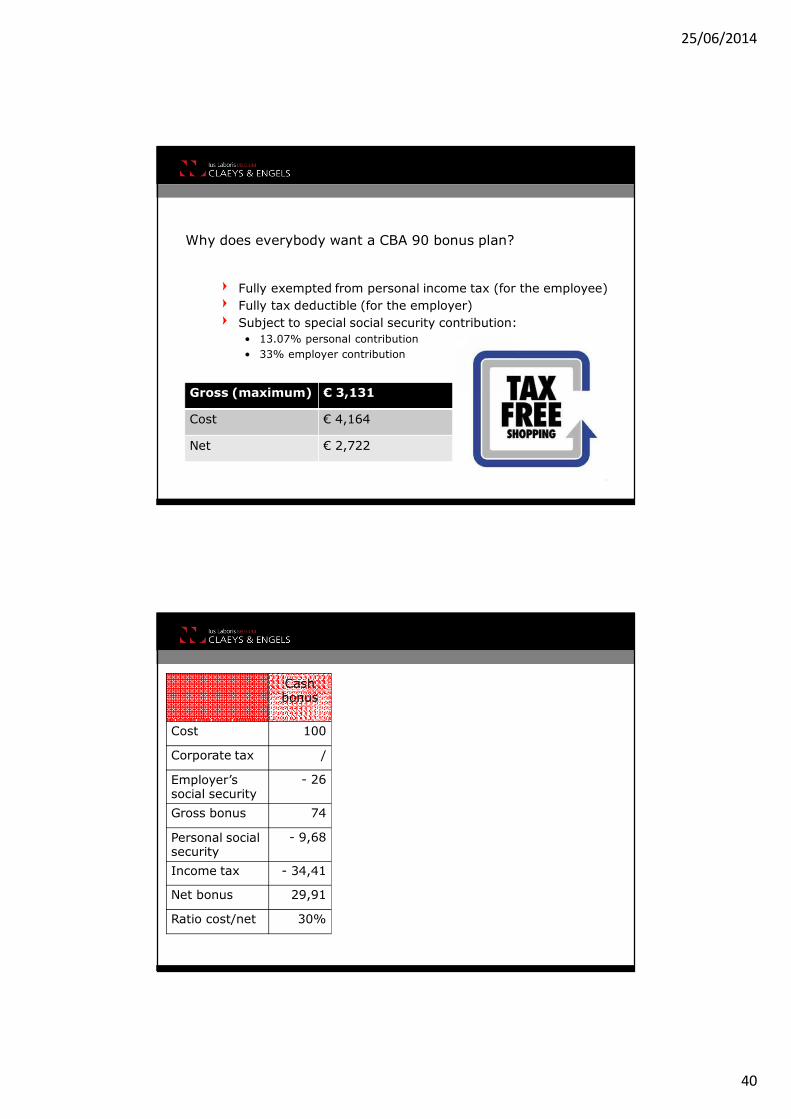
Why does everybody want a CBA 90 bonus plan?
Fully exempted from personal income tax (for the employee)
Fully tax deductible (for the employer)
Subject to special social security contribution:
• 13.07% personal contribution
• 33% employer contribution
79
Gross (maximum) € 3,131
Cost € 4,164
Net € 2,722
Cash bonus
Result bonus
(CBA 90)
Stock options
Benefit Participation
(Act 2001)
Bonus Pension Plan
Cost 100 100 100 100 100
Corporate tax / / / - 34 - 3,88
Employer’ssocial security
- 26 - 24,81 / / - 7,82
Gross bonus 74 75,19 100 66 88,29
Personal socialsecurity
- 9,68 -9,83 / - 8,63 - 4,90
Income tax - 34,41 / - 26,75 - 14,34 - 14,72
Net bonus 29,91 65,36 73,25 43,03 68,67
Ratio cost/net 30% 65% 73% 43% 69%
80

25/06/2014
41
81
Draft plan toemployees
15 days forcomments
Plan to FPS andregister toInspection
FPS checks formalities
Joint Committee or FPS check contents
If ok: approvalIf not ok: employermust amend within
1 month
Negotiate plan with(at least one) union
Sign CBA CBAto FPSFPS checks formalities
Contents are notchecked
If ok: registrationIf not ok: employermust amend within
1 month
Before 1/3rd of reference period
No trade union delegation
With trade union delegation
Procedure
3CBA 90: WHY?
82

25/06/2014
42
3.1SAMPLE
83 CBA 90: Why?
A unique partnership!
CBA 90: Why?

25/06/2014
43
459
CBA 90: Why?
© Vlerick Business School
SAMPLE
CBA 90: Why?

25/06/2014
44
© Vlerick Business School
Manufacturing (C) 27%
Other 24%
Wholesale & retail trade (G) 14%
Professional, scientific and technical activities (M)
8%
Financial and insurance activities (K) 8%
Administrative and supportive service activities (N)
8%
Information and communication (J) 6%
Construction (F) 5%
SAMPLE
CBA 90: Why?
3.2WHY (NOT) IMPLEMENTING CBA 90?
88 CBA 90: Why?

25/06/2014
45
© Vlerick Business School
SINCE WHEN?
89 CBA 90: Why?
© Vlerick Business School
NUMBER OF PLANS
CBA 90: Why?

25/06/2014
46
© Vlerick Business School
ELIGIBILITY
91 CBA 90: Why?
© Vlerick Business School
WHY?
92 CBA 90: Why?

25/06/2014
47
© Vlerick Business School
WHY?
93 CBA 90: Why?
© Vlerick Business School
WHY NOT?
94 CBA 90: Why?

25/06/2014
48
© Vlerick Business School
WHY NOT?
95 CBA 90: Why?
© Vlerick Business School
IMPACT
96 CBA 90: Why?

25/06/2014
49
© Vlerick Business School
IMPACT
97 CBA 90: Why?
Why?
Tax-friendly
Conversion of existing bonus schemes possible
If already partially collective
Flexible target setting
Why not?
98
No link to individualperformance – no differentiation
Union involvement
Examples: union refuses differencesin bonus amounts; union refuses the reduction of absenteeism as a target
Administrative burden
(often overestimated!)
Sceptisism from globalheadquarters

25/06/2014
50
Converting existing bonus scheme: option 1
99
Company
Team
Individual
CBA 90
Separate plan
Converting existing bonus scheme: option 2
100
Company
Team
Individual
CBA 90

25/06/2014
51
Individualizing CBA bonus schemes?
Target level?
Pay-out level?
• Bonus amount as a percentage of base pay / annual pay
• Bonus amount as a percentage of variable pay (?)
• Different bonus amounts, depending on function level / othercriteria (?)
Eligibility criteria?
• Bonus scheme limited to “good performers” (???)
101
Union involvement
Can be avoided if no trade union delegation (or if plan is limited to employees who are not represented by the tradeunion delegation)
Union involvment Involvement of FDS Employment
Be creative to encompass doctrinal refusals
102

25/06/2014
52
4CBA 90 AS AN INSTRUMENT
FOR STRATEGIC REWARDS
103
© Vlerick Business School
CRITERIA
104 CBA 90 as instrument for strategic rewards

25/06/2014
53
105
© Vlerick Business School
CHANGES OVER THE YEARS
38%
Changes:
Criteria: 39%
Target levels (same criteria): 42%
Reference period: 13%
Other: 6%
106 CBA 90 as instrument for strategic rewards

25/06/2014
54
107
- Reducing absenteeism- Reducing work accidents- Respecting safety procedures
- Client satisfaction- Employee satisfaction (?)- Quality standards
- Increase of profit > increase of personnel costs- Successful reorganisation
- Innovation
Examples of bonus targets
Reference period
Minimum 3 months, no maximum
Possibility to combine several plans
108
Plan 1: EBIT
Plan 2: work accidents Plan 3: production duringyear-end peak

25/06/2014
55
Changing the plan itself
CBA Accession Act
Targets Procedure definedin CBA
Not possible
Target levels Procedure definedin CBA
Procedure definedin Plan
Bonus amounts New CBA Not possible
109
> Only for future reference periods?
© Vlerick Business School
COMMUNICATION
Do you communicate on CBA 90 to youremployees?
76% yes
Interim communication on realisation of targets?
63% yes
110 CBA 90 as instrument for strategic rewards

25/06/2014
56
© Vlerick Business School
COMMUNICATION
111 CBA 90 as instrument for strategic rewards
Communication with employees: what does the law say?
Prior communication: only if no trade union delegation
• Draft plan
• Approval / rejection / modification of the plan
Communication during reference period: Bonus plan must contain a follow-up procedure
Communication after reference period: information sheet• Employee name
• Identification of the plan
• Reference period
• For each target: realization and methodology that was used to measure
• Calculation method
• Payment date
• Tax exemption112

25/06/2014
57
© Vlerick Business School
REJECTION BY ADMINISTRATION?
113 CBA 90 as instrument for strategic rewards
© Vlerick Business School
REJECTION BY ADMINISTRATION
Most ‘popular’:
Administration
Formalities (language, form, timeliness)
Targets
Too vague
Too brief
No objective enough
Eligibility
Description
Seniority is not acceptable
Only 1 person in plan
114 CBA 90 as instrument for strategic rewards

25/06/2014
58
Why does the administration refuse plans? (1/2)
Targets are insufficiently clear
Example: “at least the same revenue as last year”
Targets are not objectively measurable
Example: “realize client satisfaction”
Targets do not correspond to reference period
Example: in a plan for 2014: “project X should by realized by August 2014”
Reference period is shorter than three months
Example: “bonus of 100 EUR for every month without working accident”
Targets are not collective
Example: “every employee must have followed training X” (disputable)
115
Why does the administration refuse plans? (2/2)
Complaint procedure is insufficiently detailed
Example: “employee can file a complaint with the HR Manager, who will take a
decision”
Double pro rata
Example: “bonus is 5% of annual salary” + “bonus will be prorated for
part-time employees”
116

25/06/2014
59
© Vlerick Business School
HOW SATISFIED ARE HR MANAGERS WITH CBA 90?
CBA 90 as instrument for strategic rewards
© Vlerick Business School
HR MANAGERS’ SUGGESTIONS FOR CHANGE
118 CBA 90 as instrument for strategic rewards

25/06/2014
60
5CONCLUSIONS
119
© Vlerick Business School
CONCLUSIONS
Pay-for-performance is good for you!
Team-based rewards are even better
But do not forget broader HR context
CBA 90
Popular (and still growing), but still a way to go
Most popular: operational white collars & middlemanagement
Merits: optimisation + incentive effect
Drawbacks: administration + no differentiation
Strategic rewards perspective
No ‘real’ team-based pay
Communication - employee involvement?
No differentiation
120

25/06/2014
61
121
The most negative employee attitudes are those concerning performance pay.
So, what is the underlying problem here?
Is it also a case of
a bad idea gone predictably wrongor, alternatively,
of good ideas being poorly applied?

25/06/2014
62
BACKUP SLIDES
123
Which companies have adopted a CBA 90 bonus plan?
Results of survey
Other sources:
• 2012: 15% of all white-collar workers and 12% of all blue-collarworkers (source: SD Worx)
• 2009: about 190,000 employees (average amount of 260 EUR) (source: Minister of Social Affairs, QRVA 53 012)
Industry-level CBA’s
124

25/06/2014
63
Industry-level CBA 90 (2014)
Industry Target Bonus amount
102.01 (Hainaut) To be defined at company level 2 x 100 EUR
105 + 224 Return on capital employed> 5%> 20%
1 – 3.6% of grosssalary earned duringreference period
116 (Limburg) Profit / Revenue> 0 (minimum)> 10% (maximum)
100 EUR – 300 EUR
140.01 (TEC) (Revenue TEC year X / Revenue TEC year X-1) > (Salary cost TEC year X / Salary Cost TEC year X)1)
33% of the revenueincrease whichexceeds the salarycost increase
140.01 (VMM) Increase of revenue VMM comparedto last year
140 EUR
302 Tonnage of all Belgian sea harbours> 50M ton during reference period(1 April – 30 June)
500 EUR
125
AGENDA
Prestatiebelonen = Een performant loonbeleid?
� Inleiding
� Generieke Salarisstudie Hudson
� Evolutie 2014 – 2013
� Genderanalyse
� Strategisch belonen
� From pay to performance
� Resultaten onderzoek CAO 90
� Receptie

25/06/2014
64
NU BESCHIKBAAR…
� De resultaten van de Generieke Salarisstudie voor de Belgische markt –editie 2014 onder de vorm van:
– Software tools
� Income©
� Editor©
� Editor Advanced©
– Hard copy rapport
– Trendsrapport
– Kwalitatief rapport
� Te verwachten: De nieuw online rapporteringstool