presentation 04 - risk and return 2012.11.15
DESCRIPTION
Introduction into Corporate Finance slidesTRANSCRIPT


Risk and Return
- expected return- notion of risk- measuring risk- risk and portfolio- risk free rate- beta and CAPM
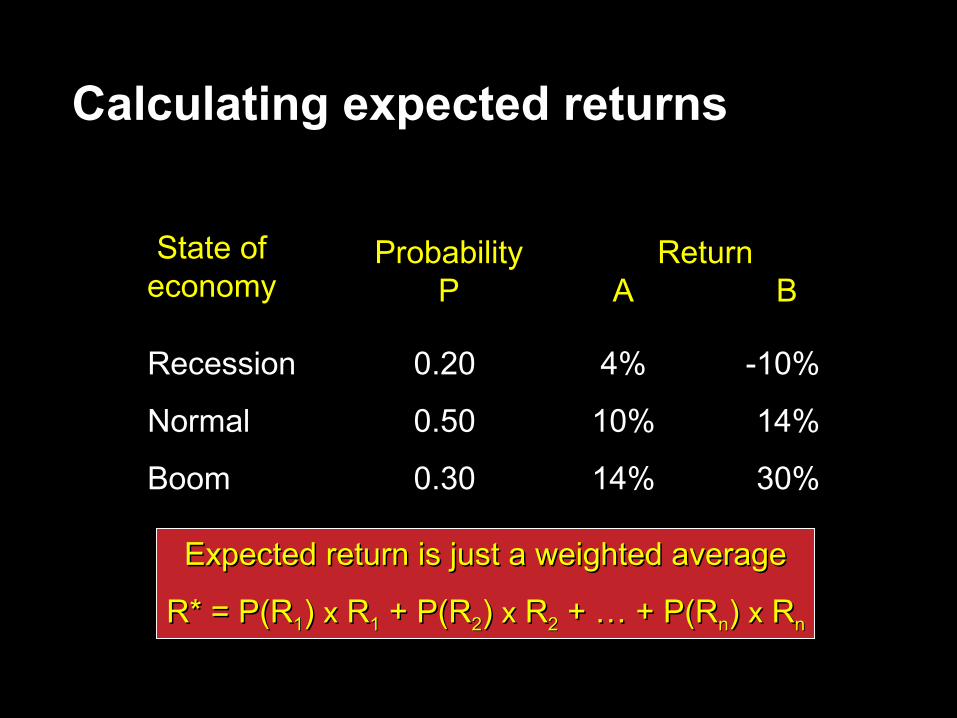
State ofState ofeconomyeconomy
RecessionRecession
NormalNormal
BoomBoom
ProbabilityProbabilityPP
0.200.20
0.500.50
0.300.30
ReturnReturn A B A B
4%4%
10%10%
14%14%
-10%-10%
14%14%
30%30%
Expected return is just a weighted averageExpected return is just a weighted average
R* = P(RR* = P(R11) ) xx R R11 + P(R + P(R22) ) xx R R22 + … + P(R + … + P(Rnn) ) xx R Rnn
Calculating expected returns

State ofState ofeconomyeconomy
RecessionRecession
NormalNormal
BoomBoom
ProbabilityProbabilityPP
0.200.20
0.500.50
0.300.30
ReturnReturn A B A B
4%4%
10%10%
14%14%
-10%-10%
14%14%
30%30%
Company ACompany AR* = P(RR* = P(R11) ) xx R R11 + P(R + P(R22) ) xx R R22 + … + P(R + … + P(Rnn) ) xx R Rnn
RRAA* = 0.2 * = 0.2 xx 4% + 0.5 4% + 0.5 xx 10% + 0.3 10% + 0.3 xx 14% = 10% 14% = 10%
Example

State ofState ofeconomyeconomy
RecessionRecession
NormalNormal
BoomBoom
ProbabilityProbabilityPP
0.200.20
0.500.50
0.300.30
ReturnReturn A B A B
4%4%
10%10%
14%14%
-10%-10%
14%14%
30%30%
Company BCompany BR* = P(RR* = P(R11) ) xx R R11 + P(R + P(R22) ) xx R R22 + … + P(R + … + P(Rnn) ) xx R Rnn
RRBB* = 0.2 * = 0.2 xx -10% + 0.5 -10% + 0.5 xx 14% + 0.3 14% + 0.3 xx 30% = 14% 30% = 14%
Example

Opportunity cost
� Investment A Investment B� Return 10% 12%� No other investment is possible� What is the opportunity cost for Investment A?
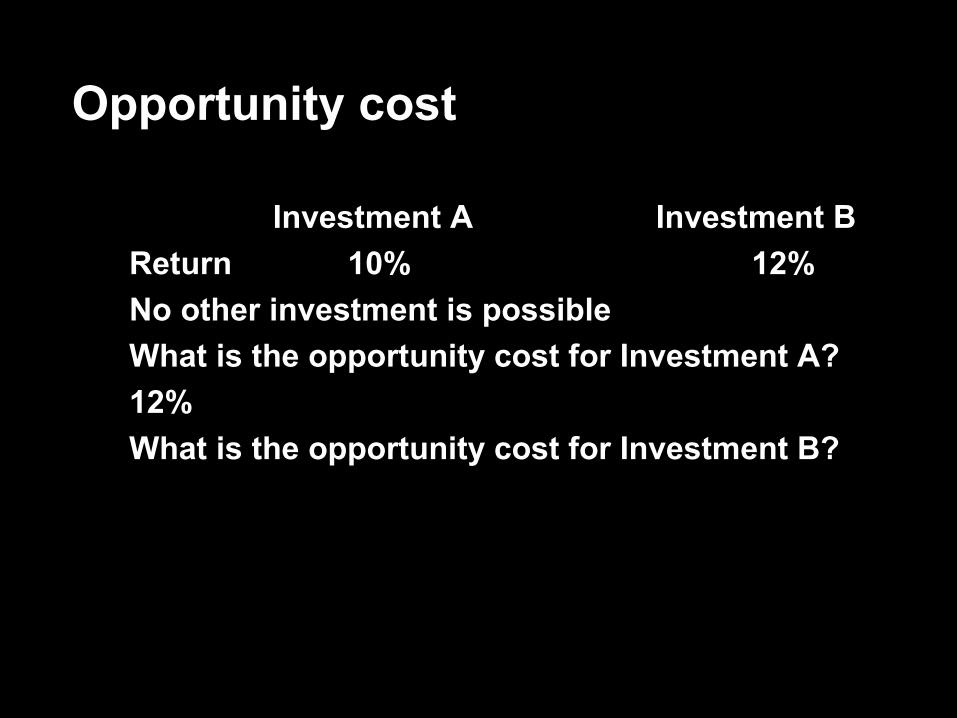
Opportunity cost
� Investment A Investment B� Return 10% 12%� No other investment is possible� What is the opportunity cost for Investment A?� 12%� What is the opportunity cost for Investment B?

Opportunity cost
� Investment A Investment B� Return 10% 12%� No other investment is possible� What is the opportunity cost for Investment A?� 12%� What is the opportunity cost for Investment B?� 10%� Minimise the opportunity cost

Opportunity cost
� Investment A Investment B� Return 10% 12%� No other investment is possible� What is the opportunity cost for Investment A?� 12%� What is the opportunity cost for Investment B?� 10%� Minimise the opportunity cost� RISK?

Petty, Keown, Scott Jr., Martin, Burrow, Martin & Nguyen: Financial Management 4e © 2006 Pearson Education Australia

Financial Risk
� How to measure riskVariance, standard deviation, beta
� How to reduce riskDiversification
� How to price riskSecurity market line, CAPM, APM

What is risk?
� The possibility that an actual return will differ from our expected return
� Uncertainty in the distribution of possible outcomes

0
0.05
0.1
0.15
0.2
-10 -5 0 5 10 15 20 25 30
returnreturn (%) (%)
Company Company 22Company Company 11
0
0.1
0.2
0.3
0.4
0.5
6 10 14
returnreturn (%) (%)
Uncertainty in the distribution of possible outcomes
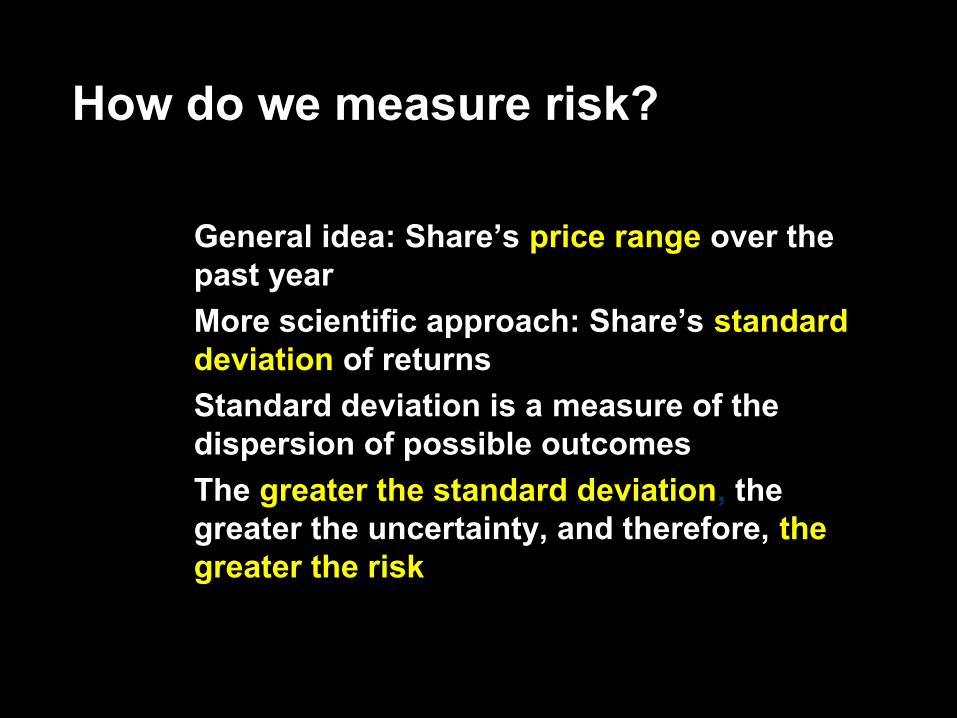
� General idea: Share’s price rangeprice range over the past year
� More scientific approach: Share’s standard standard deviationdeviation of returns
� Standard deviation is a measure of the dispersion of possible outcomes
� The greater the standard deviationgreater the standard deviation, the greater the uncertainty, and therefore, the the greater the riskgreater the risk
How do we measure risk?

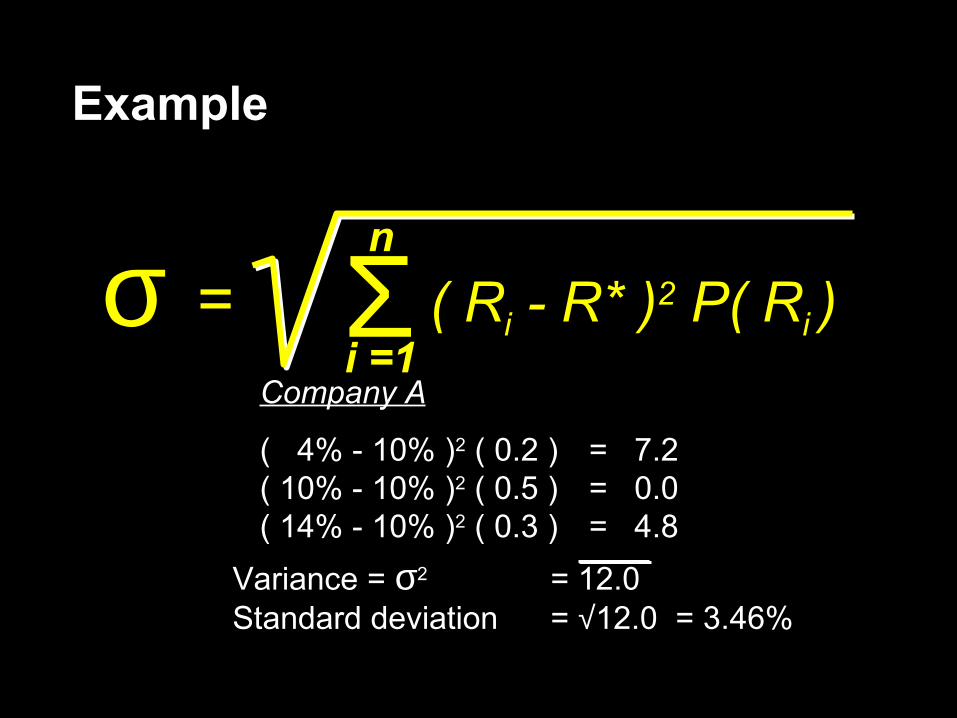
= = (( RRii - - R*R* ))22 P( P( RRii ))σσ ΣΣ nn
i i =1=1
Standard deviation – probability data
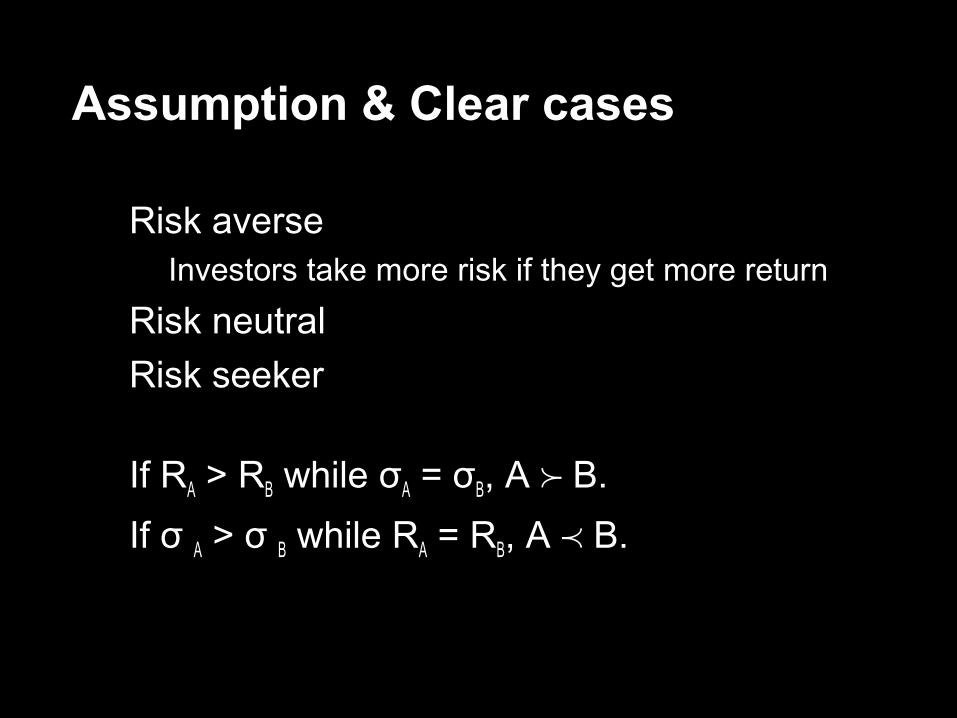
Assumption & Clear cases
� Risk averse� Investors take more risk if they get more return
� Risk neutral� Risk seeker
� If RA > RB while σσAA = = σσBB, A , A B. B.� If σσ A > σσ B while RRAA = R = RBB, A , A B. B.

State ofState ofeconomyeconomy
RecessionRecession
NormalNormal
BoomBoom
ProbabilityProbabilityPP
0.200.20
0.500.50
0.300.30
ReturnReturn A B A B
4%4%
10%10%
14%14%
-10%-10%
14%14%
30%30%
Company ACompany A R* = 10%R* = 10%Company BCompany B R* = 14%R* = 14%
Example
Example
= = (( RRii - - R*R* ))22 P( P( RRii ))σσ ΣΣ nn
i i =1=1Company ACompany A
( 4% - 10% )( 4% - 10% )22 ( 0.2 ) ( 0.2 ) = 7.2= 7.2( 10% - 10% )( 10% - 10% )22 ( 0.5 ) ( 0.5 ) = 0.0= 0.0( 14% - 10% )( 14% - 10% )22 ( 0.3 ) ( 0.3 ) = 4.8= 4.8
Variance = Variance = σσ22 = 12.0= 12.0Standard deviationStandard deviation = = √√12.0 = 3.46% 12.0 = 3.46%

Example
= = (( RRii - - R*R* ))22 P( P( RRii ))σσ ΣΣ nn
i i =1=1Company BCompany B
( -10% - 14% )( -10% - 14% )22 ( 0.2 ) ( 0.2 ) = 115.2= 115.2( 14% - 14% )( 14% - 14% )22 ( 0.5 ) ( 0.5 ) = 0.0= 0.0( 30% - 14% )( 30% - 14% )22 ( 0.3 ) ( 0.3 ) = 76.8= 76.8Variance = Variance = σσ22 = 192.0= 192.0Standard deviationStandard deviation == √√192.0 = 13.86%192.0 = 13.86%
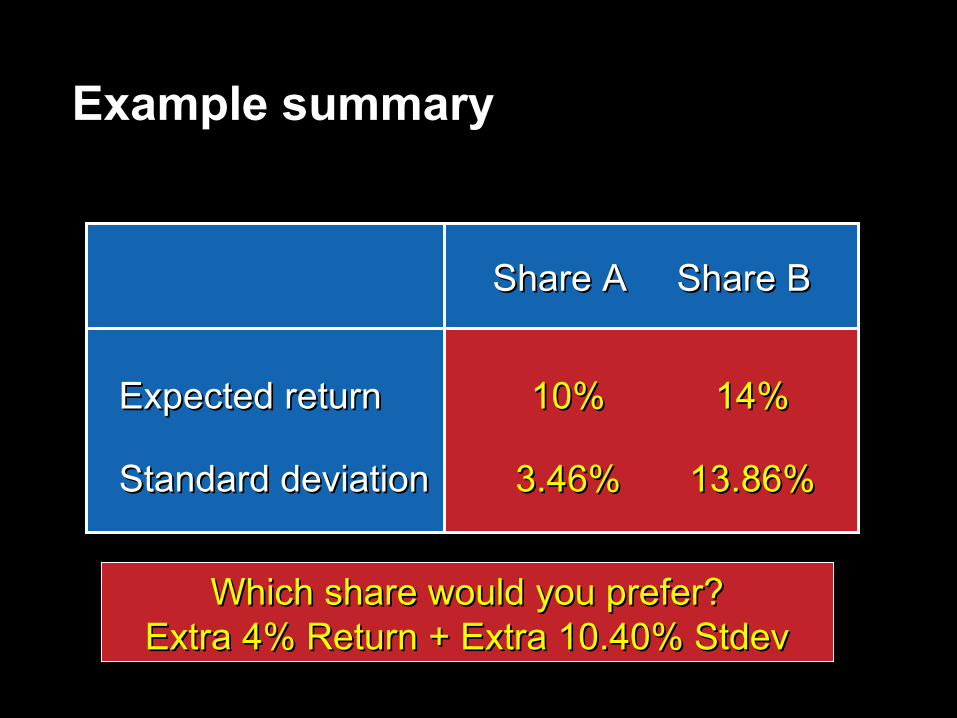
Share AShare A Share BShare B
Expected returnExpected return 10%10% 14%14%
Standard deviationStandard deviation 3.46%3.46% 13.86%13.86%
Example summary
Which share would you prefer?Which share would you prefer?Extra 4% Return + Extra 10.40% StdevExtra 4% Return + Extra 10.40% Stdev
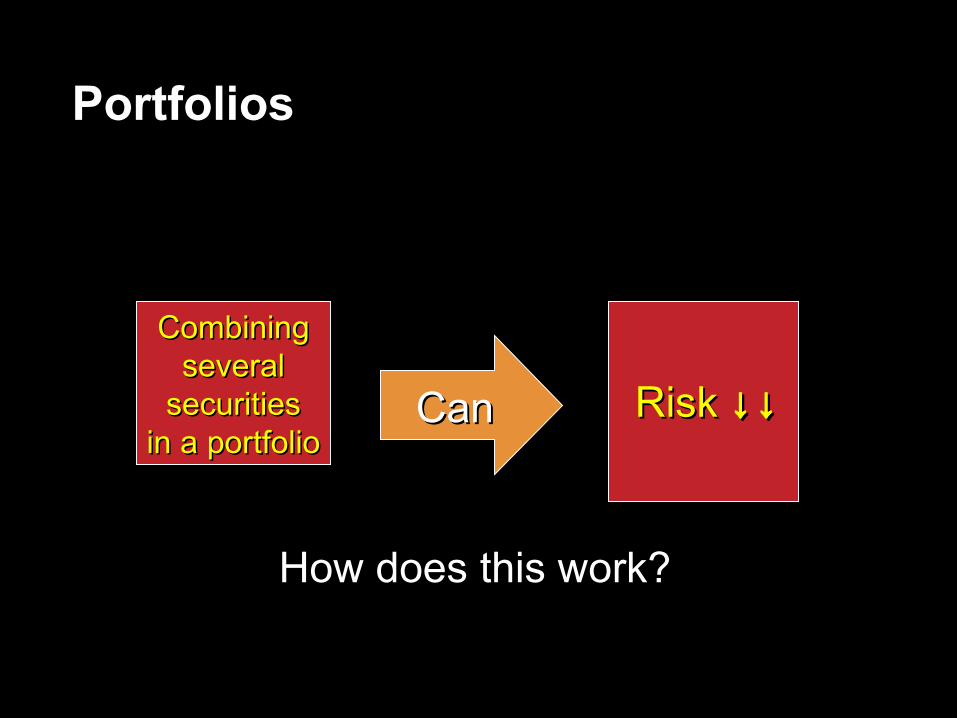
CombiningCombiningseveralseveral
securitiessecuritiesin a portfolioin a portfolio
CanCan Risk Risk ↓↓↓↓
How does this work?How does this work?
Portfolios

PerfectPerfectdiversification.diversification.
Risk isRisk isminimisedminimised
No effectNo effecton riskon risk
perfectlyperfectlypositivelypositivelycorrelatedcorrelated
perfectlyperfectlynegativelynegativelycorrelatedcorrelated
IfIfsecurities securities
areare
Investing in Investing in two securitiestwo securitiesto reduce riskto reduce risk
Simple diversification
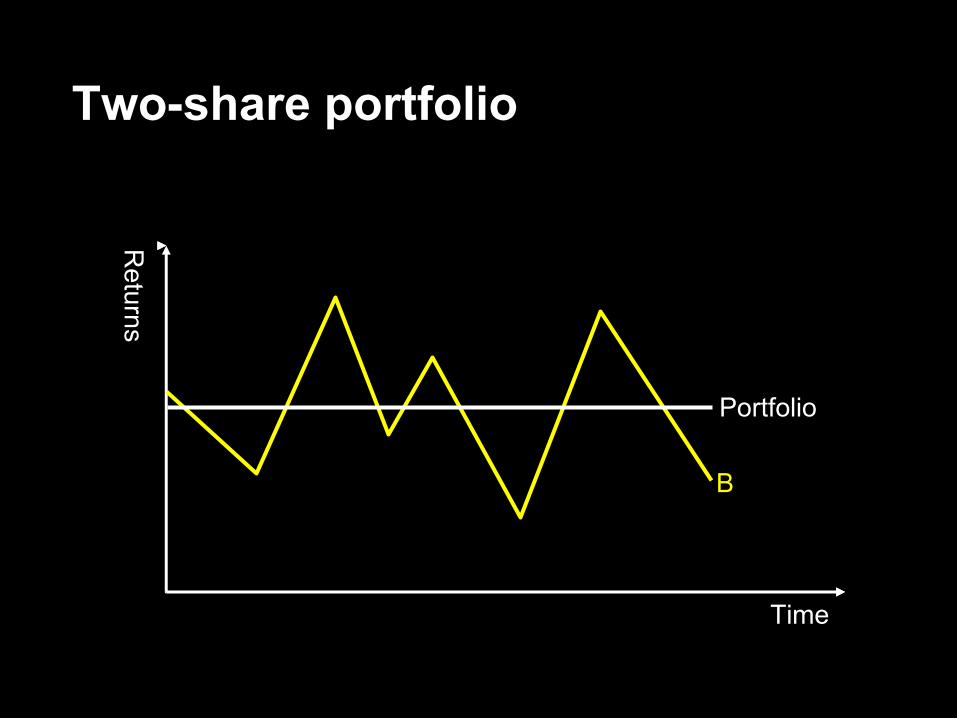
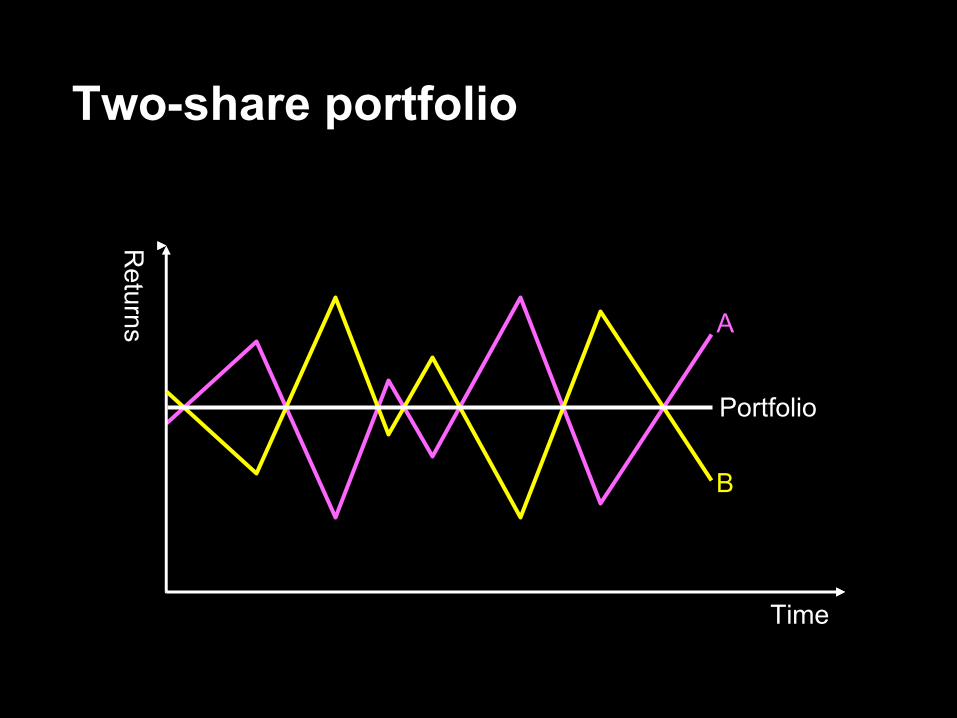
Two-share portfolio
Returns
Returns
TimeTime
BB
PortfolioPortfolio
AA
Two-share portfolio
Returns
Returns
TimeTime
BB
PortfolioPortfolio

AA
Two-share portfolio
Returns
Returns
TimeTime
BB
PortfolioPortfolio
Perfec
t neg
ative
Perfec
t neg
ative
corre
lation
corre
lation
remov
es ris
k
remov
es ris
k

Combining two shares
� Changing proportions � Share A: 100% Share B: 0%� Share A: 99% Share B: 1%� ….
� Correlation is measured by correlation coefficient [-1;1]
� EXCEL
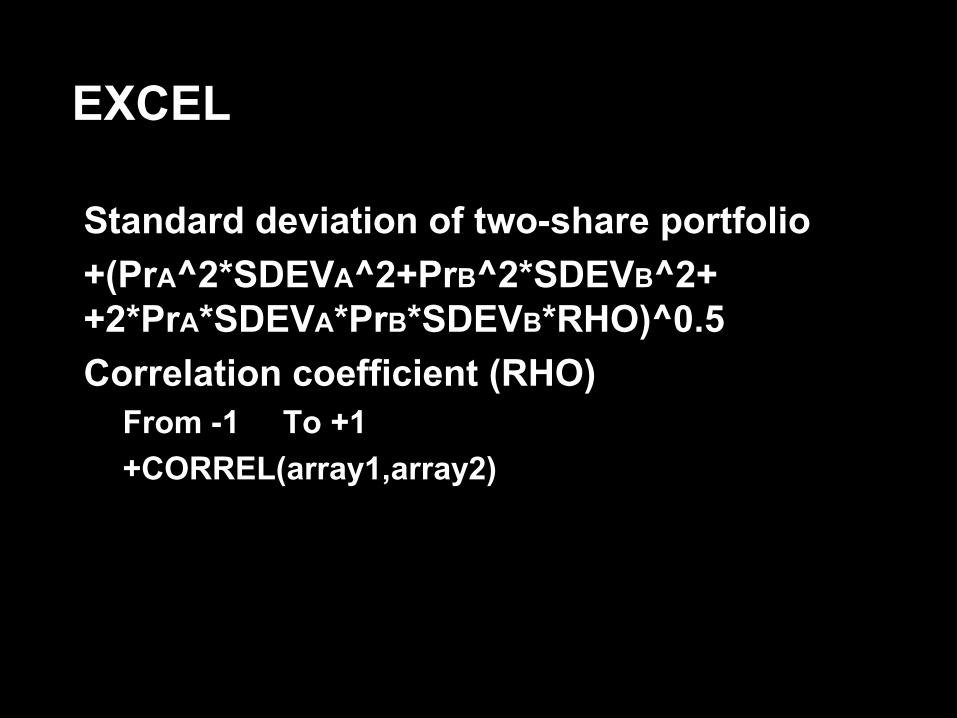
EXCEL
� Standard deviation of two-share portfolio� +(PrA^2*SDEVA^2+PrB^2*SDEVB^2+
+2*PrA*SDEVA*PrB*SDEVB*RHO)^0.5� Correlation coefficient (RHO)
� From -1 To +1� +CORREL(array1,array2)

Portfolio risk
Depends on:� Proportion of funds invested in each asset� The risk associated with each asset in the
portfolio� The relationship between each asset in the
portfolio with respect to risk� No perfect negative correlation in real life
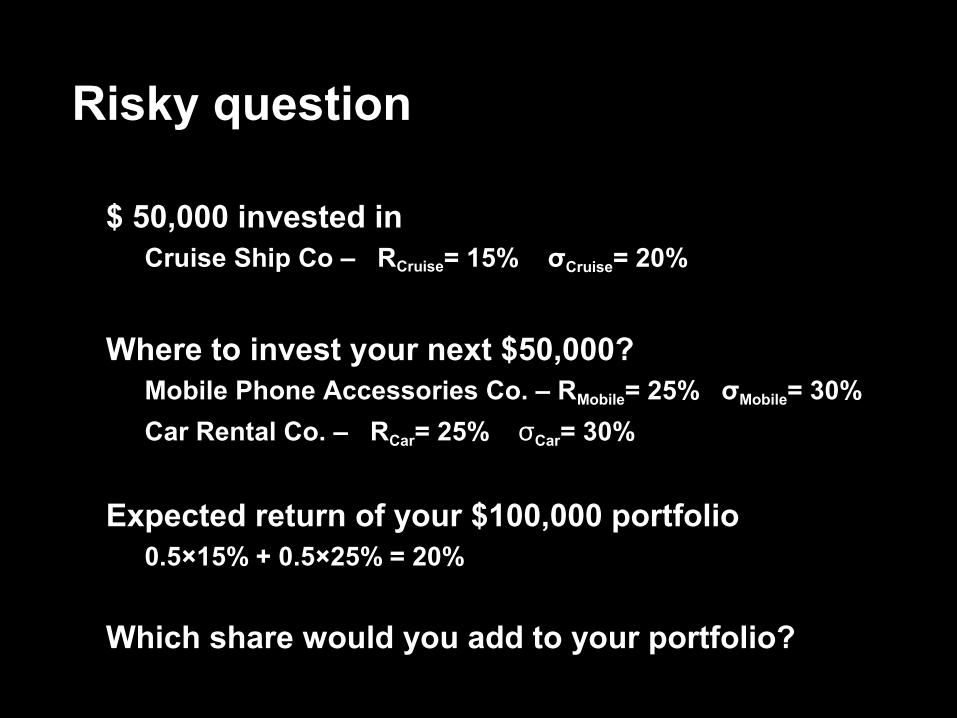
Risky question
� $ 50,000 invested in� Cruise Ship Co – RCruise= 15% σCruise= 20%
� Where to invest your next $50,000?� Mobile Phone Accessories Co. – RMobile= 25% σMobile= 30%� Car Rental Co. – RCar= 25% σσCar= 30%
� Expected return of your $100,000 portfolio � 0.5×15% + 0.5×25% = 20%
� Which share would you add to your portfolio?
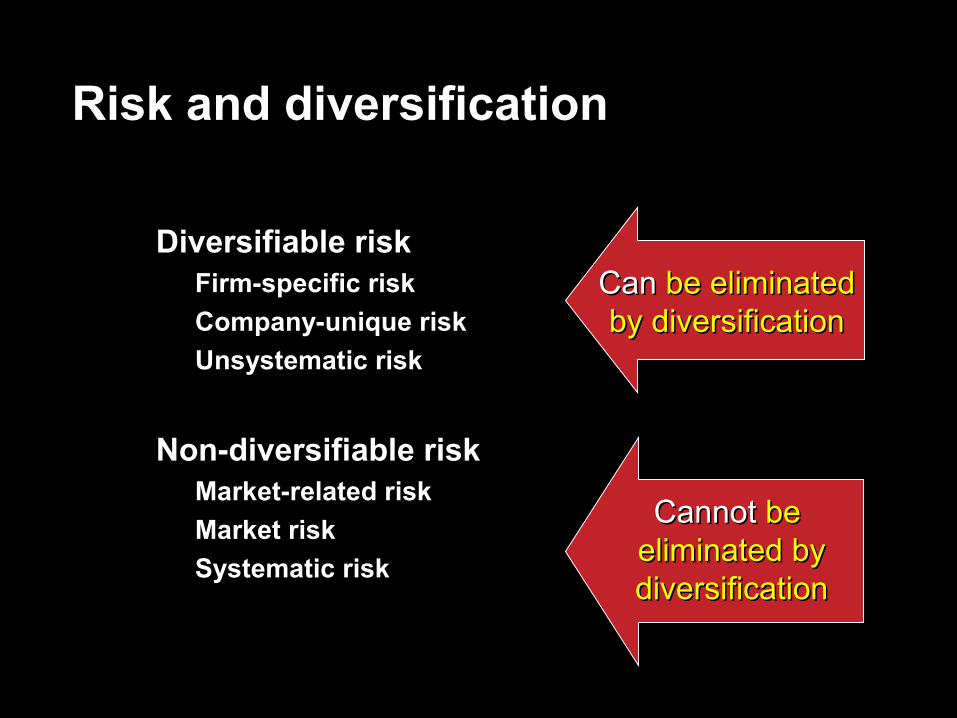
� Diversifiable risk� Firm-specific risk� Company-unique risk� Unsystematic risk
� Non-diversifiable risk� Market-related risk� Market risk� Systematic risk
CanCan be eliminated be eliminated by diversificationby diversification
CannotCannot be be eliminated by eliminated by diversificationdiversification
Risk and diversification
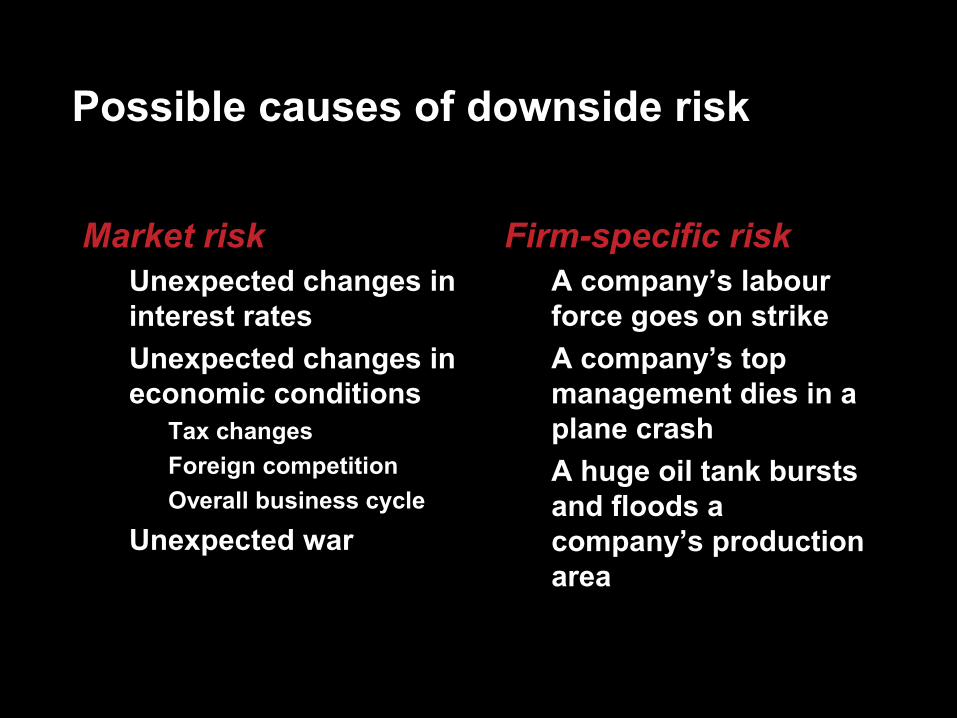
Market risk� Unexpected changes in
interest rates� Unexpected changes in
economic conditions� Tax changes� Foreign competition� Overall business cycle
� Unexpected war
Firm-specific risk� A company’s labour
force goes on strike� A company’s top
management dies in a plane crash
� A huge oil tank bursts and floods a company’s production area
Possible causes of downside risk
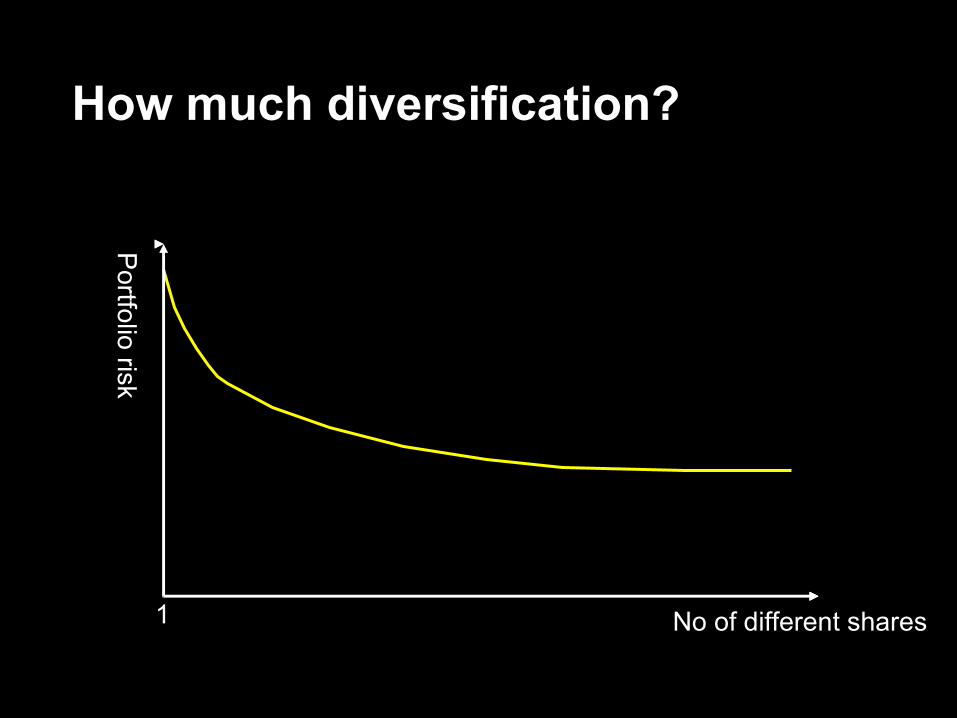
No of different sharesNo of different shares
Portfolio risk
Portfolio risk
11
How much diversification?

Nondiversifiable riskNondiversifiable risk
No of different sharesNo of different shares
Portfolio risk
Portfolio risk
11 3030
How much diversification?

Diversifiable riskDiversifiable risk
Nondiversifiable riskNondiversifiable risk
No of different sharesNo of different shares
Portfolio risk
Portfolio risk
11 3030
How much diversification?

Diversifiable riskDiversifiable risk
Nondiversifiable riskNondiversifiable risk
No of different sharesNo of different shares
Portfolio risk
Portfolio risk
11 3030
Almost all possible gains Almost all possible gains from diversification are from diversification are
achieved with a achieved with a carefully carefully chosenchosen portfolio of 30 portfolio of 30
sharesshares
How much diversification?
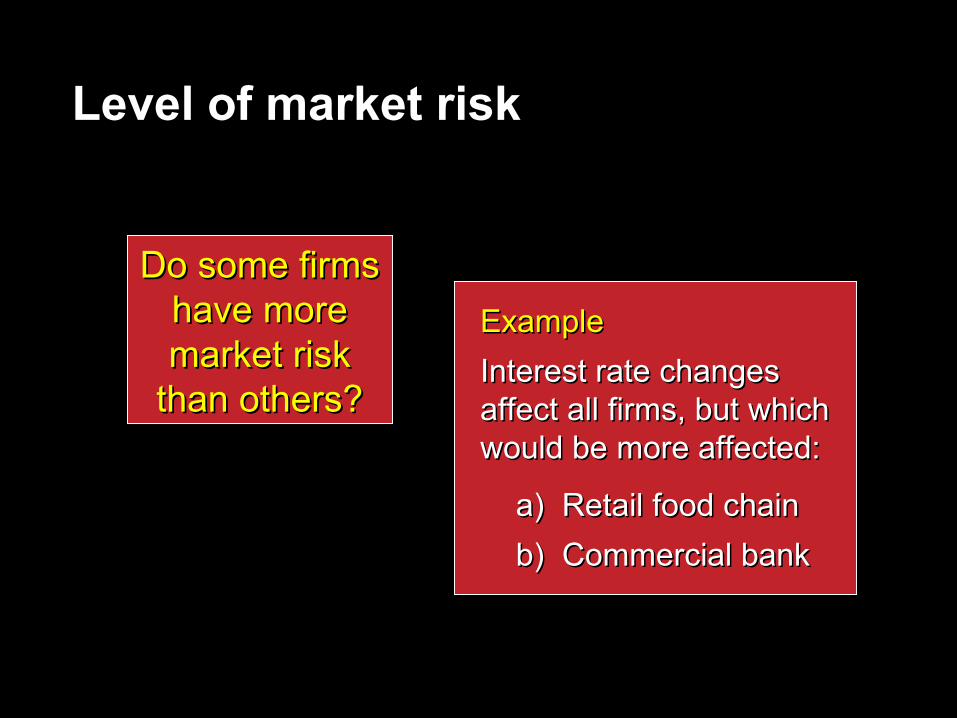
Do some firms Do some firms have more have more market risk market risk
than others?than others?
ExampleExampleInterest rate changesInterest rate changesaffect all firms, but which affect all firms, but which would be more affected:would be more affected:
a) Retail food chaina) Retail food chain b) Commercial bankb) Commercial bank
Level of market risk

Do some firms Do some firms have more have more market risk market risk
than others?than others?
YESYES
ExampleExampleInterest rate changesInterest rate changesaffect all firms, but which affect all firms, but which would be more affected:would be more affected:
a) Retail food chaina) Retail food chain b) Commercial bankb) Commercial bank
Level of market risk

Risk and return
� Investors are only compensated for accepting market risk
� Firm-specific risk should be diversified away
A need A need to to
measure measure market market
risk for a risk for a firmfirm

A measure of:
� How an individual share’s returns vary with market returns
� The “sensitivity” of an individual share’s returns to changes in the market
� For the market: Beta = 1Beta = 1� A firm with Beta =1Beta =1 has
average market risk. It has the same volatilitysame volatility as the market
� A firm with Beta > 1Beta > 1 is more volatilemore volatile than the market
� A firm with Beta < 1Beta < 1 is less volatileless volatile than the market
Beta: A measure of market risk

Calculating beta
MarketMarketindexindexreturnreturn(%)(%)
Company XYZ return (%)Company XYZ return (%)
Characteristic lineCharacteristic line Beta = slope of Beta = slope of characteristiccharacteristic
lineline

RequiredRequiredrate of rate of returnreturn
==Risk-freeRisk-free
rate ofrate ofreturnreturn
ReasonReason::Treasury securities are free of default riskTreasury securities are free of default risk
For a Treasury security, what is the required rate of return?

RequiredRequiredrate of rate of returnreturn
==Risk-freeRisk-free
rate ofrate ofreturnreturn
How large a risk premium should we How large a risk premium should we require to buy a corporate security?require to buy a corporate security?
++RiskRisk
premiumpremium
For a company security, what is the required rate of return?
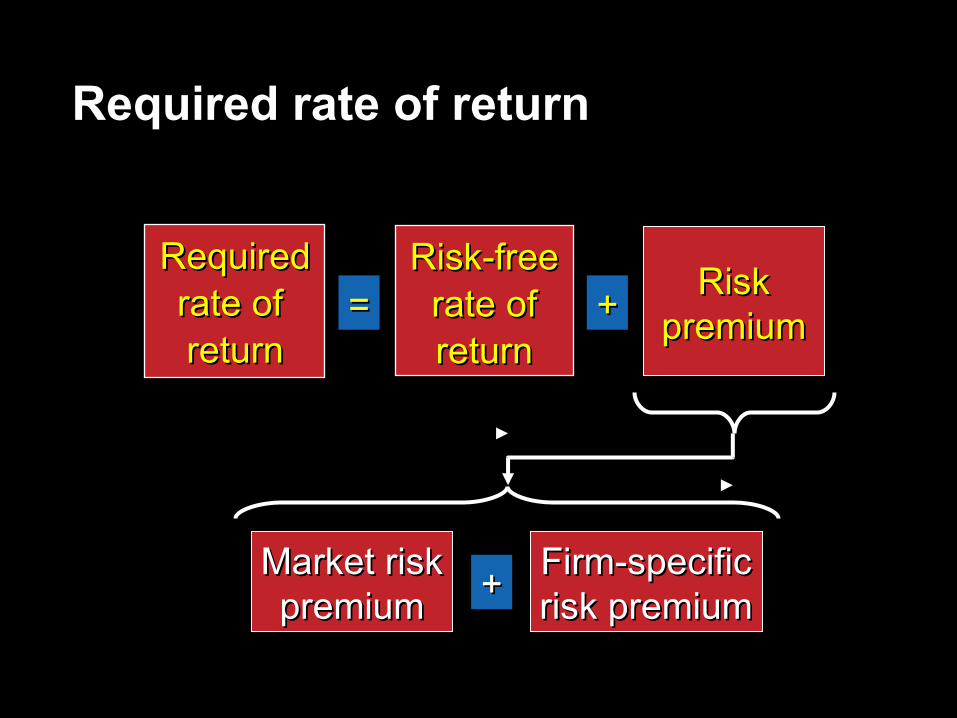
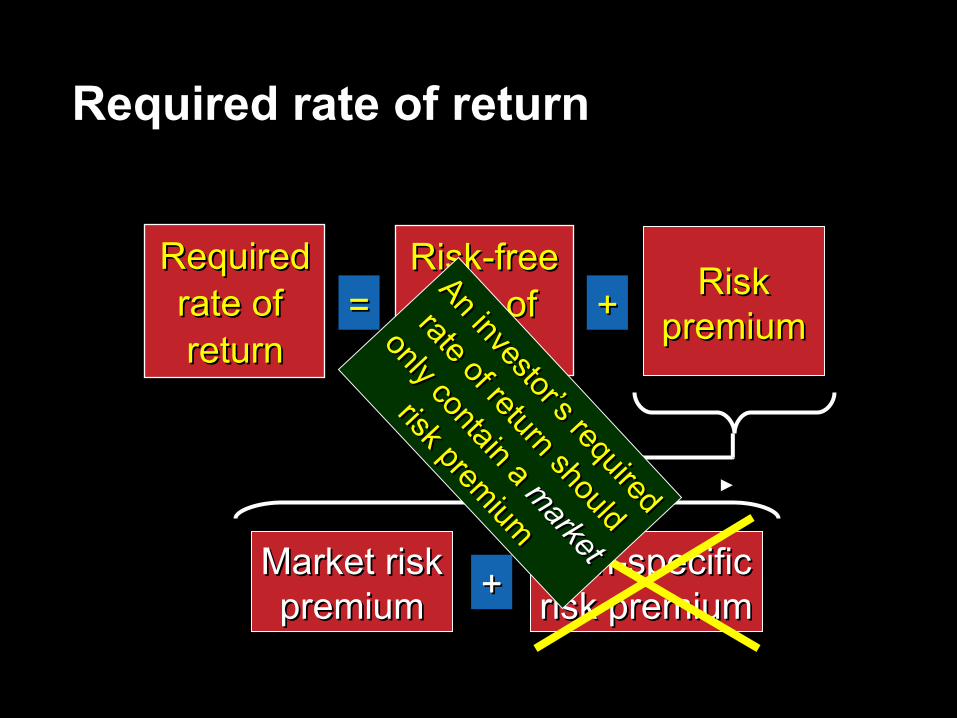
RequiredRequiredrate of rate of returnreturn
==Risk-freeRisk-free
rate ofrate ofreturnreturn
++ RiskRiskpremiumpremium
++Market riskMarket riskpremiumpremium
Firm-specificFirm-specificrisk premiumrisk premium
Required rate of return
RequiredRequiredrate of rate of returnreturn
==Risk-freeRisk-free
rate ofrate ofreturnreturn
++ RiskRiskpremiumpremium
++Market riskMarket riskpremiumpremium
Firm-specificFirm-specificrisk premiumrisk premium
An investor’s required
An investor’s required
rate of return should
rate of return should
only contain a
only contain a market
market
risk premium
risk premium
Required rate of return

BetaBeta
RequiredRequiredrate ofrate ofreturnreturn
00 11
4%4%
11%11%MarketMarketreturnreturn
Risk-freeRisk-freerate ofrate ofreturnreturn
SMLSML
Known as theKnown as theCAPMCAPM
Graphing this relationship

RRjj = R = Rff + + ββjj ( R ( Rmm – R – Rff ) )
wherewhereRRjj = the required return on security j= the required return on security j
RRff = the risk-free rate of interest= the risk-free rate of interest
ββjj = the beta of security j= the beta of security j
RRmm = the return on the market index= the return on the market index
The CAPM equation

Assumptions
One investment periodRisk averse investorsMany risky assets and devisableRisk free rate is the same for each market playerNo tax and transaction costs involvedAll information is available for freeInvestors' expectations are homogenous

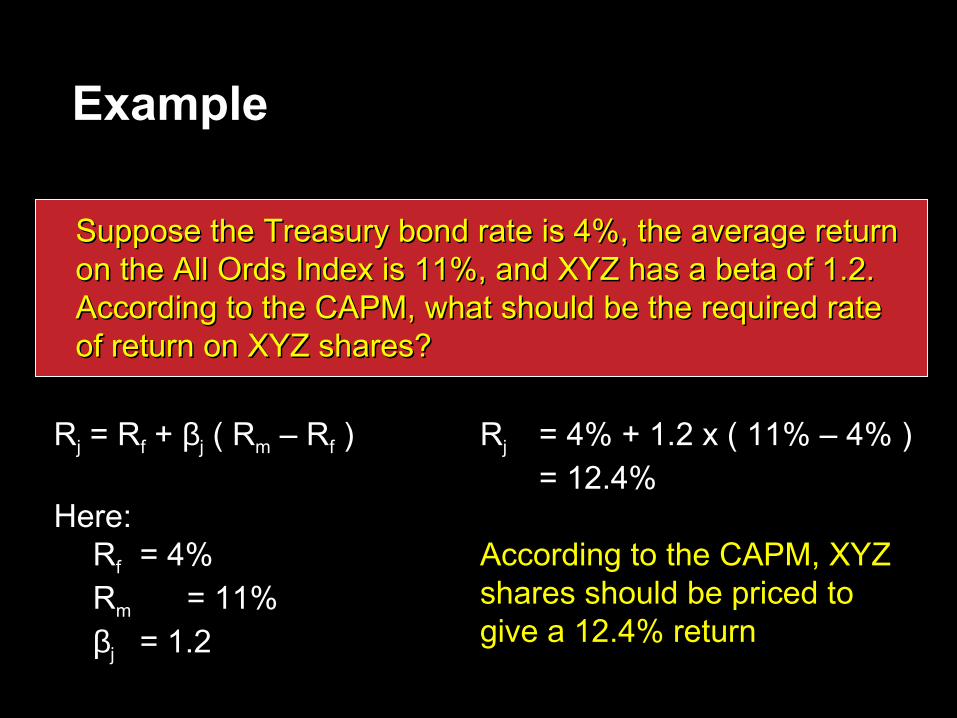
Example
Suppose the Treasury bond rate is 4%, the average return Suppose the Treasury bond rate is 4%, the average return on the All Ords Index is 11%, and XYZ has a beta of 1.2. on the All Ords Index is 11%, and XYZ has a beta of 1.2. According to the CAPM, what should be the required rate According to the CAPM, what should be the required rate of return on XYZ shares?of return on XYZ shares?
RRjj = R = Rff + + ββjj ( R ( Rmm – R – Rff ) )Here: Here:
RRff = 4%= 4%RRmm = 11%= 11%ββjj = 1.2= 1.2
Example
Suppose the Treasury bond rate is 4%, the average return Suppose the Treasury bond rate is 4%, the average return on the All Ords Index is 11%, and XYZ has a beta of 1.2. on the All Ords Index is 11%, and XYZ has a beta of 1.2. According to the CAPM, what should be the required rate According to the CAPM, what should be the required rate of return on XYZ shares?of return on XYZ shares?
RRjj = R = Rff + + ββjj ( R ( Rmm – R – Rff ) )
Here: Here: RRff = 4%= 4%RRmm = 11%= 11%ββjj = 1.2= 1.2
RRjj = 4= 4%% + 1.2 x ( 11 + 1.2 x ( 11%% – 4 – 4%% ) )= 12.4%= 12.4%
According to the CAPM, XYZ According to the CAPM, XYZ shares should be priced to shares should be priced to give a 12.4% returngive a 12.4% return
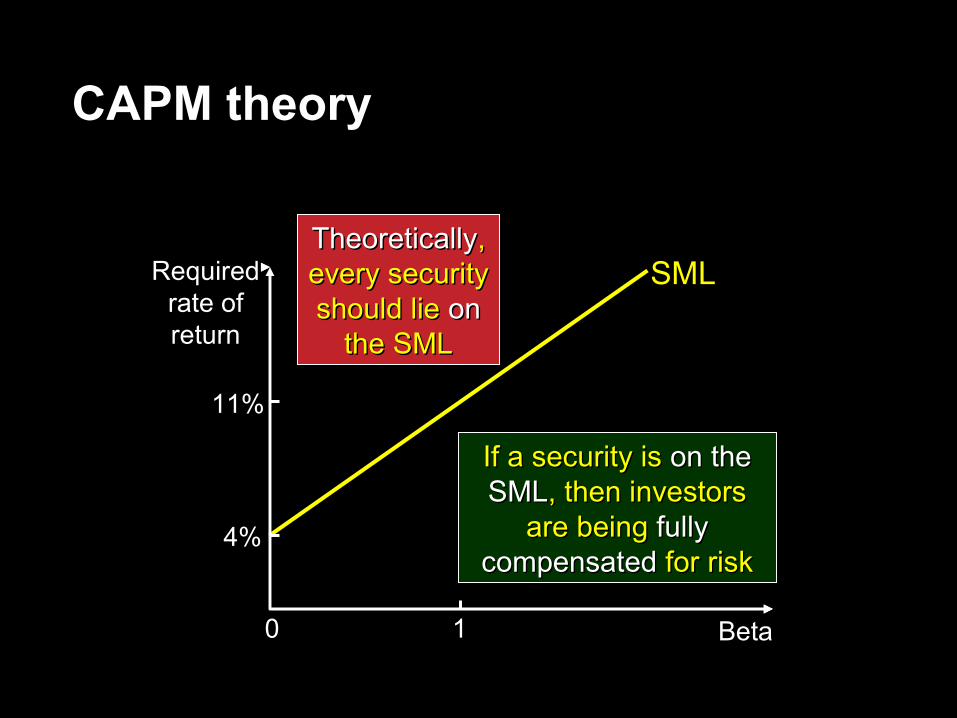
CAPM theory
BetaBeta
RequiredRequiredrate ofrate ofreturnreturn
00 11
4%4%
11%11%
SMLSMLTheoreticallyTheoretically, , every security every security should lie should lie onon
the SMLthe SML
If a security is If a security is on the on the SMLSML, then investors , then investors
are being are being fullyfully compensatedcompensated for risk for risk

CAPM theory
BetaBeta
RequiredRequiredrate ofrate ofreturnreturn
00 11
4%4%
11%11%
SMLSML
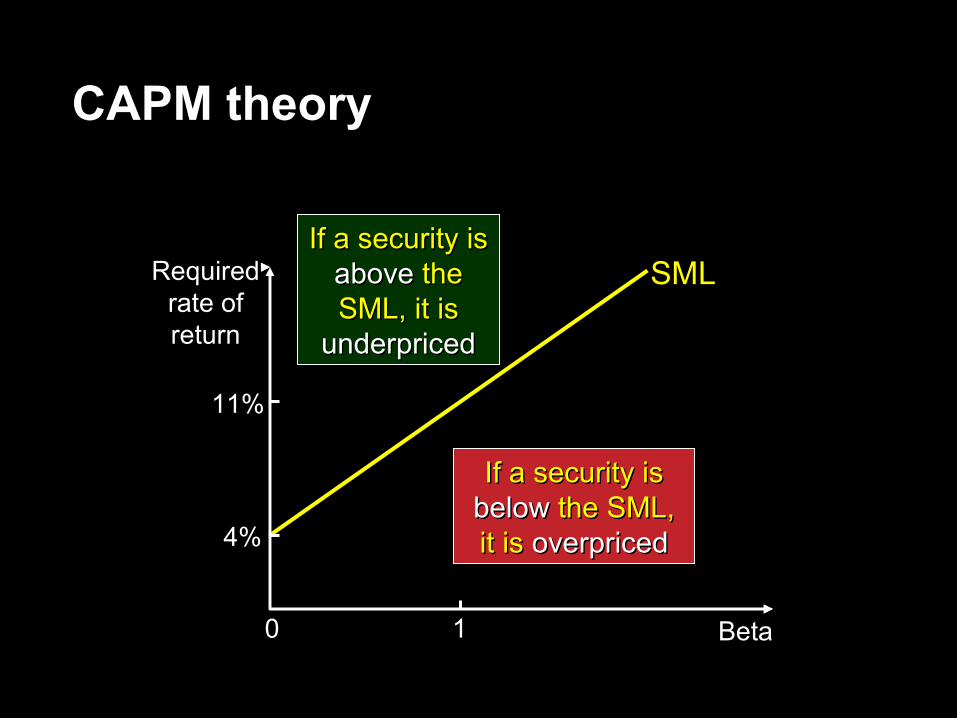
CAPM theory
BetaBeta
RequiredRequiredrate ofrate ofreturnreturn
00 11
4%4%
11%11%
SMLSMLIf a security is If a security is
aboveabove the the SML, it is SML, it is
underpricedunderpriced
If a security is If a security is belowbelow the SML, the SML, it is it is overpricedoverpriced
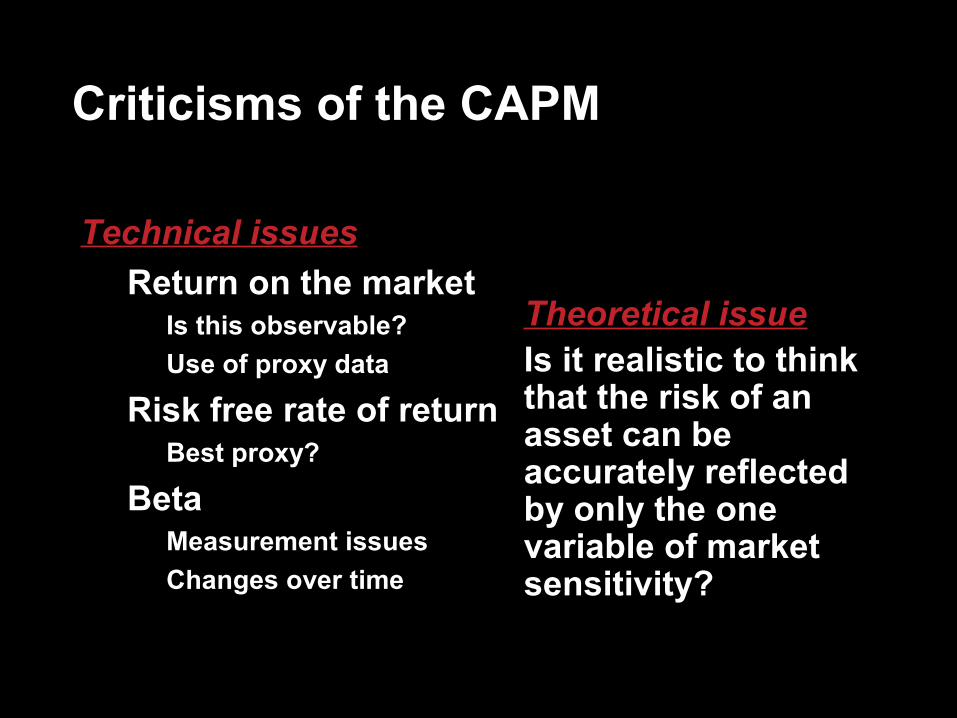
Theoretical issueIs it realistic to think that the risk of an asset can be accurately reflected by only the one variable of market sensitivity?
Technical issues� Return on the market
� Is this observable?� Use of proxy data
� Risk free rate of return� Best proxy?
� Beta� Measurement issues� Changes over time
Criticisms of the CAPM

Theoretical issueIs it realistic to think that the risk of an asset can be accurately reflected by only the one variable of market sensitivity?
Technical issues� Return on the market
� Is this observable?� Use of proxy data
� Risk free rate of return� Best proxy?
� Beta� Measurement issues� Changes over time
AA widely used
widely used
and important
and important
tooltool
Criticisms of the CAPM