presentation 3q17 2t11 - apimec - usiminas - ri mobileri.usiminas.com/enu/5554/apresentacao...
TRANSCRIPT

Apresentação Usiminas
2T11 - APIMEC
Classification of the information: Public
Presentation
3Q17

Agenda
Usiminas and its
business units
Market
Outlook
Financial
Results
Usiminas
Profile
2

Company Profile
3
Complete solution for products and services
Steel company with the largest number of patents rights in Latin America
Largest Research Center in the steel sector in Latin America
First Brazilian steel company to have its quality system certified by ISO 9001 in 1992
First Brazilian steel company and second in the world to achieve the ISO 14001 environmental management
certificate in 1996
Founded of the most enduring environmental education project of the private sector since 1984

Timeline
4
Operation
Start Up
Cosipa
privatization
Launch of ADR I
program on the
OTC Market
(New York)
•Acquisition
of iron ore
mines
•Acquisition
of Zamprogna
•Creation of Soluções Usiminas
•One CNPJ: Usiminas
incorporates Cosipa
•Creation of Mineração Usiminas
•Acquisition of Codeme and
Metform stake
Automotiva
Usiminas
Divestment
•Selling of
Ternium stake
•Joint Mining
Agreements
with MBL e
Ferrous
Entrance of
Ternium / Tenaris
into Usiminas
Control Group
(New shareholders
agreement)
•Usiminas
privatization
•Listing on
BOVESPA
1993
Listing on
LATIBEX
stock
exchange
section
2011
2012 1962
2005
1994
2013
1991
2008
2010
2009
2014
Friables
Project
conclusion
on Mining
(increasing
the capacity
to 12 million
tons/year)
2015
Temporary
shutdown of
the primary
areas in
Cubatão
2016
•R$ 1 billion
capital
increase
•Debt
Renegotiation
2017
R$ 1 billion
Mineração
Usiminas’
capital
reduction

Nippon Group 21.10%
Others 23.19%
Nippon Group 11.31%
Ternium/Tenaris Group 19.76%
Ternium/Tenaris Group 19.81%
Usiminas Pension Fund 4.84%
Total Capital
1,253,079,108
Voting Capital Preferred
ON 56.28% 705,260,684 PN 43.72% 547,818,424
Shareholding Composition
5
Control Group:
45.75% of Voting Capital
Usiminas shares are traded on B3 (São Paulo), on the OTC Market (New York) and on a LATIBEX exchange
section (Madrid).
Nippon Group 0.57%
Others 97.64%
Ternium/Tenaris Group 1.79%

6
Complete Solution for Products and Services
Business Units
Mineração Usiminas
Mining
Steel
Ipatinga Plant
Cubatão Plant
Unigal Usiminas
Steel Processing
Soluções Usiminas
Capital Goods
Usiminas Mecânica
DOWNSTREAM UPSTREAM

Mining
Steel
Steel Processing
Capital Goods
Strategically Located
7

Social and Environmental Initiatives
8
Usiminas Cultural Institute
Usiminas invested over R$260 million,
encouraging around 2,000 social projects First educational institution in Brazil
to obtain ISO 9001
São Francisco Xavier School
Márcio Cunha Hospital
Reference center in healthcare all over Brazil
Xerimbabo Usiminas Project
Promotes protection and environmental education
free of charge for more than 2 million young people

Note: The prices are adjusted by removing the effects of events such as Bonus and Unfolding 9
Shares’ Quotation on B3
R$/share - Up to 09/30/2017
11.62
10.55
12.30
4.02
8.26 8.38 8.83
10.05
10.12 10.52
5.05
1.55
4.10 4.44 4.60
7.82
2012 2013 2014 2015 2016 1Q17 2Q17 3Q17
USIM3 USIM5
Agenda
Usiminas and its
business units
Market
Outlook
Financial
Results
Usiminas
Profile
10

World Crude Steel Market in 2016
Million Tons
Source: World Steel Association/OECD 11
Nominal
Capacity
2,351
Production
1,630
Excess of Capacity 721
24.2
31.3
33.2
42.1
68.6
70.8
78.6
95.6
104.8
808.4
Ukraine
Brazil
Turkey
Germany
South Korea
Russia
USA
India
Japan
China

World Crude Steel Production
1,244 million tons 1,630 million tons
12 Source: World Steel Association
2016 2006
*Except China
+31%
34%
24%
16%
11%
4%
3% 2%
7%
China
Asia and Oceania*
European Union
North America
South America
Europe (others)
Africa
Others
50%
23%
10%
7%
3% 2%
1%
6%

1980 2000 2016
China 34 98 493
South Korea 160 818 1.130
Japan 611 601 493
United States 376 425 283
Germany 469 475 500
Spain 202 435 273
Brazil 101 93 87
Mexico 120 142 198
World Average 152 133 208
Source: World Steel Association
Crude Steel Consumption per Capita
Kg per habitant
13

Brazilian Flat Steel Market
14
Million Tons
Source: Instituto Aço Brasil / Usiminas – Excludes Slabs
14.3
11.9
15.2 14.3
14.9 15.0 14.2
13.4
12.3
9.0
13.1
10.2
14.5 13.7
14.3 14.7
13.2
10.6
9.3
7.7
7%
11%
22%
14% 13% 12%
15% 15%
8%
13%
2008 2009 2010 2011 2012 2013 2014 2015 2016 9M17
Production Consumption Imports

Brazilian Flat Steel Apparent Consumption
Evolution Quarterly - Thousand Tons
15 Source: Usiminas – Commercial Planning
2,272 2,138 2,141 2,209
2,351
162 281 311
302
393 2,434 2,419 2,452 2,511
2,744
3Q16 4Q16 1Q17 2Q17 3Q17
Sales of the Plants Imports Total
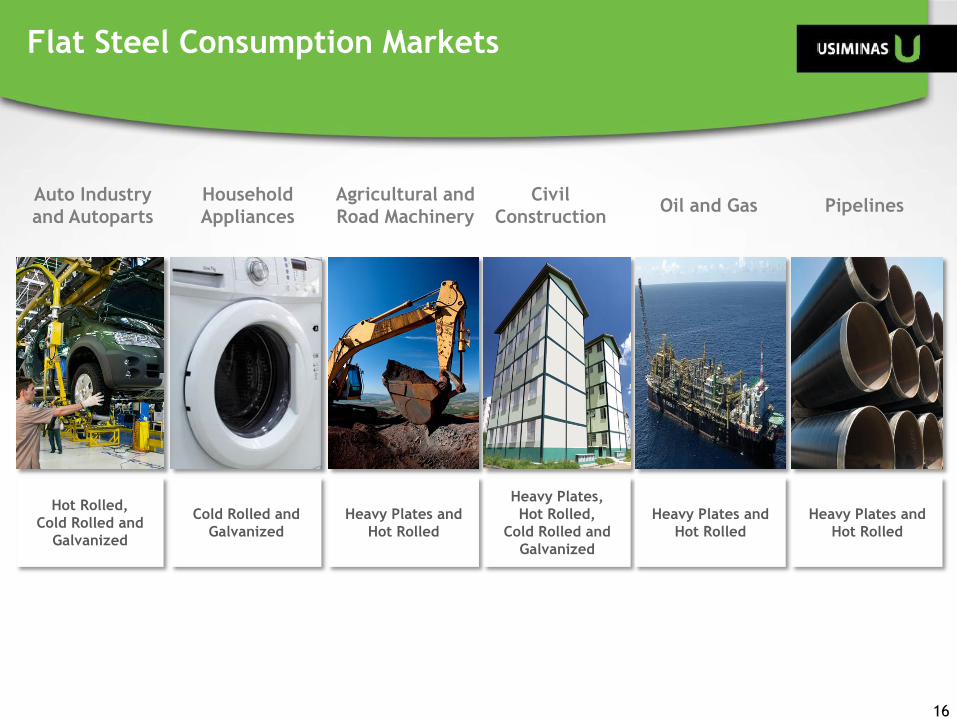
Auto Industry
and Autoparts Oil and Gas Pipelines
Agricultural and
Road Machinery
Heavy Plates and
Hot Rolled
Civil
Construction
Household
Appliances
Cold Rolled and
Galvanized
16
Flat Steel Consumption Markets
Hot Rolled,
Cold Rolled and
Galvanized
Heavy Plates,
Hot Rolled,
Cold Rolled and
Galvanized
Heavy Plates and
Hot Rolled
Heavy Plates and
Hot Rolled

Agenda
Usiminas and its
business units
Market
Outlook
Financial
Results
Usiminas
Profile
17

HDG Placas Laminados a
Quente
Eletrogalvanizados
2,200
Optimized
Rolling
Capacity
4,200 1,900 1,020 350
Cubatão Plant - 1,200 -
3,700 Nominal
Capacity 8,000 2,000* 9,500* 1,050 360
-
Ipatinga Plant 1,050 360 2,500 3,600 1,000 5,000
Flat Steel Capacity of Production
18
Thousand Tons
Slabs Hot Coils Cold Coils Heavy Plates Slab Caster EG
Galvanized
* Temporary shutdown of the primary areas of Cubatão
2,100 ** 1,000** 4,500*
2.300
** Temporary shutdown of the rolling mills

19
Sales Volume
Steel Business Unit – Quarterly - Thousand Tons
814 821 825 840 882
145 71 105
149 134
959
891 930
990 1,016
3Q16 4Q16 1Q17 2Q17 3Q17
Exports Domestic Market

19%
35%
5% 2%
9%
11%
5%
4% 10%
2Q17
20
Steel Business Unit
Exports – Main Markets
42%
30%
6%
5%
4%
4% 3% 2%
2% 1%
1%
3Q17
Argentina
Germany
Italy
Mexico
Portugal
Switzerland
Spain
China
USA
United Kingdom
Belgium
Others
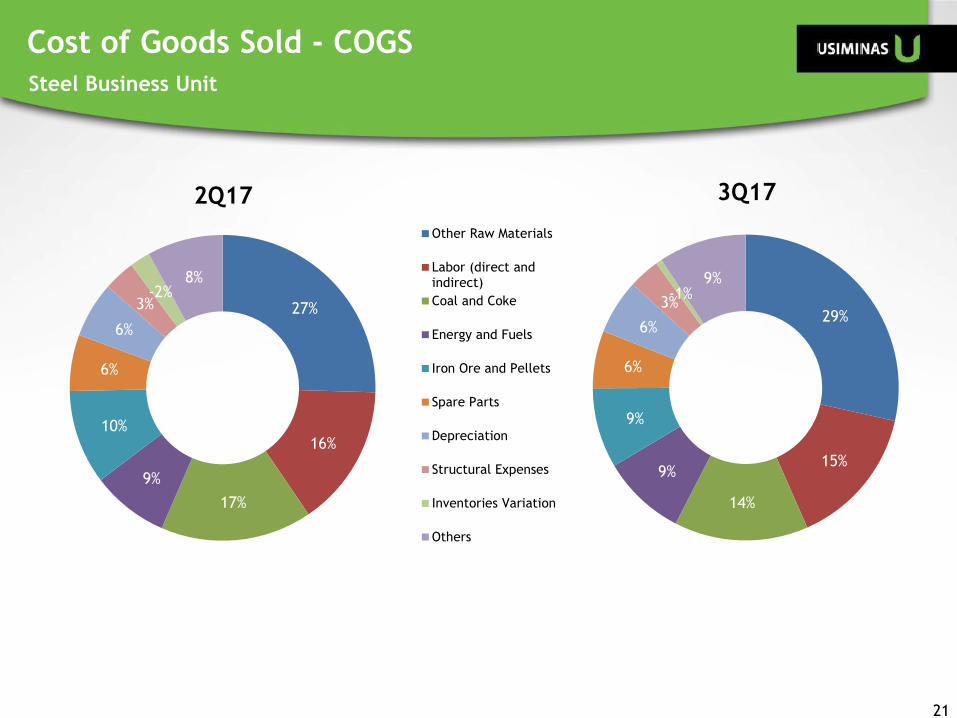
Steel Business Unit
21
Cost of Goods Sold - COGS
29%
15%
14%
9%
9%
6%
6%
3% -1%
9%
27%
16%
17%
9%
10%
6%
6%
3% -2%
8%
2Q17
Other Raw Materials
Labor (direct andindirect)
Coal and Coke
Energy and Fuels
Iron Ore and Pellets
Spare Parts
Depreciation
Structural Expenses
Inventories Variation
Others
3Q17

22 22 22
(71) (13) (34)
(1) (14) (7)
(2) 1 1
(35)
(14)
(23) 18 10
332 342
488 494 448
295 224
465 498 438
3T16 4T16 1T17 2T17 3T17
465
Adjusted EBITDA and EBITDA Margin
Steel Business Unit – Quarterly - R$ Million

Capacity increase to generate finished products
7.2 million t 9.7 million t
(2010) (2014)
Investments
23
Steel Business Unit
Slabs
Heavy Plates
Hot Rolled Cold Rolled
Hot dip galvanized Electrogalvanized

Start up in 2010
Meets the requirements of
Petrobras, focused on pre-
salt, besides the
shipbuilding sector
CLC Technology (Accelerated Cooling Process for Heavy Plates)
Galvanizing Line
Start up in 2011
Double the capacity to 1
million tons /year
Higher expertise in ultra-
resistant steel production
(dual phase)
24
Investments
Steel Business Unit

Start up in 2012
Capacity to process 2.3 million
tons / year
Improving products’ portfolio
(beams, ultra resistant wheels,
higher grades API’s)
Hot Strip Mill
Start up in 2013
Capacity to process 1.7 million
tons / year
Better thickness tolerance,
flatness and surface controls
of materials for wheels, beams
and compressors
Pickling Line
25
Investments
Steel Business Unit

o Met coke with adequate specifications for pig iron production in the blast furnace process
o Started up on May 2015
26
Coke Plant Revamp - Ipatinga
o Reduction of particle emissions, gases and volatile substances
o Coke gas to be used in the operational
facilities of Ipating Mill and electric energy
production
o Coke plant total capacity of 1,1 million
tons/year
Mainly Investment Concluded in 2015
Steel Business Unit

o Located in Serra Azul/Minas Gerais state
o 4 mining sites, acquired from J. Mendes in February, 2008
o Reserves of 2.6 billion tons of iron ore
o It has 20% of voting shares of MRS Logistica, being part of the Control Group
o Retroarea in Itaguaí Port
Description
27
Mining Business Unit
70%
30%
Shareholder Composition Production Capacity
Lump 2 million
Sinter Feed
4 million
Pellet Feed
6 million

MBL
Arcelor Mittal
Ferrous (Santanense)
Comisa Emicon
MMX
Ferrous
MUSA Pau de Vinho
MUSA Leste
Minerita
MUSA Central
MUSA Oeste
Itatiaiuçu
Igarapé São Joaquim De Bicas
Mineração Usiminas
Location
Mining Business Unit
28

Increased capacity from 8 million to 12 million tons / year of iron ore
Iron ore with better quality, higher concentration of iron content and
lower impurity level
Two iron ore processing plants
Friables Project
29
Investments
Mining Business Unit

608 588 615 596 676
181
69 28 33
53
-
- - -
175 789
657 643 629
904
3Q16 4Q16 1Q17 2Q17 3Q17
Sales to Usiminas Sales to 3rd parties - Domestic Market Exports Total30
+44%
Sales Volume
Mining Business Unit – Quarterly - Thousand Tons

Iron Ore Price – PLATTS (62% Fe CFR China)
US$/ton
31
59
71
86
63 71
3Q16 4Q16 1Q17 2Q17 3Q17

13 24
52
226
27
(4)
16%
30% 48%
253%
22%
3T16 4T16 1T17 2T17 3T17
32
25
201
31
Adjusted EBITDA and EBITDA Margin
Mining Business Unit – Quarterly - R$ million

o 6 industrial units in different Brazilian states:
MG, SP, RS, ES and PE
o Processing capacity of 2 million tons of
steel/year
o Net Revenue of R$1.8 billion in 9M17
Description
Soluções Usiminas - Steel Processing
33
Porto Alegre
Guarulhos Taubaté
Suape
Betim
Santa Luzia

22
9
37
27
18
4%
2%
7%
5%
3%
3Q16 4Q16 1Q17 2Q17 3Q17
Reported EBITDA Reported EBITDA Margin
34
Adjusted EBITDA and EBITDA Margin Steel Processing – Quarterly - R$ million

o Facilities in Ipatinga/Minas Gerais state, Congonhas/Minas Gerais state and in
Cubatão/São Paulo state
o Market Segments: Steel Structures, Shipbuilding and Offshore, Oil and Gas, Industrial
Assembly and Equipment, Foundry and Railcars
o Net Revenue of R$237 million in 9M17
Usiminas Mecânica - Capital Goods
Description
35
Brasília 3rd Bridge
35
Steel Structures
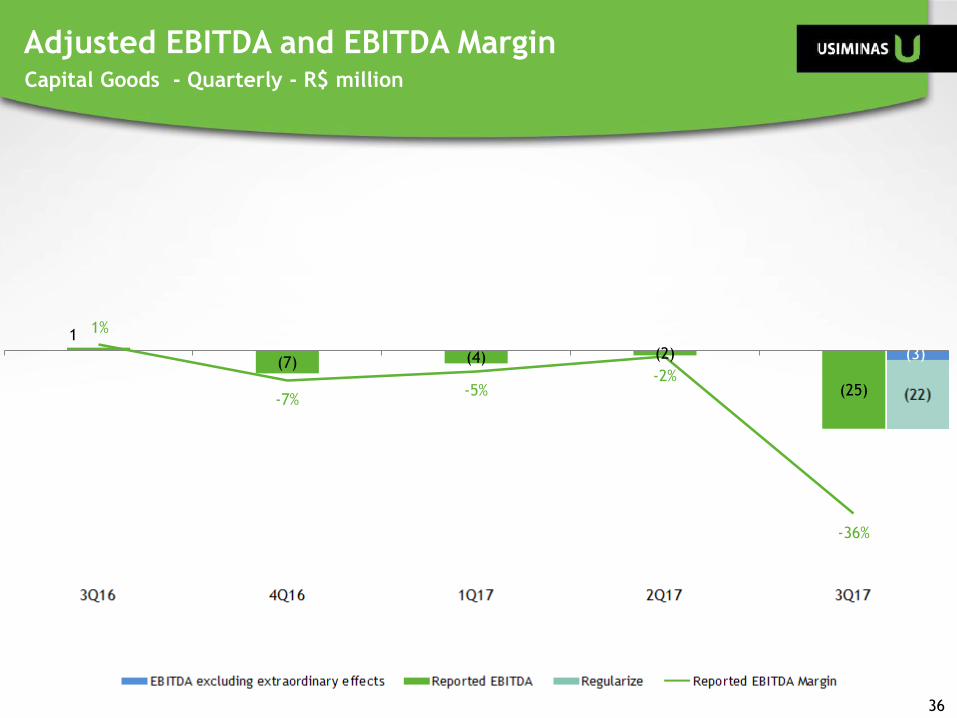
1
(7) (4) (2)
(25)
(3)
1%
-7% -5%
-2%
-36%
3T16 4T16 1T17 2T17 3T17
36
(3)
Adjusted EBITDA and EBITDA Margin Capital Goods - Quarterly - R$ million

Agenda
Usiminas and its
business units
Market
Data
Financial
Results
Usiminas
Profile
37

(40) (33) (4)
(16) (7)
1
(2)
1 1
(36) (12) (23) 19 11
344 349
558 547.0 488
(71)
307 234
533
750
453
3T16 4T16 1T17 2T17 3T17
Regularize PDD Venda de Ativos
Vendas de Energia EBITDA s/ efeitos extraordinários Término de contrato
EBITDA Reportado Margem de EBITDA Reportado38
Adjusted EBITDA and EBITDA Margin Consolidated – Quarterly - R$ million

Debt Profile (Principal) Consolidated - R$ Million
39
1,892
235 16 78
333 608
874 875 875 874
416
247
53 548 15
73
137
199 199 199 199
96
2,138
288 564
93
406
745
1,073 1,074 1,073 1,073
512
Cash 2017 2018 2019 2020 2021 2022 2023 2024 2025 2026
Local Currency Foreign Currency
Duration: R$: 50 months
US$: 43 months

40
2,340 2,257 2,416 1,951 2,138
4,609 4,684 4,464 4,998 4,722
6,948 6,942 6,879 6,950 6,860
3Q16 4Q16 1Q17 2Q17 3Q17
Net Debt Cash Gross Debt
Cash Position and Indebtedness (with interest money)
Consolidated - R$ Million
Duration: R$: 50 months
US$: 43 months

41
CAPEX Consolidated - R$ Million
600
964
622
179 86
317
94
112
34
12
64
52
50
13
11
981
1,110
784
225
109
2013 2014 2015 2016 9M17
Others Mining Steel

42
87 91 93 97 106
3.9% 4.3%
4.0% 3.8% 3.9%
3Q16 4Q16 1Q17 2Q17 3Q17
G&A G&A/Net Revenues
G&A Evolution
Consolidated - R$ million
+10%

2.4 2.5
2.6
3.1 3.1
3Q16 4Q16 1Q17 2Q17 3Q17
43
Working Capital Consolidated - R$ Billion

443
648 648
620 599
3Q16 4Q16 1Q17 2Q17 3Q17
54
44
Inventory
turnover
(days)
Working Capital – Steel Inventories Thousand tons
56 63 65 42

266
259
481
382 358
(34)
283
185
367
107
(107)
(195)
108
176
76
3Q16 4Q16 1Q17 2Q17 3Q17
Gross Profit EBIT Net Income
45
USD/BRL 3.210 3.246 3.259 3.308 3.164 End of period
*
*Reversion of impairment in the Mining Unit of R$357.7 million
** Porto Sudeste Agreement of R$132 million
*** Payment of R$ 39 million related to the Regularize Program
Gross Profit, EBIT and Net Income - Quarterly
Consolidated - R$ million
**
***

1,037
173
487
1,221
523
(3,725)
(364)
658
208
(3,685)
(577)
360
2014 2015 2016 9M17
Gross Profit EBIT Net Income46
USD/BRL 2.656 3.905 3.259 3.164 End of Period
Gross Profit, EBIT and Net Income
Consolidated - R$ million

Income Statement Per Business Unit – R$ million - Quarterly
Note: All intercompany transactions are made at arm´s length basis 47
R$ million
3Q17 2Q17 3Q17 2Q17 3Q17 2Q17 3Q17 2Q17 3Q17 2Q17 3Q17 2Q17
Net Revenue 121 89 2,543 2,458 673 590 74 80 (674) (647) 2,737 2,569
Domestic Market 86 89 2,228 2,100 673 589 74 80 (674) (647) 2,386 2,212
Exports 35 - 315 358 - - - - - - 351 358
COGS (83) (53) (2,209) (2,111) (639) (548) (66) (75) 618 600 (2,379) (2,187)
Gross Profit (Loss) 38 36 334 347 35 41 7 5 (56) (47) 358 382
Operating Income (Expenses) (50) 151 (142) (133) (24) (22) (36) (13) 1 1 (251) (16)
EBIT (12) 187 192 214 10 19 (28) (8) (55) (46) 107 367
Adjusted EBITDA 27 226 438 498 18 27 (25) (2) (5) 0 453 750
Adj.EBITDA Margin 22% 253% 17% 20% 3% 5% -35% -2% 1% 0% 17% 29%
*Consolidated 70% of Unigal
Income Statement per Business Units - Non Audited - Quarterly
Mining ConsolidatedAdjustmentCapital GoodsSteel
ProcessingSteel*

Income Statement Per Business Unit – R$ million – 9M
Note: All intercompany transactions are made at arm´s length basis 48
R$ million
9M17 9M16 9M17 9M16 9M17 9M16 9M17 9M16 9M17 9M16 9M17 9M16
Net Revenue 319 288 7,219 5,560 1,830 1,373 237 462 (1,948) (1,348) 7,657 6,334
Domestic Market 283 214 6,306 4,812 1,829 1,372 236 462 (1,948) (1,348) 6,707 5,511
Exports 35 74 913 748 1 1 1 - - - 950 823
COGS (189) (248) (6,118) (5,355) (1,699) (1,278) (224) (427) 1,793 1,201 (6,437) (6,106)
Gross Profit (Loss) 130 39 1,102 205 131 95 13 35 (154) (147) 1,221 228
Operating Income (Expenses) 59 (136) (493) (631) (72) (77) (59) (35) 3 4 (562) (875)
EBIT 188 (97) 609 (426) 59 18 (46) 1 (151) (143) 658 (648)
Adjusted EBITDA 304 22 1,401 391 83 40 (31) 19 (21) (45) 1,735 426
Adj.EBITDA Margin 95% 8% 19% 7% 5% 3% -13% 4% 1% 3% 23% 7%
*Consolidated 70% of Unigal
Income Statement per Business Units - Non Audited - 9M17
Mining Steel* Steel Processing ConsolidatedCapital Goods Adjustment
Declarations relative to business and perspectives of the Company, operating
and financial results and projections, and references to the growth of the
Company constitute mere forecasts and were based on Management´s
expectations in relation to future performance, these expectations are highly
dependent on market behavior, on Brazil´s economic situation, on the industry
and on international markets, and are therefore subject to change.
ADR
Level I
www.usiminas.com/ri
Leonardo Karam Rosa IR Manager
Phone: 55-31-3499.8550