presentation at the workshop economics of nuclear dr ... · dr tobias bischof-niemz chief engineer...
TRANSCRIPT

Dr Tobias Bischof-Niemz
Chief Engineer
Can renewables supply baseload?
Presentation at the workshop Economics of Nuclear
Dr Tobias Bischof-Niemz, CSIR Energy Centre Manager
Johannesburg, 9 March 2016
Cell: +27 83 403 1108
Email: [email protected]

2
Dr Tobias Bischof-Niemz
Head of CSIR’s Energy Centre
Professional Experience
• Member of the Ministerial Advisory Council on Energy (MACE)
• Extraordinary Associate Professor at Stellenbosch University
• Jul 2014 – today: Centre Manager at the CSIR, responsible to lead the
establishment of an integrated energy research centre
• 2012 – 2014: PV/Renewables Specialist at Eskom in the team that developed the IRP;
afterwards 2 months contract work in the DoE’s IPP Unit on gas, coal IPP and rooftop PV
• 2007 – 2012: Senior consultant (energy system and renewables expert) at
The Boston Consulting Group, Berlin and Frankfurt, Germany
Education
• Master of Public Administration (MPA) on energy and renewables policies
in 2009 from Columbia University in New York City, USA
• PhD (“Dr.-Ing.”) in 2006 in Automotive Engineering from TU Darmstadt, Germany
• Mechanical Engineering at Technical University of Darmstadt,
Germany (Master – “Dipl.-Ing.” in 2003) and at UC Berkeley, USA

3
0.4
2.2
0.7 0.5
0.4 0.9
0.7
0.7
0.7
0.3
0.2
R/kWh
Diesel (OCGT)
3.1
0.1
Gas (OCGT)
2.2
1.1-1.4
0.1
Mid-merit Coal
1.3
0.2
Gas (CCGT)
1.3
0.8
0.1
Wind
Bid Window 1
0.0
Solar PV
Bid Window 1
0.1
Nuclear
0.8-1.1
1.1
0.10.1
Baseload Coal
0.1
Consequence of renewables’ cost reduction for South Africa:
Solar PV and wind are the cheapest new-build options per kWh today
Renewables Conventional new-build options
50%92% 50% 10%Assumed load factor �
Fuel cost @
92 R/GJ
Fuel cost @
110-140 R/GJ
10%
Lifetime cost
per energy unit
85%
Fuel (and variable O&M)
Fixed O&M
Capital
Note: Changing full-load hours for conventionals drastically changes the fixed cost components per kWh (lower full-load hours � higher capital costs and fixed O&M costs per MWh);
Assumptions: average efficiency for CCGT = 50%, OCGT = 35%; coal = 37%; nuclear = 33%; IRP cost from Jan 2012 escalated with CPI to Jan 2016; assumed EPC CAPEX inflated by 10% to convert
EPC/LCOE into tariff; Sources: IRP Update; REIPPPP outcomes; StatsSA for CPI; Eskom financial reports on coal/diesel fuel cost; CSIR analysis
0.80.6
CAPEX lower
than IRP

4
Thought experiment: Build a new power system from scratch
Base load: 8 GW
� Annual demand: 70 TWh/yr (~30% of today’s South African demand)
Can a blend of wind and solar PV, mixed with flexible dispatchable power to fill the gaps supply this?
If yes, at what cost?
Assumptions/approach
• 15 GW wind @ 0.65 R/kWh (Bid Window 4 average tariff in Apr-2015-Rand)
• 7 GW solar PV @ 0.82 R/kWh (Bid Window 4 average tariff in Apr-2015-Rand)
• 8 GW flexible power generator to fill the gaps @ 2.0 R/kWh
• Hourly solar PV and wind data from recent CSIR study, covering the entire country
• Hourly simulation of supply structure for an entire year
Sources: CSIR analysis

5
Side note: System load does not have “baseload” profileActual system load in the South African power system on 28 July 2015
30
15
35
5
25
10
20
0
GW
24h006h00 18h0012h00
Hour of the day
System Load
Sources: CSIR analysis

6
Thought experiment: assumed 8 GW of true baseload
0
1
2
3
4
5
6
7
8
9
10
11
12
13
14
15
16
17
GW
24h006h00 18h0012h00
Hour of the day
System Load
Sources: CSIR analysis

7
A mix of solar PV, wind and flexible power can supply this baseload
demand in the same reliable manner as a base-power generator
0
1
2
3
4
5
6
7
8
9
10
11
12
13
14
15
16
17
GW
Hour of the day
12h006h00 24h0018h00
Residual Load (flexible power)
Wind
Solar PV
Excess solar PV/wind
energy � curtailment
assumed (no value)
Sources: CSIR analysis

8
On a low-sun, low-wind day the residual load is largeSimulated solar PV and wind power output for a 7 GW PV and 15 GW wind fleet on a day in May
0
1
2
3
4
5
6
7
8
9
10
11
12
13
14
15
16
17
12h00
Hour of the day
24h0018h006h00
GW
Wind
Residual Load (flexible power)
Solar PV
Sources: CSIR analysis
9
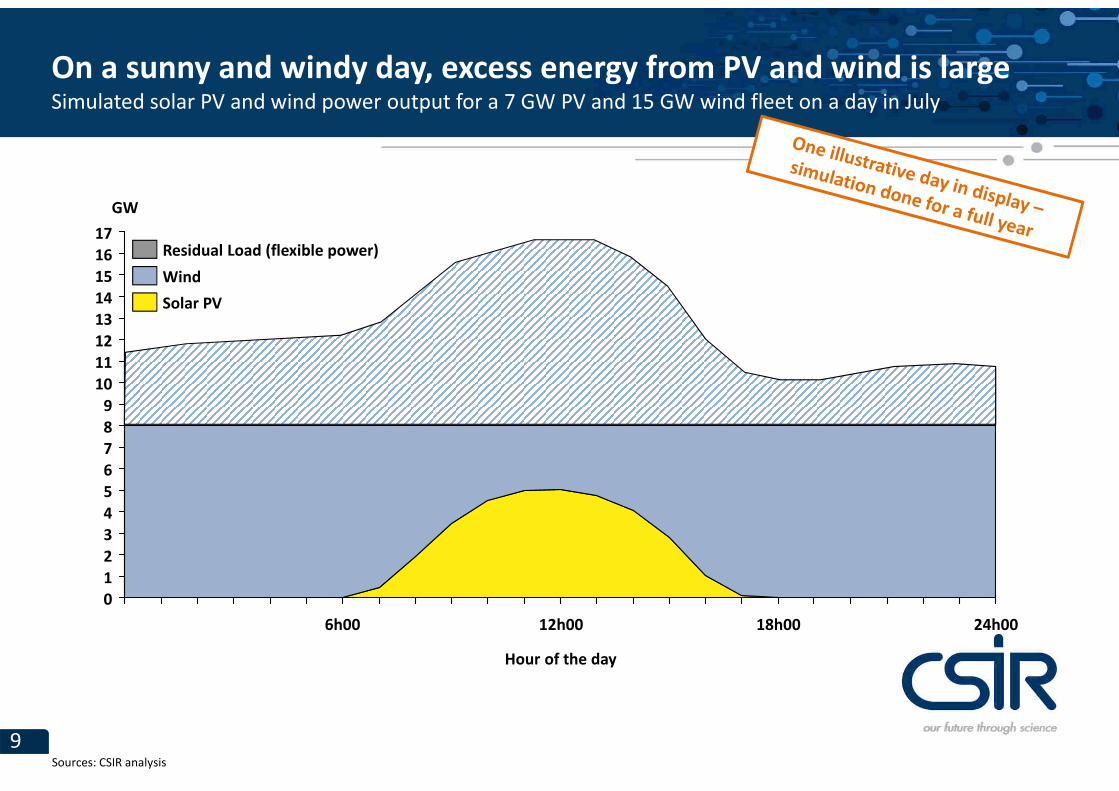
On a sunny and windy day, excess energy from PV and wind is largeSimulated solar PV and wind power output for a 7 GW PV and 15 GW wind fleet on a day in July
0
1
2
3
4
5
6
7
8
9
10
11
12
13
14
15
16
17
12h00
Hour of the day
24h0018h006h00
GW
Wind
Residual Load (flexible power)
Solar PV
Sources: CSIR analysis

10
On average, solar PV and wind supplies 82% of the total demandAverage hourly solar PV and wind power supply calculated from simulation for the entire year
0
1
2
3
4
5
6
7
8
9
10
11
12
13
14
15
16
17
12h00
Hour of the day
24h0018h006h00
GW
Wind
Residual Load (flexible power)
Solar PV
Sources: CSIR analysis
8 GW flexible fleet
runs at annual average
load factor of 19%

11
The mix of solar PV, wind and flexible power costs 1 R/kWh – same
level as alternative new-build options that supply baseload
System Load Solar PV Wind
70
Residual
Load (flexible
power)
13
1
13
12
TWh/yr
6
52
46
Wind
Excess PV/wind
Solar PV
13 TWh/yr * 0.82 R/kWh
+ 52 TWh/yr * 0.65 R/kWh
+ 13 TWh/yr * 2.00 R/kWh
_______________________
70 TWh/yr
= 1 R/kWh
• No value given to 7 TWh/yr
of excess energy (bought and “thrown away”)
• Bid Window 4 costs for PV/wind
(no further cost reduction assumed)
• Very high cost for flexible power of
2.0 R/kWh assumed
Sources: CSIR analysis
12
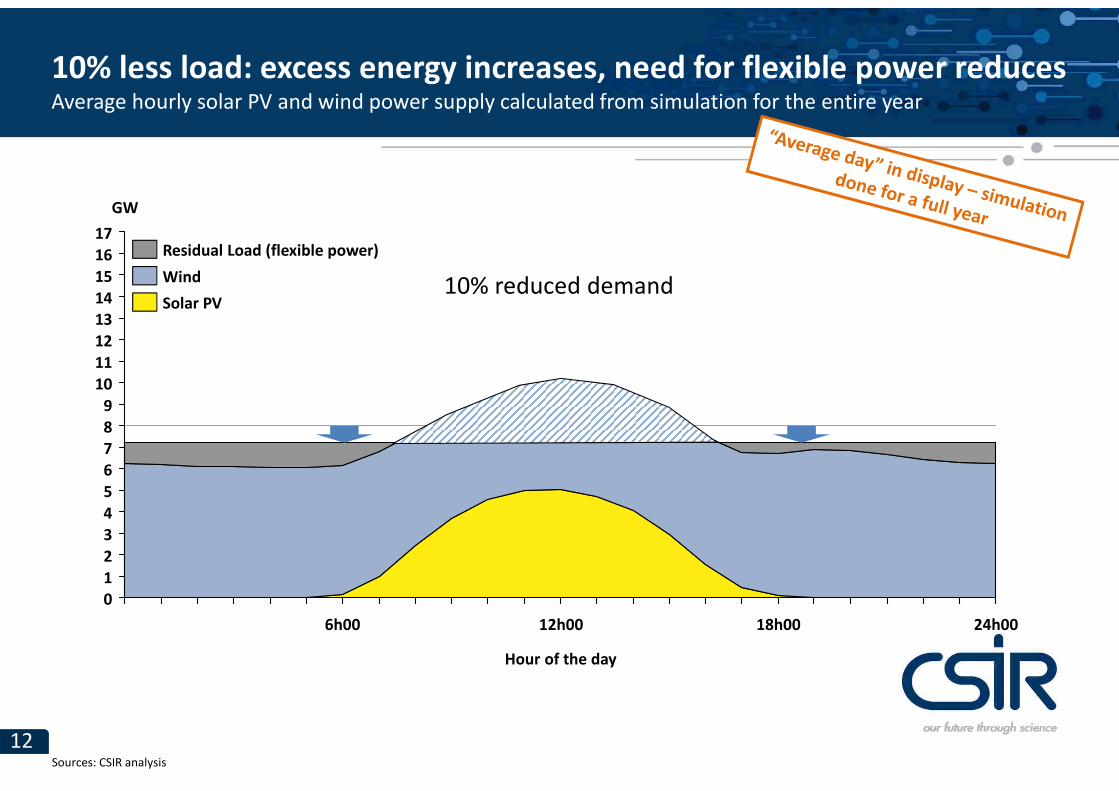
10% less load: excess energy increases, need for flexible power reducesAverage hourly solar PV and wind power supply calculated from simulation for the entire year
0
1
2
3
4
5
6
7
8
9
10
11
12
13
14
15
16
17
GW
Hour of the day
24h0018h0012h006h00
Residual Load (flexible power)
Wind
Solar PV10% reduced demand
Sources: CSIR analysis

13
Low sensitivity to changes in demand (-10%): unit cost stays constant
Wind
63
Residual
Load (flexible
power)
52
43
8
Solar PV
13
11
2
System Load
9
TWh/yr
Solar PV
Wind
Excess PV/wind
13 TWh/yr * 0.82 R/kWh
+ 52 TWh/yr * 0.65 R/kWh
+ 13 9 TWh/yr * 2.00 2.10 R/kWh
_______________________
70 63 TWh/yr
= 1 R/kWh
• No value given to 7 TWh/yr
of excess energy (bought and “thrown away”)
• Bid Window 4 costs for PV/wind
(no further cost reduction assumed)
• Very high cost for flexible power of
2.0 R/kWh assumed
10% reduced demand
Sources: CSIR analysis

14
Thank you!