presentation by progress on intra-african trade june, 2011 emmanuel j. chinyama eca 7 th session of...
TRANSCRIPT
Presentation By
Progress on Intra-African Trade June, 2011
Emmanuel J. Chinyama
ECA
7th Session of the Committee on Trade, Regional Cooperation and Integration2 - 3 June 2011
Addis Ababa, Ethiopia

Outline of the Presentation
Introduction
Direction of Africa’s trade with major trading partners
Direction of trade within African regions
Trade performance by countries
Intra-African trade potentials
Challenges of Intra-African trade
Conclusion and policy recommendations

Introduction
The significance of trade to economic growth.
Regional Integration will strengthen Africa’s economic
independence and empowerment with respect to the rest
of the world.
The role of regional integration in promoting trade in
Africa.
Focus of the presentation.
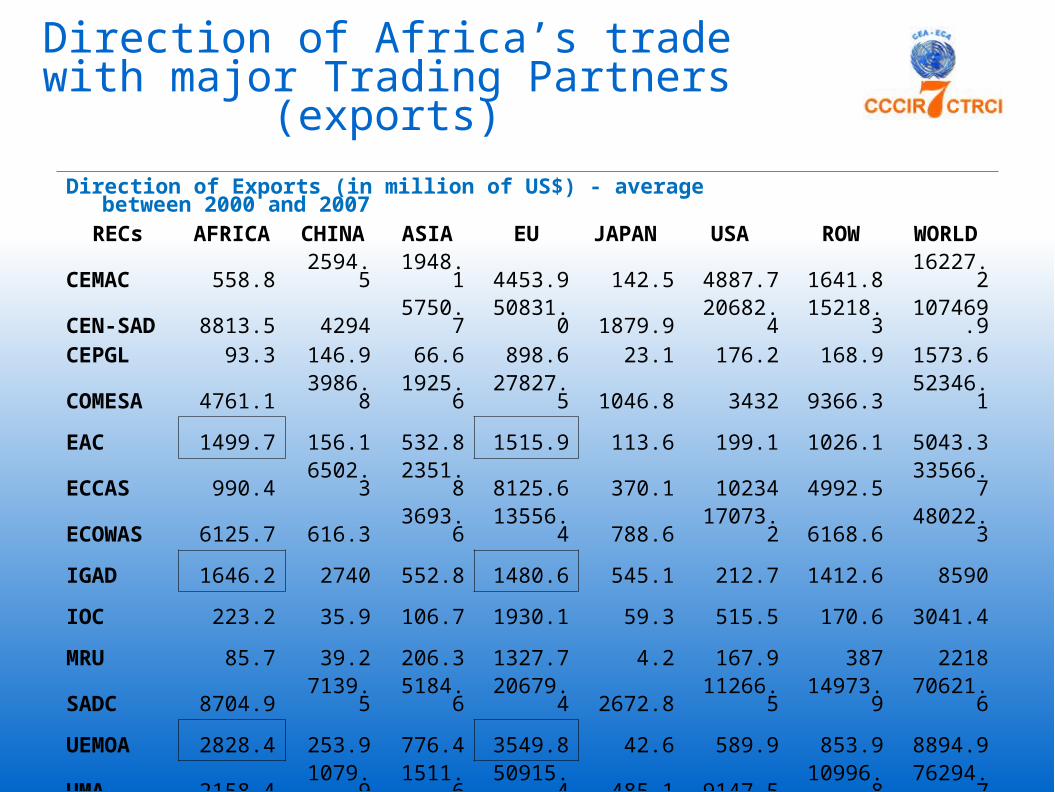
Direction of Africa’s trade with major Trading Partners (exports)
Direction of Exports (in million of US$) - average between 2000 and 2007
RECs AFRICA CHINA ASIA EU JAPAN USA ROW WORLD
CEMAC 558.8 2594.5 1948.1 4453.9 142.5 4887.7 1641.8 16227.2
CEN-SAD 8813.5 4294 5750.7 50831.0 1879.9 20682.4 15218.3 107469.9CEPGL 93.3 146.9 66.6 898.6 23.1 176.2 168.9 1573.6
COMESA 4761.1 3986.8 1925.6 27827.5 1046.8 3432 9366.3 52346.1
EAC 1499.7 156.1 532.8 1515.9 113.6 199.1 1026.1 5043.3
ECCAS 990.4 6502.3 2351.8 8125.6 370.1 10234 4992.5 33566.7
ECOWAS 6125.7 616.3 3693.6 13556.4 788.6 17073.2 6168.6 48022.3
IGAD 1646.2 2740 552.8 1480.6 545.1 212.7 1412.6 8590
IOC 223.2 35.9 106.7 1930.1 59.3 515.5 170.6 3041.4
MRU 85.7 39.2 206.3 1327.7 4.2 167.9 387 2218
SADC 8704.9 7139.5 5184.6 20679.4 2672.8 11266.5 14973.9 70621.6
UEMOA 2828.4 253.9 776.4 3549.8 42.6 589.9 853.9 8894.9
UMA 2158.4 1079.9 1511.6 50915.4 485.1 9147.5 10996.8 76294.7

Share of Import Sources (2000-2007)
REC AFRICA CHINA ASIA EU JAPAN USA ROW WORLD
CEMAC 14 5 7 52 2 11 9 100CEN-SAD 9 8 10 41 3 7 22 100
CEPGL 42 4 3 34 8 4 5 100COMESA 12 8 11 31 4 8 27 100
EAC 13 7 13 21 5 5 36 100
ECCAS 16 6 10 45 2 10 10 100ECOWAS 13 9 15 33 4 6 20 100
IGAD 12 11 14 20 4 5 34 100
IOC 14 10 19 29 3 3 22 100
MRU 4 5 35 21 12 2 21 100
SADC 12 8 11 36 5 8 20 100
UEMOA 24 10 9 39 1 4 14 100
UMA 4 5 5 59 2 4 20 100
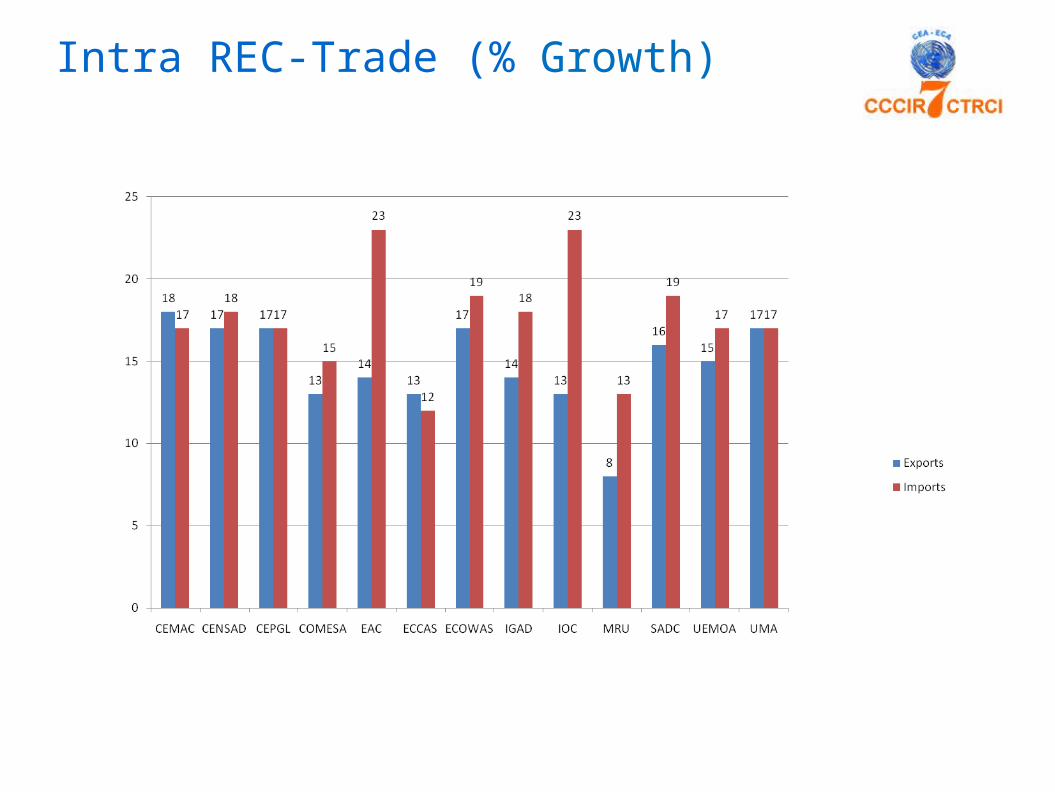
Intra REC-Trade (% Growth)
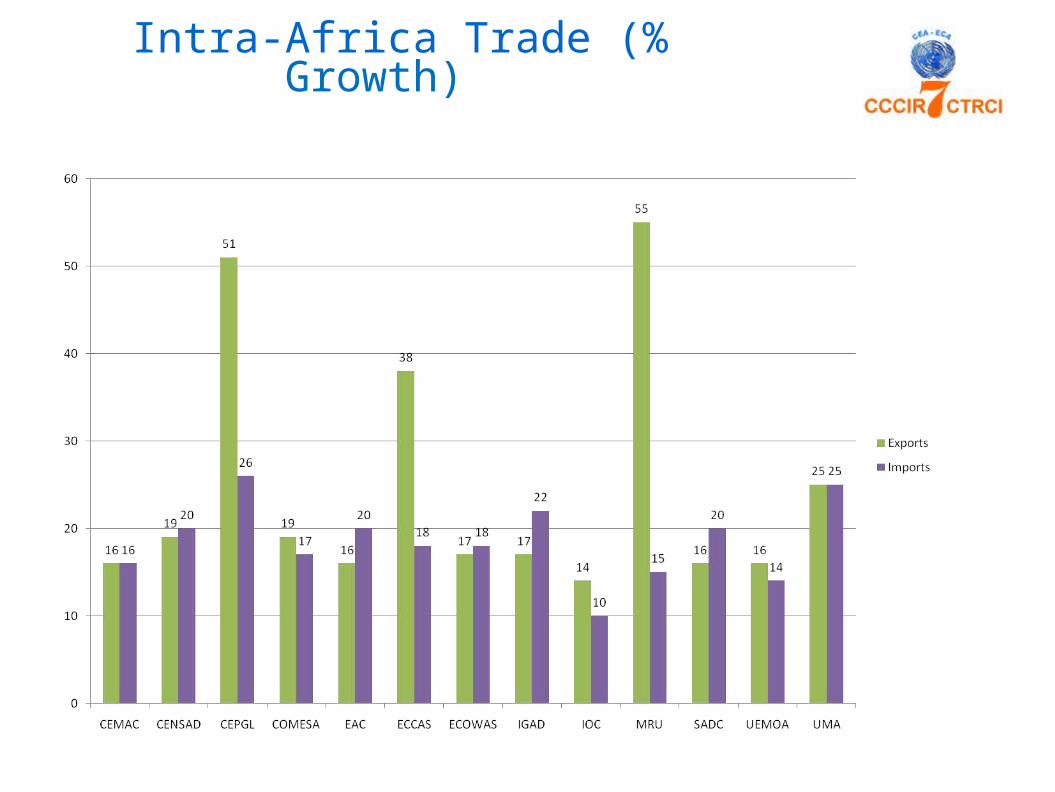
Intra-Africa Trade (% Growth)
Intra-African trade potentials
Africa trades more with the rest of the world than it does
with itself.
Rich endowments among African countries
Africa has a large population of about one billion people.
Reforms which are key to boost trade.
Diversification of finished products.

Intra-African trade potential
Effective implementation of decisions agreed at continental
level.
Increased demand by the emerging economies such as China,
India, Brazil, and others.
Rich fertile soil for agricultural production.

Challenges Limiting the Potential of Intra-African Trade
Lack of diversification and competitiveness.
The nature of African economies.
Weak trade-related infrastructure.
Multiplicity and inconvertibility of currencies.
Delays at customs which, on average, are longer than in the rest of
the world.
A large proportion of African landlocked countries.
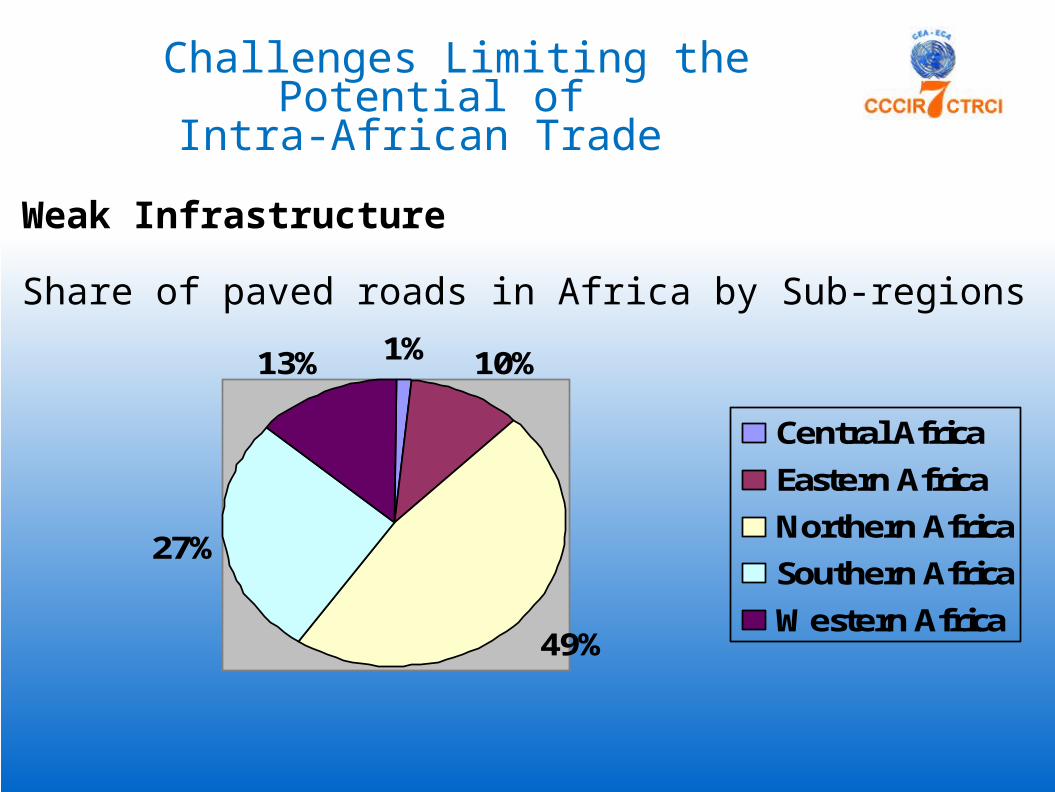
Challenges Limiting the Potential of Intra-African Trade
Weak Infrastructure
Share of paved roads in Africa by Sub-regions1% 10%
49%
27%
13%
Central Africa
Eastern Africa
Northern Africa
Southern Africa
Western Africa

Conclusion
There is a potential for intra-Africa trade to improve.
There is need to address the supply constraints in order to make
Africa’s products competitive;
There is need to accelerate trade reforms, including exports
diversification;
Deepening of regional integration and accelerating intra-Africa
trade will need strong commitmenst from the Member States.

Conclusion
High trade costs prevent many African countries
to the full realization of gains from the
globalization.
Members States should continue their reforms
including export diversification.
THANK YOU FOR YOUR ATTENTION