presentation examples for class 2 mkt size and hypotheses testing
TRANSCRIPT

Presentation examples used in Class 2 - Market Size and
Hypothesis Testing
The Lean LaunchPad
07/02/12

Market Size
How Big is This Opportunity?

Market/Opportunity Analysis
How Big is It?: Market/Opportunity Analysis– Identify a Customer and Market Need– Size the Market– Competitors– Growth Potential
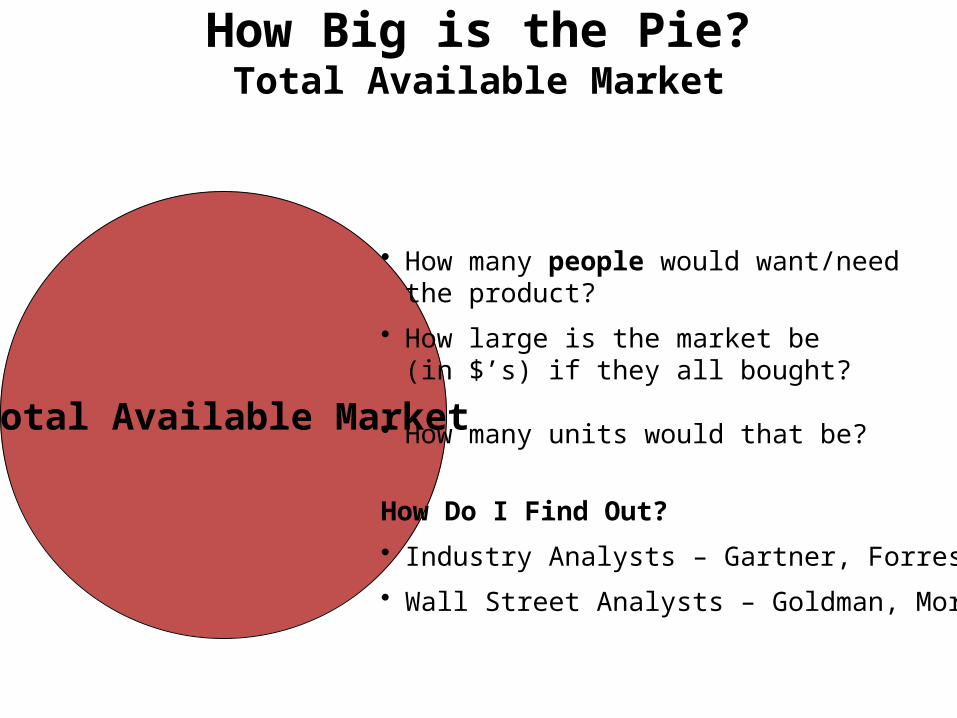
How Big is the Pie?Total Available Market
Total Available Market
• How many people would want/need
the product?
• How large is the market be (in $’s) if they all bought?
• How many units would that be?
How Do I Find Out?
• Industry Analysts – Gartner, Forrester
• Wall Street Analysts – Goldman, Morgan

How Big is My Slice?Served Available Market
• How many people need/can use product?
• How many people have the money to buy the product
• How large would the market be (in $’s) if they all bought?
• How many units would that be?
How Do I Find Out?• Talk to potential customers
Served Available
Market
TotalAvailableMarket

How Much Can I Eat?Target Market
• Who am I going to sell to in year 1, 2 & 3?
• How many customers is that?
• How large is the market be (in $’s) if they all bought?
• How many units would that be?
How Do I Find Out?• Talk to potential customers
• Identify and talk to channel partners
• Identify and talk to competitors
TotalAvailableMarket Target
Market
ServedAvailableMarket

Market Size: Summary
• Market Size Questions:– How big can this market be? – How much of it can we get?– Market growth rate– Market structure (Mature or in flux?)
• Most important: Talk to Customers and Sales Channel• Next important: Market size by competitive approximation
– Wall Street analyst reports are great• And : Market research firms Like Forester, Gartner

Market Size Examples
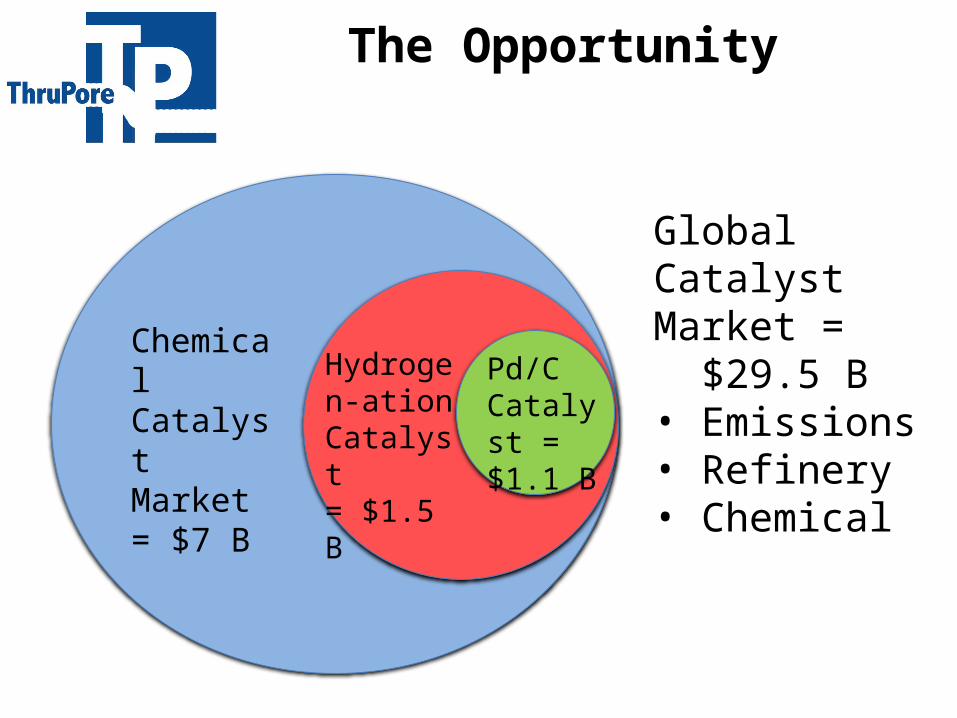
The Opportunity
Chemical Catalyst Market= $7 B
Hydrogen-ation Catalyst= $1.5 B
Pd/C Catalyst = $1.1 B
Global Catalyst Market = $29.5 B• Emissions• Refinery• Chemical


MARKET SIZE
Giant Markets > Meat: $160B / Snacks: $70B > Meat Snacks: $4B
Varying Growth Rates> Meat: + 5%> Snacks: + 15%> Jerky: + 5%
Mega Consumer Trends Converging
> Healthy, More Flavorful, Higher Quality
Snacks Driven by Innovation / News
Meat Snacks / Jerky Generally Sleepy> Limited Innovation> “Gut Stuffer” Image
Change Underway Driven by New Entrants
> All-Natural> 10% Growth Latest 52 Weeks Nielsen F/D/M
2009 US Snack Food
A m e r i ca ns L o v e to Ea t M e a t a nd S n a c k
Retail Sales
Source: US Package Facts
Sweet$35B
Salty$30B
Meat$4B
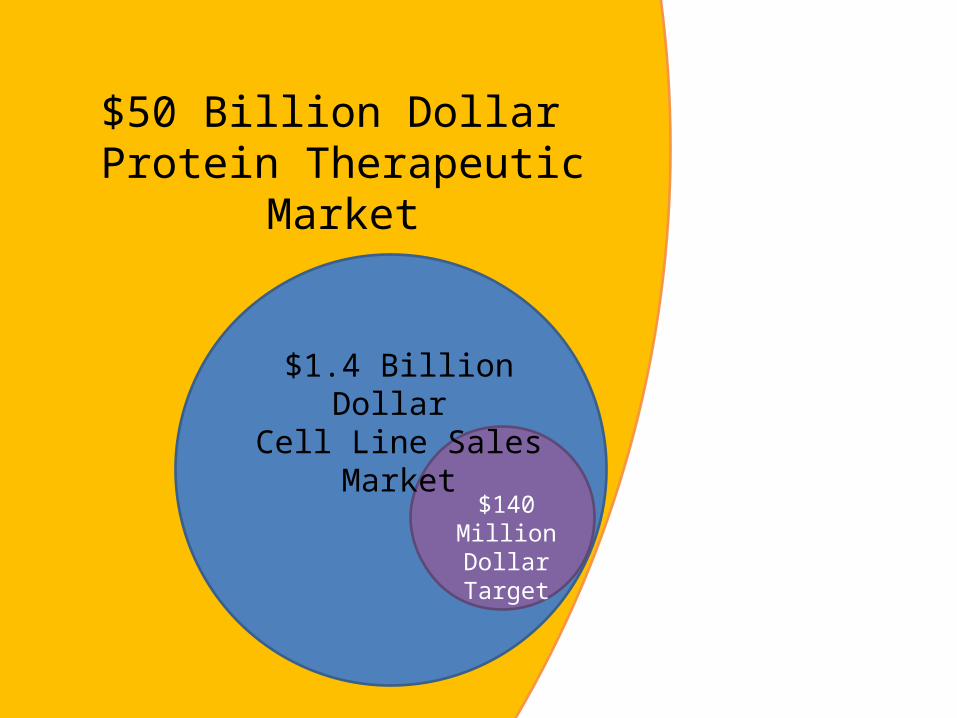
$50 Billion Dollar Protein Therapeutic Market
$1.4 Billion Dollar Cell Line Sales Market
$140 Million Dollar Target


TAM: $6 B/yr>100K systems
worldwide
SAM: $1.5B/yrAssumptions: 25K pivots w/ 1 sensor/acre
(125 sensors/pivot)
Target Market: $50-75M/yrAssumptions: 3-5% licensingRecurring consumable costs
would add to revenue
Nitrate Sensor Market

Market size - Landlords & Rental Units
Rental Real Estate is the Largest “Mom and Pop” business in America: The vast majority of properties are owned by a single individual that owns only one property.
Source: US census data
2.20
0.46 0.06
Units by Landlord Portfolio Size in USA (millions)
Small: 1 to 4
Medium: 5 to 49
Large: 50 or More
Small: 1 to 4 Medium: 5 to 49
Large: 50 or More
0%
10%
20%
30%
40%
50%
60%
70%
80%
90%
100% 92%
77%
32%
% of Units, by Landlord Portfolio Size, Owned by a Single Individual
50% of the “Small” landlords own just one unit.

The market size for metastatic cancer diagnostics in the U.S. is estimated to be $805M p.a.
CanScan
U.S. population size
U.S. incidence of all cancers
% diagnosed with regional or distant cancers
Patients w/ regional or distant cancers
Cost of diagnosis and monitoring (annually)
Methodology: Value:
Cancers that spread to local or distant lymph nodes or organs
Weighted avg. patient cost p.a. for imaging procedures (2008)
x
=
=
x
U.S. Census Bureau estimate
Source:
ACS Cancer Facts & Figures 2011
NCI SEER 2011 data
JAMA. 2010; 303(16):1625-1631
x
Market size for metastatic cancer Dx / monitoring
=
Total U.S. population in 2012
Explanation:
313M
Treatment is typically given in the first year following diagnosis
0.512%
Total U.S. cancer incidence 1.6 M
39.4%
628,420
$1,285
$805M


20
Linear Lighting Market Size
20


Hypothesis TestingExamples
23
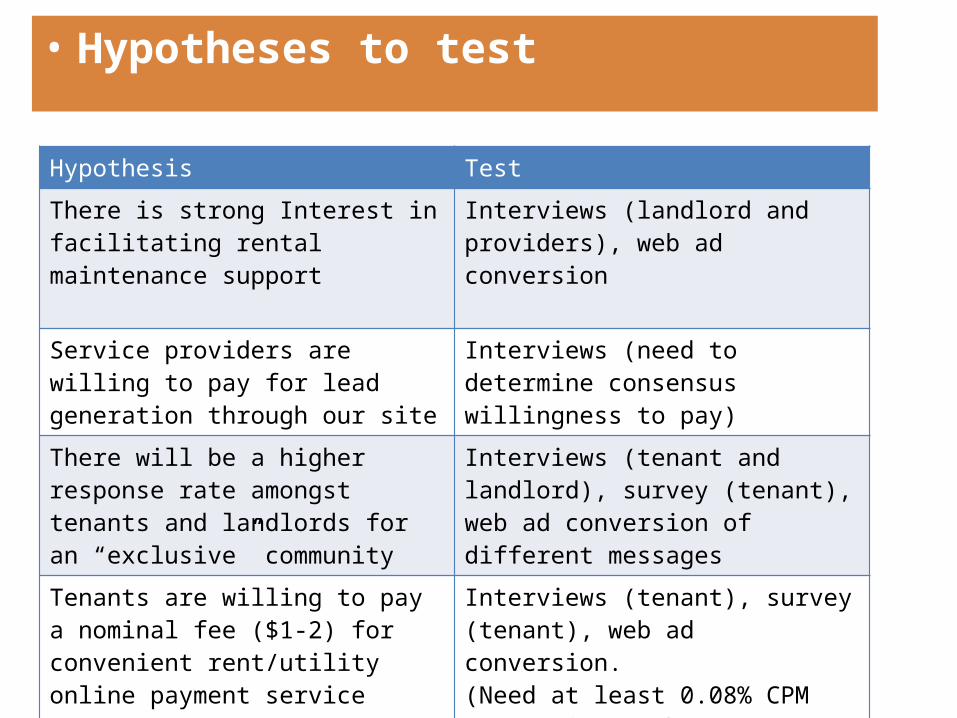
• Hypotheses to test
Hypothesis Test
There is strong Interest in facilitating rental maintenance support
Interviews (landlord and providers), web ad conversion
Service providers are willing to pay for lead generation through our site
Interviews (need to determine consensus willingness to pay)
There will be a higher response rate amongst tenants and landlords for an “exclusive” community
Interviews (tenant and landlord), survey (tenant), web ad conversion of different messages
Tenants are willing to pay a nominal fee ($1-2) for convenient rent/utility online payment service
Interviews (tenant), survey (tenant), web ad conversion.(Need at least 0.08% CPM conversion to be profitable)
Real Estate agents are willing to help push this offering to their customers
Interviews


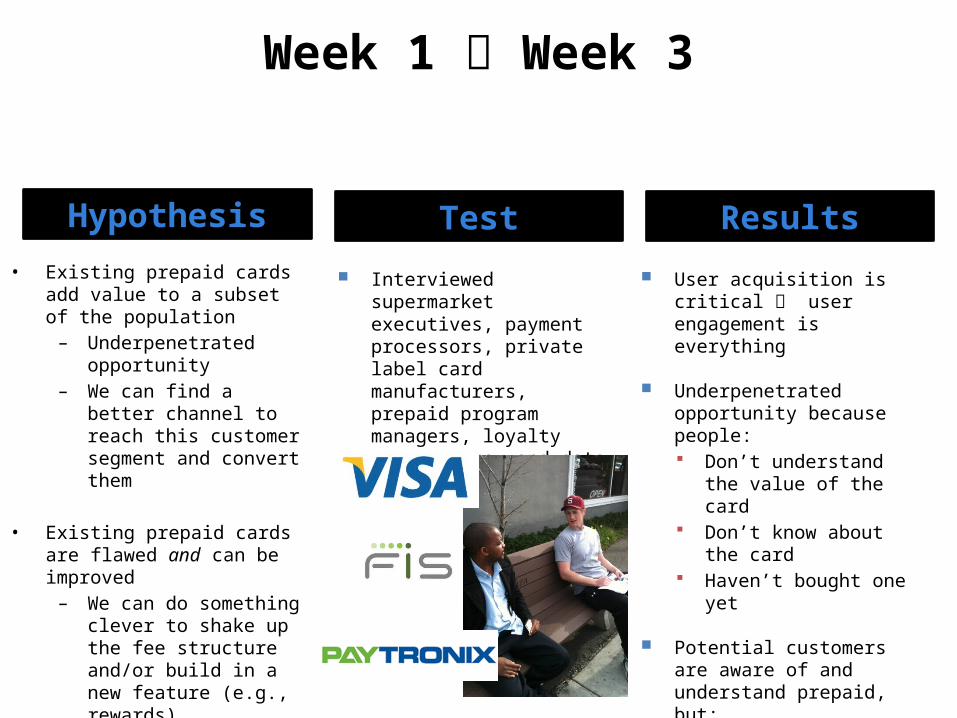
Week 1 Week 3
Hypothesis• Existing prepaid cards add value
to a subset of the population – Underpenetrated
opportunity– We can find a better
channel to reach this customer segment and convert them
• Existing prepaid cards are flawed and can be improved
– We can do something clever to shake up the fee structure and/or build in a new feature (e.g., rewards)
• Solution = prepaid + loyalty card– Distributed at retail POS
Test
Interviewed supermarket executives, payment processors, private label card manufacturers, prepaid program managers, loyalty consultants, and data analytic firms
Results
User acquisition is critical user engagement is everything
Underpenetrated opportunity because people: Don’t understand the value
of the card Don’t know about the card Haven’t bought one yet
Potential customers are aware of and understand prepaid, but: Hate the fees Haven’t bought one yet

Week 3 Week 4
Hypothesis Test
Interviewed end users at Walmart, food banks, bus stops, payday lenders, their homes, and supermarkets
Interviewed execs at Green Dot, Rush Card, and NetSpend
Results
End Users see value: More likely to sign up for prepaid
via assisted POS sale Active vs. passive sale hypothesis
validated More likely to keep and reload cards
with ongoing cash rewards Higher retention via loyalty
hypothesis validated
Retailers see value: New revenue opportunity is
compelling Access to purchasing data outside
the store is compelling
Industry Trends Loyalty + prepaid programs are the
future
Industry execs like this idea a lot and are actively exploring it
• Existing prepaid cards add value to a subset of the population
– Underpenetrated opportunity
– We can find a better channel to reach this customer segment and convert them
• Existing prepaid cards are flawed and can be improved
– We can do something clever to shake up the fee structure and/or build in a new feature (e.g., rewards)
• Solution = prepaid + loyalty card– Distributed at retail POS

Week 4 Week 5
Hypothesis• Customer awareness and
education are key obstacles to customer acquisition and retention
• Channel: Assisted sale at POS trumps current passive j-hook sale
– Active sale enhances awareness & education
• Product: Combining prepaid + loyalty
– Cash rebates improve retention and incentive to reload
Test
$5 for 5 minutes campaign Speak to as many potential
customers as possible ask for an actual commitment
Results
20 preliminary signups
Built empathy around customer prepaid needs
Immediacy Security fears Fees Channels
Discovered other needs Job-seeking Saving for kids’ education
Understood observed behaviors High churn Lack of reloading Lack of regular usage
Loyalty component not required if you can service the true pain points

Team Deliverable by Tomorrow
• Hypotheses for each part of business model• Test for each of the hypotheses
– What constitutes a pass/fail signal for the test (e.g. at what point would you say your hypotheses wasn’t even close to correct?
• Plan to get out of the building to test the hypotheses
• Summarized in a 5 Minute PowerPoint Presentation– Business Model Canvas– Market Size– Getting out of the building plan
Don’t Over Think Your Hypotheses


Backup
IdeaBusiness ModelSize Opportunity
Customer Development