presentation file for the first quarter of fiscal year
TRANSCRIPT

MinebeaMitsumi Inc.
August 4, 2021
Business ResultsFirst Quarter of Fiscal Year
Ending March 31, 2022
Summary of Consolidated Business Results for 1Q
August 4, 2021 2
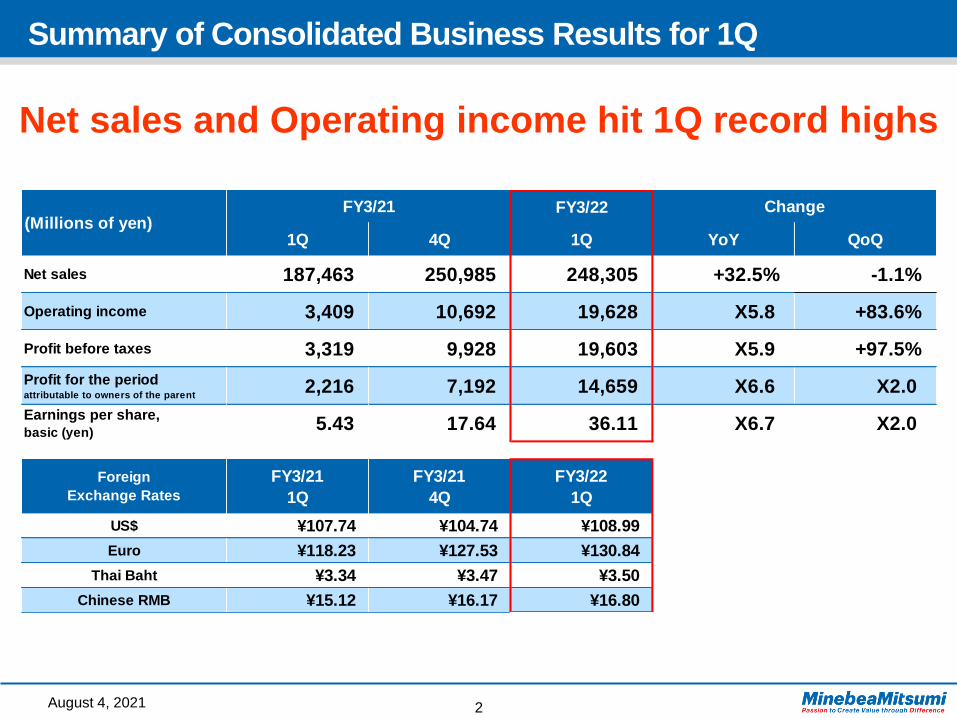
Net sales and Operating income hit 1Q record highs
FY3/22
1Q 4Q 1Q YoY QoQ
Net sales 187,463 250,985 248,305 +32.5% -1.1%
Operating income 3,409 10,692 19,628 X5.8 +83.6%
Profit before taxes 3,319 9,928 19,603 X5.9 +97.5%
2,216 7,192 14,659 X6.6 X2.0
5.43 17.64 36.11 X6.7 X2.0
FY3/21
1Q
FY3/21
4Q
FY3/22
1Q
¥107.74 ¥104.74 ¥108.99
¥118.23 ¥127.53 ¥130.84
¥3.34 ¥3.47 ¥3.50
¥15.12 ¥16.17 ¥16.80 Chinese RMB
Profit for the periodattributable to owners of the parent
Earnings per share,
basic (yen)
Foreign
Exchange Rates
US$
Euro
Thai Baht
Change(Millions of yen)
FY3/21

204.4
279.5 267.7
226.9
187.5
274.3 275.7
251.0 248.3
3.3
19.6
23.3
12.4
3.4
17.5 19.6
10.7
19.6
1Q 2Q 3Q 4Q 1Q 2Q 3Q 4Q 1Q 2Q 3Q 4Q
FY3/20 FY3/21 FY3/22
(Billions of yen)
1.6%
7.0%
8.7%
5.5%
1.8%
6.4%7.1%
4.3%
7.9%
Net Sales, Operating Income/margin
August 4, 2021 3
Net sales
Operating income
Operating margin
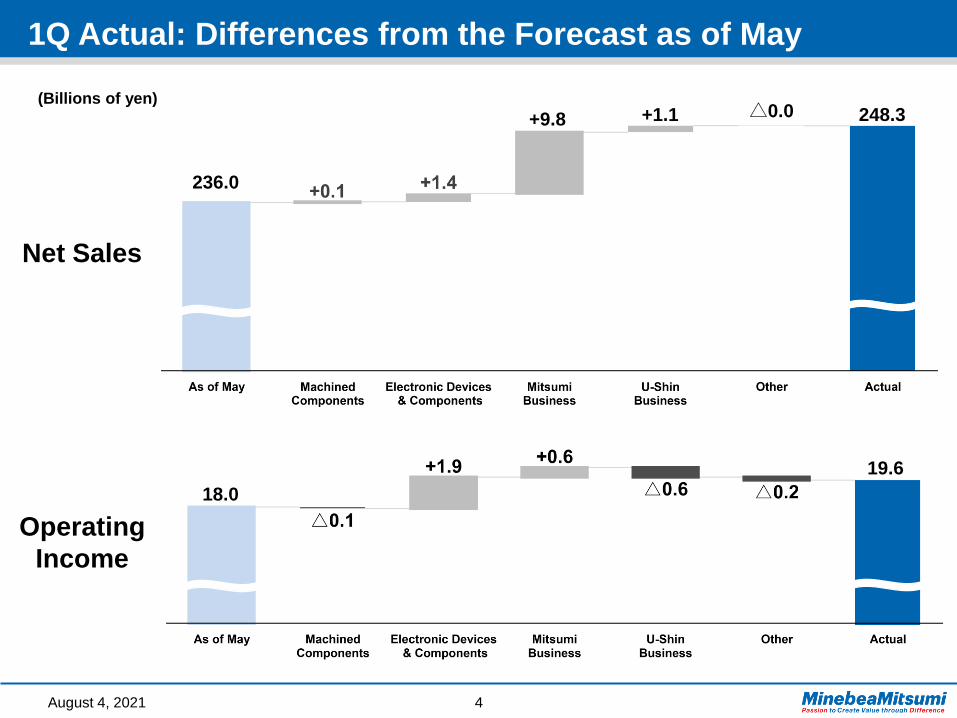
1Q Actual: Differences from the Forecast as of May
August 4, 2021 4
Net Sales
Operating
Income
(Billions of yen)
236.0
248.3+9.8 +1.1 △0.0
18.0
19.6
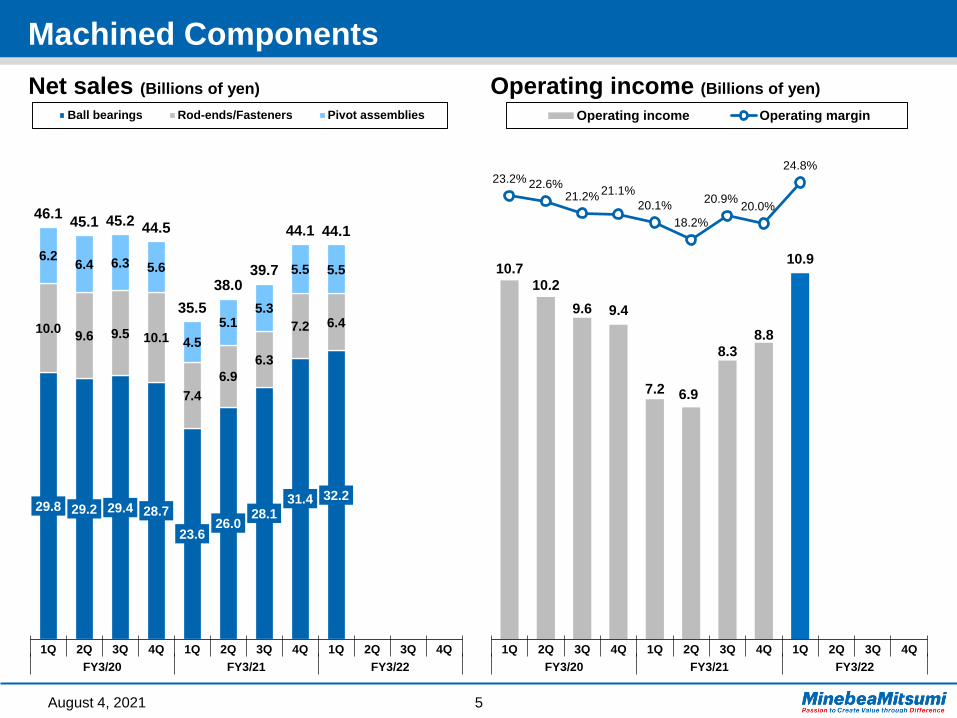
29.8 29.2 29.4 28.7
23.6 26.0
28.1 31.4 32.2
10.0 9.6 9.5 10.1
7.4
6.9
6.3
7.2 6.4
6.2 6.4 6.3 5.6
4.5
5.1 5.3
5.5 5.5
46.1 45.1 45.2
44.5
35.5
38.0 39.7
44.1 44.1
1Q 2Q 3Q 4Q 1Q 2Q 3Q 4Q 1Q 2Q 3Q 4Q
FY3/20 FY3/21 FY3/22
Ball bearings Rod-ends/Fasteners Pivot assemblies
10.7 10.2
9.6 9.4
7.2 6.9
8.3
8.8
10.9
23.2% 22.6%21.2%
21.1%
20.1%
18.2%
20.9%20.0%
24.8%
1Q 2Q 3Q 4Q 1Q 2Q 3Q 4Q 1Q 2Q 3Q 4Q
FY3/20 FY3/21 FY3/22
Operating income Operating margin
Machined Components
August 4, 2021 5
Net sales (Billions of yen) Operating income (Billions of yen)
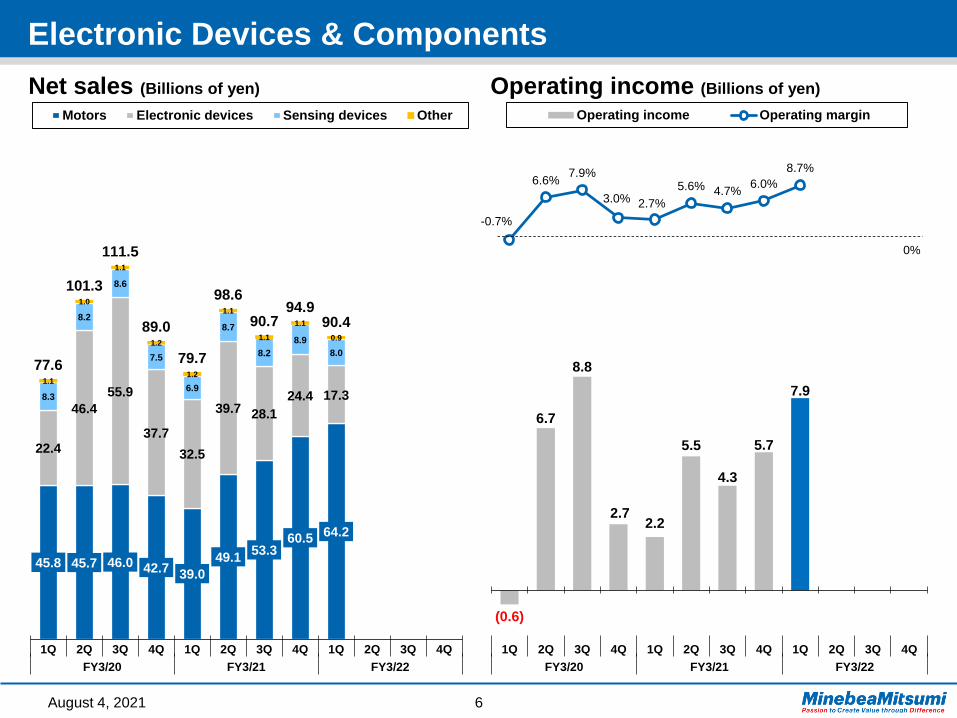
45.8 45.7 46.0 42.7 39.0
49.1 53.3
60.5 64.2
22.4
46.4
55.9
37.7
32.5
39.7 28.1
24.4 17.3 8.3
8.2
8.6
7.5
6.9
8.7
8.2
8.9
8.0
1.1
1.0
1.1
1.2
1.2
1.1
1.1
1.1
0.9
77.6
101.3
111.5
89.0
79.7
98.6
90.7 94.9
90.4
1Q 2Q 3Q 4Q 1Q 2Q 3Q 4Q 1Q 2Q 3Q 4Q
FY3/20 FY3/21 FY3/22
Motors Electronic devices Sensing devices Other
(0.6)
6.7
8.8
2.7 2.2
5.5
4.3
5.7
7.9
-0.7%
6.6%7.9%
3.0% 2.7%
5.6% 4.7%6.0%
8.7%
1Q 2Q 3Q 4Q 1Q 2Q 3Q 4Q 1Q 2Q 3Q 4Q
FY3/20 FY3/21 FY3/22
Operating income Operating margin
0%
Electronic Devices & Components
August 4, 2021 6
Net sales (Billions of yen) Operating income (Billions of yen)
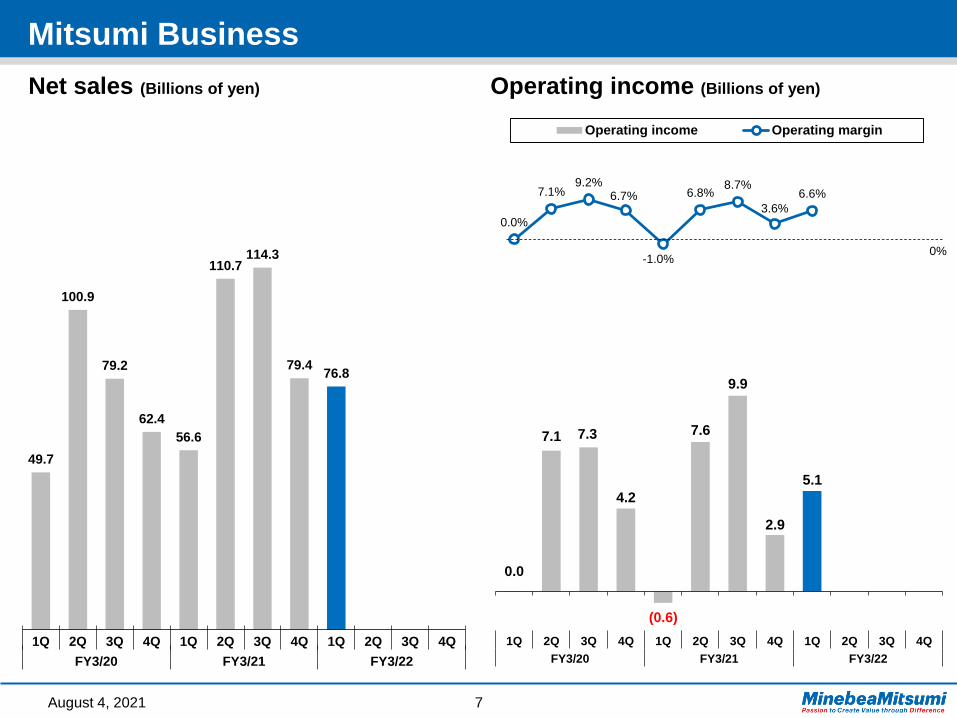
Mitsumi Business
August 4, 2021 7
Net sales (Billions of yen) Operating income (Billions of yen)
49.7
100.9
79.2
62.4
56.6
110.7 114.3
79.4 76.8
1Q 2Q 3Q 4Q 1Q 2Q 3Q 4Q 1Q 2Q 3Q 4Q
FY3/20 FY3/21 FY3/22
0.0
7.1 7.3
4.2
(0.6)
7.6
9.9
2.9
5.1
0.0%
7.1%9.2%
6.7%
-1.0%
6.8%8.7%
3.6%
6.6%
1Q 2Q 3Q 4Q 1Q 2Q 3Q 4Q 1Q 2Q 3Q 4Q
FY3/20 FY3/21 FY3/22
Operating income Operating margin
0%

U-Shin Business
August 4, 2021 8
Net sales (Billions of yen) Operating income (Billions of yen)
30.7
32.0 31.5 30.9
15.6
26.6
30.7 32.3
36.9
1Q 2Q 3Q 4Q 1Q 2Q 3Q 4Q 1Q 2Q 3Q 4Q
FY3/20 FY3/21 FY3/22
0.7 0.8
1.4
(0.3)
(2.2)
1.2
1.7
(2.5)
(0.1)
0.4
2.2% 2.4%
4.5%
-0.9%
-13.9%
4.5%5.4%
-7.9%
-0.2%
1Q 2Q 3Q 4Q 1Q 2Q 3Q 4Q 1Q 2Q 3Q 4Q
FY3/20 FY3/21 FY3/22
Operating income Operating margin
0%
Excluding ¥0.4bn of onetime cost in 1Q
1.0%

Profit attributable to owners of the parent / EPS
August 4, 2021 9
2.2
14.1
19.2
10.4
2.2
13.2
16.1
7.2
14.7
5.2
34.1
46.4
25.4
5.4
32.3
39.5
17.6
36.1
1Q 2Q 3Q 4Q 1Q 2Q 3Q 4Q 1Q 2Q 3Q 4Q
FY3/20 FY3/21 FY3/22
Profit for the period attributable to owners of the parent
Earnings per share, basic (yen)
(Billions of yen)
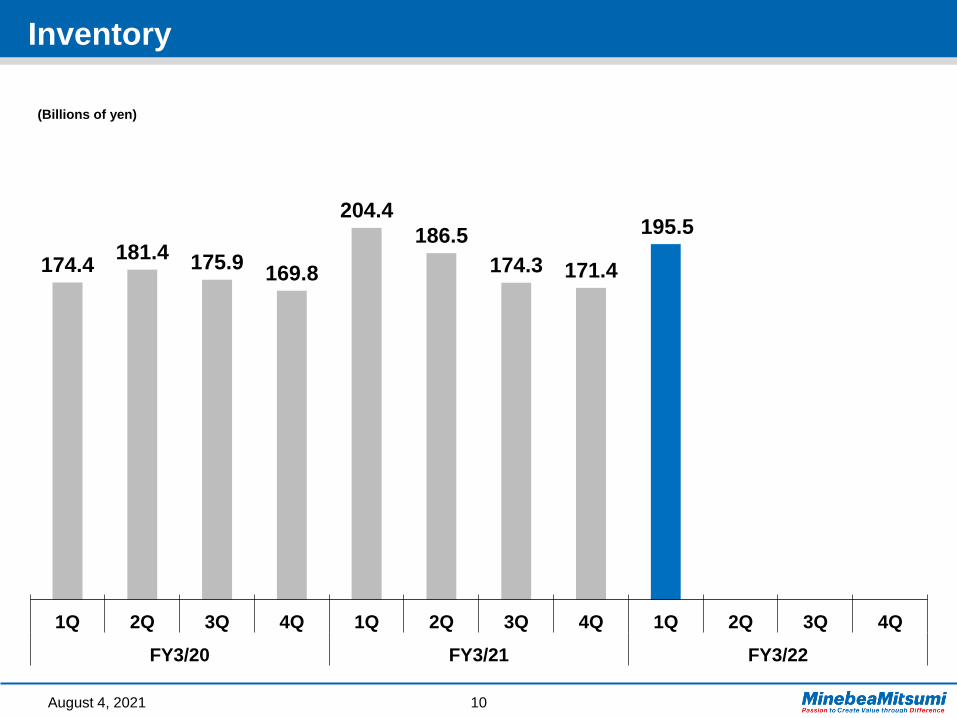
Inventory
August 4, 2021 10
174.4 181.4
175.9 169.8
204.4
186.5
174.3 171.4
195.5
1Q 2Q 3Q 4Q 1Q 2Q 3Q 4Q 1Q 2Q 3Q 4Q
FY3/20 FY3/21 FY3/22
(Billions of yen)
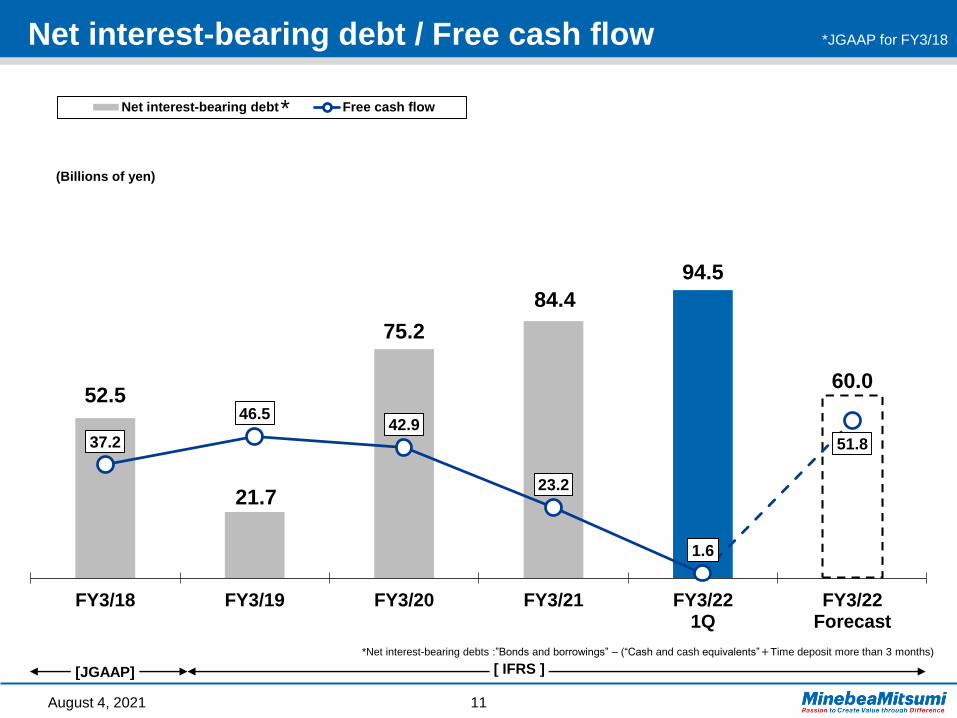
Net interest-bearing debt / Free cash flow
August 4, 2021 11
[ IFRS ][JGAAP]
*Net interest-bearing debts :”Bonds and borrowings” – (“Cash and cash equivalents”+Time deposit more than 3 months)
*
*JGAAP for FY3/18
52.5
21.7
75.2
84.4
94.5
60.0
37.2
46.5 42.9
23.2
1.6
51.8
FY3/18 FY3/19 FY3/20 FY3/21 FY3/221Q
FY3/22Forecast
Net interest-bearing debt Free cash flow
(Billions of yen)
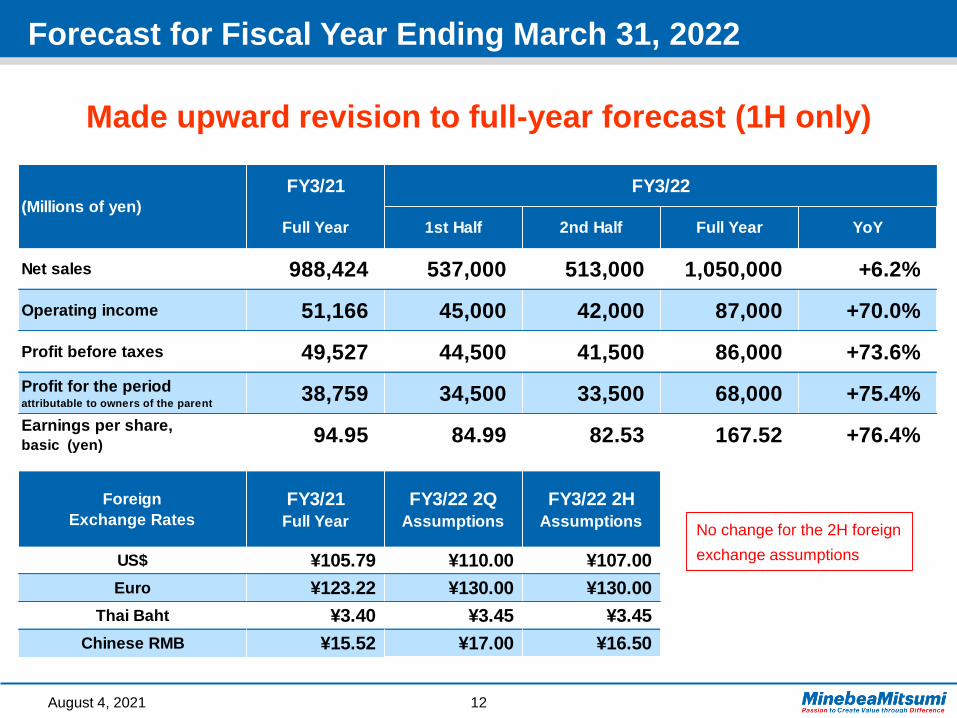
Forecast for Fiscal Year Ending March 31, 2022
August 4, 2021 12
Made upward revision to full-year forecast (1H only)
FY3/21
Full Year 1st Half 2nd Half Full Year YoY
Net sales 988,424 537,000 513,000 1,050,000 +6.2%
Operating income 51,166 45,000 42,000 87,000 +70.0%
Profit before taxes 49,527 44,500 41,500 86,000 +73.6%
38,759 34,500 33,500 68,000 +75.4%
94.95 84.99 82.53 167.52 +76.4%
FY3/21Full Year
FY3/22 2QAssumptions
FY3/22 2HAssumptions
¥105.79 ¥110.00 ¥107.00
¥123.22 ¥130.00 ¥130.00
¥3.40 ¥3.45 ¥3.45
¥15.52 ¥17.00 ¥16.50 Chinese RMB
(Millions of yen)
Earnings per share,
basic (yen)
Foreign
Exchange Rates
US$
Euro
Thai Baht
FY3/22
Profit for the periodattributable to owners of the parent
No change for the 2H foreign
exchange assumptions

Forecast for Business Segment
August 4, 2021 13
FY3/21
Full Year
(Adjusted)1st Half 2nd Half Full Year YoY
Net sales 988,424 537,000 513,000 1,050,000 +6.2%
Machined components 157,411 91,000 84,000 175,000 +11.2%
Electronic devices and components 345,595 190,000 165,000 355,000 +2.7%
Mitsumi business 352,277 179,000 191,000 370,000 +5.0%
U-Shin business 132,112 76,600 72,400 149,000 +12.8%
Other 1,029 400 600 1,000 -2.8%
Operating income 51,166 45,000 42,000 87,000 +70.0%
Machined components 31,223 23,000 20,500 43,500 +39.3%
Electronic devices and components 17,685 15,500 10,500 26,000 +47.0%
Mitsumi business 20,458 13,500 16,500 30,000 +46.6%
U-Shin business -2,594 1,000 3,500 4,500 -
Other -1,908 -1,000 -1,000 -2,000 +4.8%
Adjustment -13,698 -7,000 -8,000 -15,000 +9.5%
(Millions of yen)FY3/22

Today’s Points
1Q net sales and operating income both hit record highs. (X5.8
year-on-year)
Diversified business portfolio offsets negative factors, such as
weak demand for aircraft-related products, declining demand due
to semiconductor shortage, and rising raw material prices.
Made upward revision to full-year forecast. (1H only)
1Q operating margin for machined components made V-shaped
recovery as projected.
Decided to make additional investment in multi-purpose factory to
increase ball bearing production capacity.
Some positive signs in the aircraft-related business.
Launched series of new automotive products, primarily motors.
Significantly augmented tangible and intangible resources for
analog semiconductors.
1H operating income of ¥10B now in sight this fiscal year.
=> They may surpass Access products and move up to the third
spear in the ranking!
Customer interest in camera actuators is steadily rising.
Shift to high value-added products continues. (Won the first
vendor for large projects!)
Moved ahead with ongoing structural reforms.
14August 4, 2021
Overall
Machined
components
Electronic
devices and
components/
Mitsumi
U-Shin

250
285
300
315
325
345
365
Productivity improvement
¥8bn investment
¥6.5bn investment
Productivity improvement
¥10bn investment
¥10bn investment*excluding building
’17
’23
’22
’21
’20
’18
Ball Bearings
August 4, 2021 15
Miniature/Small-sized Ball Bearing
Production Capacity
(millions of units/month)Form part of the multi-purpose
factory into a miniature/small-
sized ball bearing factory!1
2
3
External sales keep growing
Higher production capacity to
bring operating margin up
Strong demand growth continues in all applications
=> Automotive, data center, high-end home appliances, etc.
Establish monthly capacity of 365 million units ASAP
‐Amount to be invested Building: ¥4billion
Equipment: ¥10 billion (Phase 1)
‐Planned construction site Bang Pa-in Plant, Thailand
‐Start of operation (plan) Around August 2022
‐Production capacity 20 million units/monthMulti-purpose factory (Bang Pa-in Plant, Thailand)
Install ball bearing manufacturing
equipment in the multi-purpose factory
’18
Key Points

[Reference] Outlook of Aircraft Market
August 4, 2021 16
Trend of commercial aircraft production rate
Possibility of moving
production plan
forward?
(Source: MinebeaMitsumi)
2018 2019 2020 2021E
2022E
2023E
External environment
- Recovery of passenger demand
- Initiatives to reduce CO2 in airlines
Increasing demand for new production
of energy-saving aircrafts

Motors
August 4, 2021 17
Resolver for
traction motor
Examples of automotive motors that
are expected to grow exponentially
Cooling fan for EV
rechargeable battery
Active grill actuator
DC motor
for EPB
Stepping
motor for
HVAC
Continually launching new
products/large projects for
automotive motors
1
2
3
High value-added product
strategy benefits HDDs as well
Pursue synergy with semi-
conductor business
• Resolver for EV traction motors
• Cooling fan for EV rechargeable batteries
• DC motor for EPBs
• Active grill actuator, etc.
Environment
Safety Comfort
Expect CAGR at 20% or
higher for sales of motor
for autos (FY3/21-FY3/25)
Actuator for
valves
Key Points

Analog Semi-conductors
August 4, 2021 18
Improvements in tangible
resources1
2
3
Improvements in intangible
resources
Solve facility issues with further
room for expansion
- Leverage 6-inch/8-inch wafer fabs to
increase efficiency
- Make an additional ¥10+ bn investment in an
8-inch wafer fab to up company-wide
production capacity by 50%
-> Subsidy granted
- Secure engineering/development workforce
of 300
- Leverage mixed-signal semiconductors to
make analog semiconductors more competitive
- Accelerate synergy via INTEGRATION with
businesses including motors
Chitose(6-inch)
Analog semiconductor production sites
New!!
Wafer
Photo: Provided by Omron
Key Points
Takatsuka(6-inch)
Yasu(8-inch)
Cebu(Philippines)
Akita
Assy

[Reference] Outlook of Analog Semi-conductor Market
August 4, 2021 19
59
54 56
6871
74
2018 2019 2020 2021 2022 2023
Analog Semi-conductor
Market
2018-2023E: World Semiconductor Trade Statistics (WSTS)
2030E: MinbeaMitsumi
Outlook of Analog Semi-conductor Market*
(billion USD)
CAGR
5-6%
(’23-’30)
2030E E E
Automotive
Communi-
cation
Industry
Consumer
Computer
Power
Management
Signal Converter
Amp / Comparator
Interface
Contents growth of analog
ICs, mainly for energy-
saving products
Expect sales to grow
stronger than market
E
billion USD*
*
CAGR 10%
(’20-’23)
2020World semi-
conductor Market
360
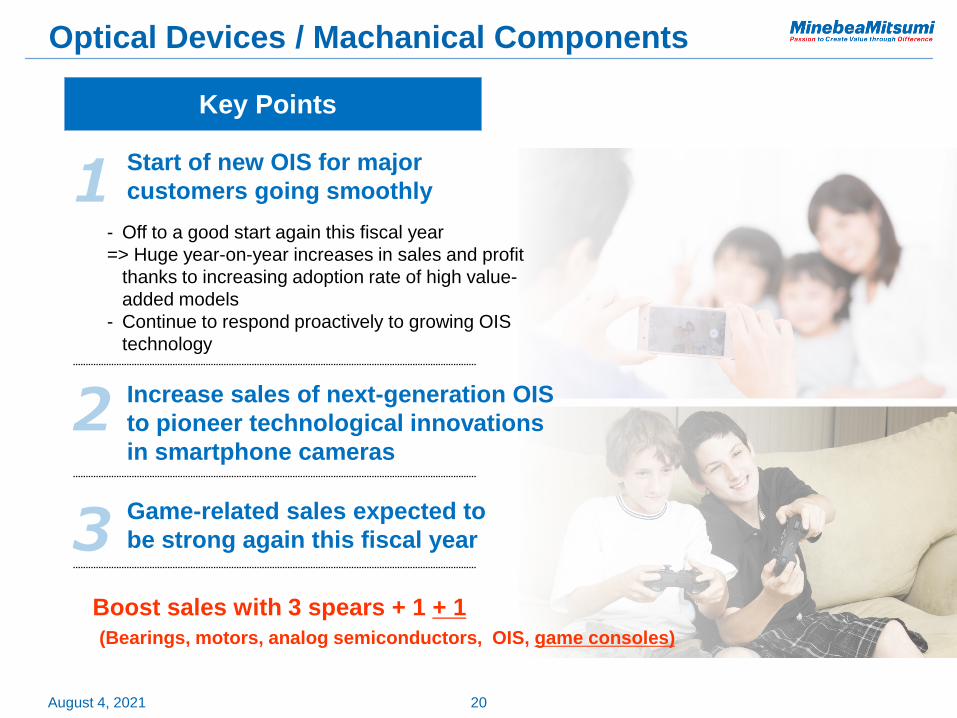
Optical Devices / Machanical Components
August 4, 2021 20
Key Points
Start of new OIS for major
customers going smoothly1
2 Increase sales of next-generation OIS
to pioneer technological innovations
in smartphone cameras
- Off to a good start again this fiscal year
=> Huge year-on-year increases in sales and profit
thanks to increasing adoption rate of high value-
added models
- Continue to respond proactively to growing OIS
technology
Game-related sales expected to
be strong again this fiscal year3Boost sales with 3 spears + 1 + 1
(Bearings, motors, analog semiconductors, OIS, game consoles)
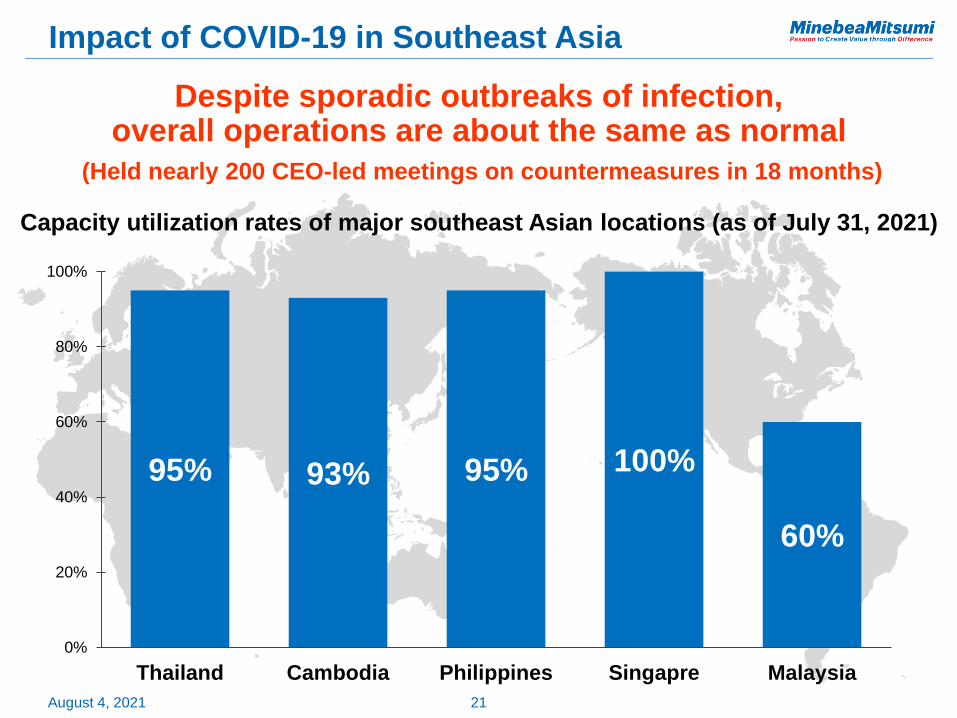
Impact of COVID-19 in Southeast Asia
August 4, 2021
Despite sporadic outbreaks of infection, overall operations are about the same as normal
Capacity utilization rates of major southeast Asian locations (as of July 31, 2021)
95% 93% 95% 100%
60%
0%
20%
40%
60%
80%
100%
Thailand Cambodia Philippines Singapre Malaysia
(Held nearly 200 CEO-led meetings on countermeasures in 18 months)
21

Share Buyback
August 4, 2021 22
Resolution of share buyback (August 4, 2021)
- Number of shares: Up to 3 million shares
(equal to 0.74% of total issued shares excluding treasury shares)
- Amount: Up to 10.0 billion yen
- Period: From August 5, 2021 to October 29, 2021
- Purpose: In order to improve return on shareholders and improve
capital efficiency and to implement agile capital policy according to
the business environment.
[For reference] KPIs for determining remuneration of CEO and other
directors who are executive officers
Profit, sales growth rate, performance compared against the Nikkei
average, and operating margin, plus market capitalization which
was added this year.

ESG Topics (1)
August 4, 2021 23
Completion of 60th Anniversary Project
Support for children who lost their parents in the Great East
Japan Earthquake
(announced on August 8, 2012)
- Established a scholarship fund to support orphans
- 138 children from first graders to third year junior high
school students (at that time)
- Donated a total of 100 million yen
Making a donation to Single
Mothers Forum
- Purpose: Support single-parent families with high school
aged children
- Donations to be used for:
"We Support High School Students!," a project of the
certified NPO, Single Mothers Forum
- First donation—50 million yen
=> Plan to donate up to 100 million yen depending on our
performance
Donations to Single-Parent Support Organization: 70th Anniversary Project
We wish to express our deepest sympathies to those who are experiencing
difficulties due to the spread of the novel coronavirus, and have decided to make the
following charitable donations.
Graduation event for the
Great East Japan Earthquake
scholarship fund

ESG Topics (2)
August 4, 2021 24
Released “ESG Information Index” on MinebeaMitsumi corporate website
We have organized our environmental, social and governance (ESG) activities as well as
sustainability initiatives in line with the GRI Standards, and provided links to relevant
information.
Please refer to our website https://www.minebeamitsumi.com/english/csr/list/data/
Awarded the “Excellence Awards” of the “3rd ASEAN-OSHNET Award”
for the first time for a Japanese Company.
Award Ceremony (Remote)
Completion of COVID-19 workplace vaccination in Japan
- Target: Employees and their families, etc. of MinebeaMitsumi group who wish to get vaccination
- Date: June 24, 2021 and onwards
- Location: Tokyo HQ, Karuizawa, Hamamatsu, Fujisawa, Hiroshima, Chitose
Completed to nearly 13,000 employees
- ASEAN-OSHNET Award: Selects companies with good
occupational safety and health systems and performance in
each ASEAN country
- "Excellence Awards": Given to one company with the best
occupational health and safety management systems in each
country.

●Machined Components
●Electronic Devices &
Components
●Mitsumi
●U-shin
●HQ Expenses
Estimated breakdown (FY3/23)
¥50 bn
¥30 bn
¥30 bn
¥10 bn
¥-20 bn
Upside from M&A!
Estimated breakdown of ¥100 bn OP after COVID-19
25
The possibility of realizing the estimated breakdown
announced in 2017 has been raised toward FY3/23!
(Reference)
Estimated breakdown (FY3/21)
announced in May 2017
●Machined Components
●Electronic Devices &
Components
●Mitsumi
●M&A
●HQ Expenses
¥50 bn
¥30 bn
¥20 bn
¥15 bn
¥-15 bnAugust 4, 2021
From the FY3/21Q3 Investor Meeting
Presentation on Feb. 5, 2021
26August 4, 2021
Any statements in this presentation which are not historical are future projections based on
certain assumptions and executive judgments drawn from currently available information.
Please note that actual performance may vary significantly from any particular projection due to
various factors.
Factors affecting our actual performance include but are not limited to: (i) changes in economic
conditions or demand trends related to MinebeaMitsumi’s business operations; (ii) fluctuation of
foreign exchange rates or interest rates; and (iii) our ability to continue R&D, manufacturing and
marketing in a timely manner in the electronics business sector, where technological innovations
are rapid and new products are launched continuously.
All the information in this document is the property of MinebeaMitsumi Inc. All parties are
prohibited, for whatever purpose, to copy, modify, reproduce, transmit, etc. this information
regardless of ways and means without prior written permission of MinebeaMitsumi Inc.

August 4, 2021 27
Reference

Machined Components
August 4, 2021 28
*JGAAP for FY3/18
Net sales (Billions of yen) Operating income (Billions of yen)
[JGAAP] [ IFRS ][JGAAP] [ IFRS ]
105.9
121.2 117.1 109.1
128.3
31.9
37.6 39.3
27.8
26.2
31.5
29.5 24.5
20.5
20.5
7.1
176.4
188.3 180.9
157.4
175.0
FY3/18 FY3/19 FY3/20 FY3/21 FY3/22Forecast
Ball bearings Rod-ends/Fasteners Pivot assemblies Other
42.7
47.8
39.9
31.2
43.5
24.2%25.4%
22.0%
19.8%
24.9%
FY3/18 FY3/19 FY3/20 FY3/21 FY3/22Forecast
Operating income Operating margin
43.4
Excluding ¥0.7bn of PPA impact in 4Q

Electronic Devices & Components
August 4, 2021 29
*JGAAP for FY3/18
Net sales (Billions of yen) Operating income (Billions of yen)
[JGAAP] [ IFRS ][JGAAP] [ IFRS ]
184.2 188.1 180.2 201.9
253.5
227.8
158.5 162.4 124.7
64.0
35.7
36.4 32.5 32.6
33.5
3.8
4.2 4.3
4.6 4.0
451.5
387.3 379.4
363.8 355.0
FY3/18 FY3/19 FY3/20 FY3/21 FY3/22Forecast
Motors Electronic devices Sensing devices Other
31.2
16.9 17.6 17.6
26.0
6.9%
4.4% 4.6% 4.8%
7.3%
FY3/18 FY3/19 FY3/20 FY3/21 FY3/22Forecast
Operating income Operating margin
Including ¥19.0 bn of business transfer impactfor Smart Products
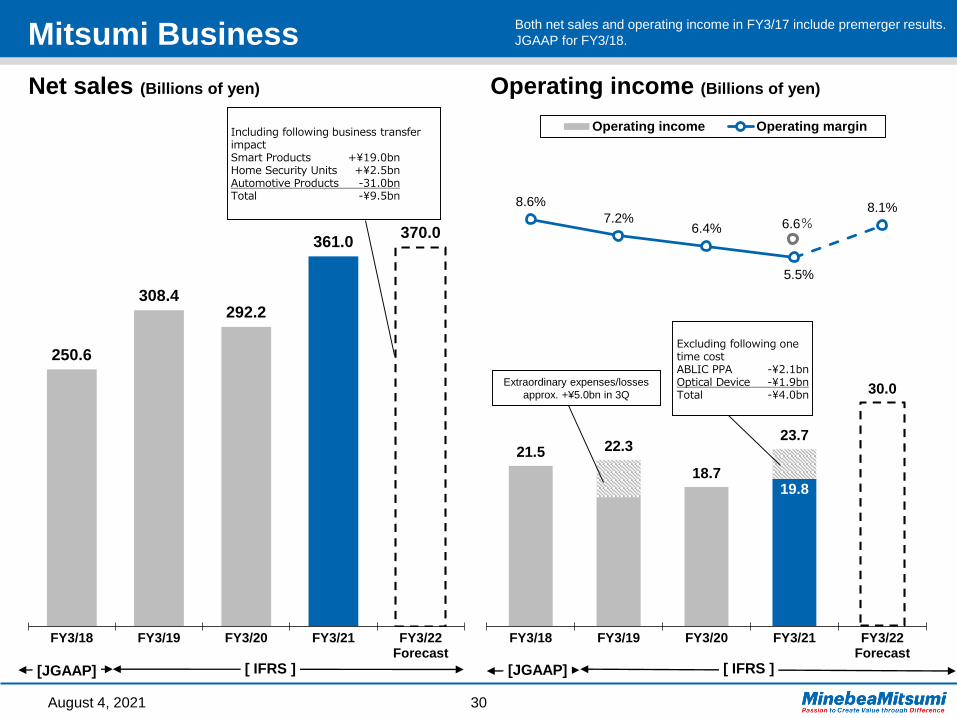
Mitsumi Business
August 4, 2021 30
Both net sales and operating income in FY3/17 include premerger results.
JGAAP for FY3/18.
Net sales (Billions of yen) Operating income (Billions of yen)
[JGAAP] [ IFRS ][JGAAP] [ IFRS ]
250.6
308.4 292.2
361.0 370.0
FY3/18 FY3/19 FY3/20 FY3/21 FY3/22Forecast
19.8
21.5 22.3
18.7
23.7
30.0
8.6%
7.2%6.4%
5.5%
8.1%
FY3/18 FY3/19 FY3/20 FY3/21 FY3/22Forecast
Operating income Operating margin
Extraordinary expenses/losses
approx. +¥5.0bn in 3Q
Including following business transferimpactSmart Products +¥19.0bnHome Security Units +¥2.5bnAutomotive Products -31.0bnTotal -¥9.5bn
Excluding following one time costABLIC PPA -¥2.1bnOptical Device -¥1.9bnTotal -¥4.0bn
6.6%
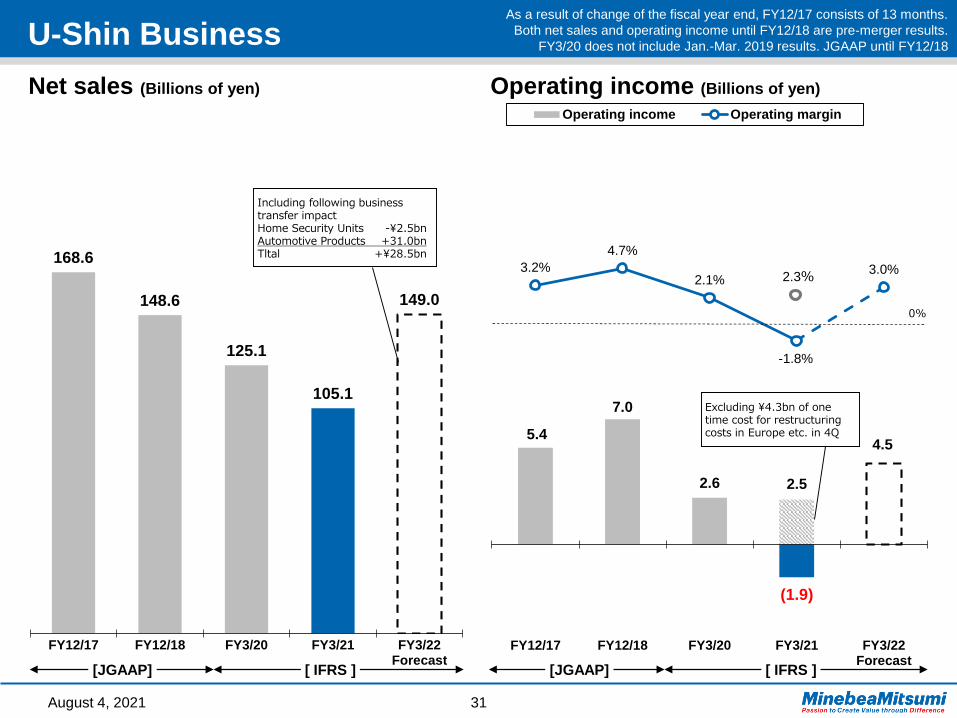
U-Shin Business
August 4, 2021 31
As a result of change of the fiscal year end, FY12/17 consists of 13 months.
Both net sales and operating income until FY12/18 are pre-merger results.
FY3/20 does not include Jan.-Mar. 2019 results. JGAAP until FY12/18
Net sales (Billions of yen) Operating income (Billions of yen)
[JGAAP] [ IFRS ] [JGAAP] [ IFRS ]
168.6
148.6
125.1
105.1
149.0
FY12/17 FY12/18 FY3/20 FY3/21 FY3/22Forecast
5.4
7.0
2.6
(1.9)
4.5
2.5
3.2%
4.7%
2.1%
-1.8%
3.0%
FY12/17 FY12/18 FY3/20 FY3/21 FY3/22Forecast
Operating income Operating margin
0%
2.3%
Including following businesstransfer impactHome Security Units -¥2.5bnAutomotive Products +31.0bnTltal +¥28.5bn
Excluding ¥4.3bn of one time cost for restructuring costs in Europe etc. in 4Q

S.G.&A. expense / ratio
August 4, 2021 32
26.7 27.3 26.6 27.0 25.2
26.1 27.5
29.0 30.1
13.1%
9.8% 10.0%
11.9%
13.4%
9.5% 10.0%
11.5%12.1%
1Q 2Q 3Q 4Q 1Q 2Q 3Q 4Q 1Q 2Q 3Q 4Q
FY3/20 FY3/21 FY3/22
S.G.&A. expenses S.G.&A. to sales ratio(Billions of yen)

Capital Expenditure / D&A Expense
August 4, 2021 33
*JGAAP for FY3/18
* Capital expenditures of FY3/20 do not include the increase of asset from lease contracts at the IFRS16 application start date
*54.2 54.2
50.1
45.5
16.4
70.0
31.6
36.4
46.2 48.6
10.7
45.0
FY3/18 FY3/19 FY3/20 FY3/21 FY3/221Q
FY3/22Forecast
Capital expenditure Depreciation & Amortization expenses(Billions of yen)
[ IFRS ][JGAAP]

ROIC (Return On Invested Capital)
August 4, 2021 34
(%)
ROIC for U-Shin business are pre-merger result and based
on CY / JGAAP, and are not included in the Total.
JGAAP until FY3/18
MinebeaMitsumi
ROIC
NOPAT
Invested capital (Notes receivable/accounts receivable + inventories
+ non-current assets - notes payable/accounts payable)
(Operating income + extraordinary profit/loss) x (1-tax rate)
=
Calculated using business assets (trade receivable/payable, inventories, non-current assets) by segment
10.9
10.4
13.1
12.4
8.86.6
1.6
8.5
9.9
4.88.9
28.029.9 30.1
31.1
24.0
18.6
14.616.4
21.620.3
25.6
12.8
10.5
16.5
11.0
10.8
9.8
4.4
11.8 9.7 11.1
15.2
-3.2
2.0
17.6 18.2
14.5
11.6
-1.2
14.3
18.9
5.0
9.5
0.5
-9.4
7.10.1
3.1
-2.3
-9.3
5.8
8.5
-11.5
-0.3
-20.0
-10.0
0.0
10.0
20.0
30.0
40.0
FY3/16 FY3/17 FY3/18 FY3/19 FY3/20 FY3/21 FY3/211Q
FY3/212Q
FY3/213Q
FY3/214Q
FY3/221Q
Total Machined components Electronic devices and components Mitsumi business U-Shin business
[JGAAP] [ IFRS ] [ IFRS ]