presentation for 1-on-1 meetings
TRANSCRIPT

1
Presentation
for 1-on-1 meetings
February, 2016
2
These materials have been prepared by OJSC PhosAgro (PhosAgro) solely for your information and may not be copied, reproduced,
retransmitted or further distributed, directly or indirectly, by any recipient to any other person or published, in whole or in part, for any
purpose or under any circumstances.
These materials have not been independently verified. All information presented or contained in this presentation is subject to
verification, correction, completion and change without notice. None of PhosAgro nor any other person undertakes any obligation to
amend, correct or update this presentation or to provide the recipient with access to any additional information that may arise in
connection with it.
These materials may contain projections and other forward-looking statements regarding future events or the future financial
performance of PhosAgro. You can identify forward-looking statements by terms such as “expect,” “believe,” “estimate,” “intend,” “will,”
“could,” “may” or “might”, or other similar expressions. PhosAgro cautions you that these statements are only statements regarding
PhosAgro's intentions, beliefs or current expectations concerning, among other things, its results of operations, financial condition,
liquidity, prospects, growth, strategies and the fertilizer and mining industry and are based on numerous assumptions and accordingly
actual events or results may differ materially. PhosAgro will not update these statements to reflect events and circumstances occurring
after the date hereof. Factors that could cause the actual results to differ materially from those contained in projections or forward-
looking statements of PhosAgro may include, among others, general economic and competitive environment conditions in the markets
in which PhosAgro operates, market change in the fertilizer and mining industries, as well as many other risks affecting PhosAgro and
its operations. Past performance should not be taken as an indication or guarantee of future results, and no representation or warranty,
express or implied, is made regarding future performance.
These materials do not constitute or form part of any advertisement of securities, any offer or invitation to sell or issue or any solicitation
of any offer to purchase or subscribe for, any securities of PhosAgro in any jurisdiction, nor shall they or any part of them nor the fact of
their presentation, communication or distribution form the basis of, or be relied on in connection with, any contract or investment
decision. No representation or warranty, express or implied, is given by PhosAgro, its affiliates or any of their respective advisers,
officers, employees or agents, as to the accuracy, completeness or fairness of the information or opinions or for any loss howsoever
arising, directly or indirectly, from any use of these materials or their contents. The merit and suitability of any investment in PhosAgro
should be independently evaluated and any person considering such an investment in PhosAgro is advised to obtain independent
advice as to the legal, tax, accounting, financial, credit and other related advice prior to making an investment.
By accepting a copy of these materials, you agree to be bound by the foregoing limitations.
Disclaimer

PhosAgro and the
global fertilizer
industry
4
160
53
0
79
170
166
166
166
225
235
225
170
178
210
225
225
225
103
103
103
26.5
14
8.4 7.5 6.4 6.4 3.8
OCP Mosaic Vale PhosAgro PotashCorp JPMC Maaden
11.9
5.7 4.0 2.9 2.4 1.3 1.1
Mosaic OCP Phosagro Ma'aden Eurochem PotashCorp Vale
Flexible production lines
Phosphate fertilizer capacities of 5.1 mln t,
2.2 mln t fully flexible into NPK production
Leader in Russian fertilizer market growing
twice faster than the world consumption
Net back driven sales model with a global
presence
Flexible
production and
sales
Note: (1) Excluding Chinese producers
(2) PhosAgro, IMC as of June 2011
(3) Russian Academy of Science
(4) self –sufficiency depends on the composition of the products produced by PhosAgro
Source: IFA, CRU, companies data, PhosAgro
EBITDA and EBITDA margin dynamic vs DAP price
Source: Argus-FMB, CRU, IFA, companies’ data, PhosAgro
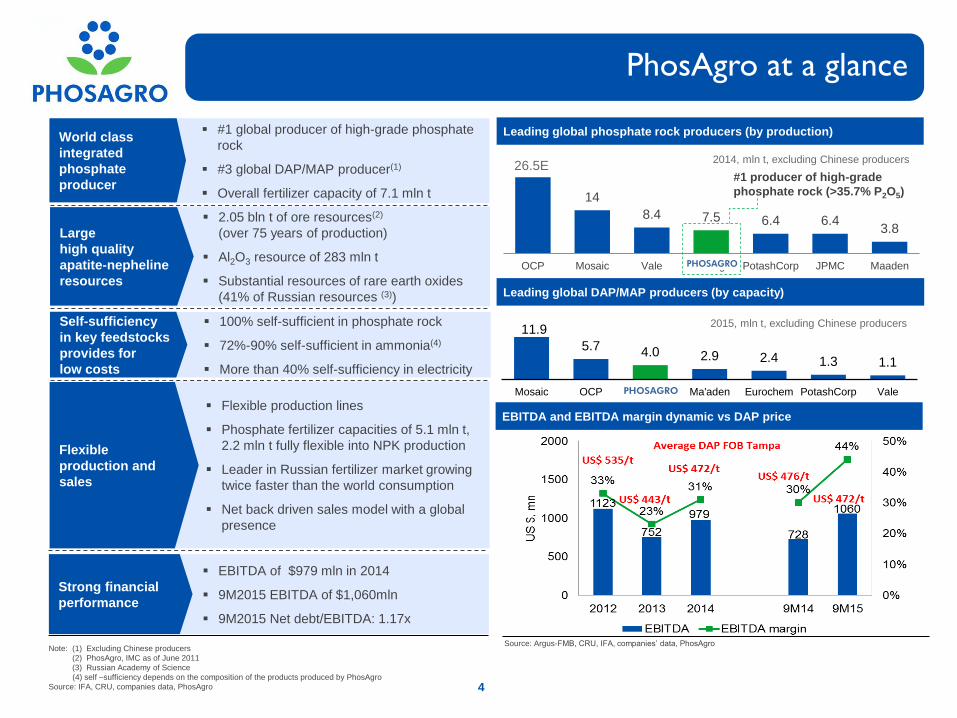
PhosAgro at a glance
1
Leading global phosphate rock producers (by production)
2014, mln t, excluding Chinese producers
#1 producer of high-grade
phosphate rock (>35.7% P2O5)
Leading global DAP/MAP producers (by capacity)
2015, mln t, excluding Chinese producers
EBITDA of $979 mln in 2014
9M2015 EBITDA of $1,060mln
9M2015 Net debt/EBITDA: 1.17x
Strong financial
performance
#1 global producer of high-grade phosphate
rock
#3 global DAP/MAP producer(1)
Overall fertilizer capacity of 7.1 mln t
World class
integrated
phosphate
producer
100% self-sufficient in phosphate rock
72%-90% self-sufficient in ammonia(4)
More than 40% self-sufficiency in electricity
Self-sufficiency
in key feedstocks
provides for
low costs
2.05 bln t of ore resources(2)
(over 75 years of production)
Al2O3 resource of 283 mln t
Substantial resources of rare earth oxides
(41% of Russian resources (3))
Large
high quality
apatite-nepheline
resources
4
26.5E

4
160
53
0
79
170
166
166
166
225
235
225
170
178
210
225
225
225
103
103
103
5 Source: IFA, CRU
5
1
2
7
8
3
6
4
1
2
3
Latin America
North America
Russia & CIS
4
5
6 North Africa
Europe
Middle East
2014 MAP/DAP production vs consumption, global trade
in million tonnes of P2O5
Production Consumption
7
8
South Asia
East Asia
World MAP/DAP trade: 11.01 mn t of P2O5
World MAP/DAP demand: 28.4 mn t of P2O5
0.8 2.1
4.4 5.5
1.6 0.6
3.8
0.9 0.5 1.7
4.4
1.9
10.2 13.2
0.8 2.1
4
160
53
0
79
170
166
166
166
225
235
225
170
178
210
225
225
225
103
103
103
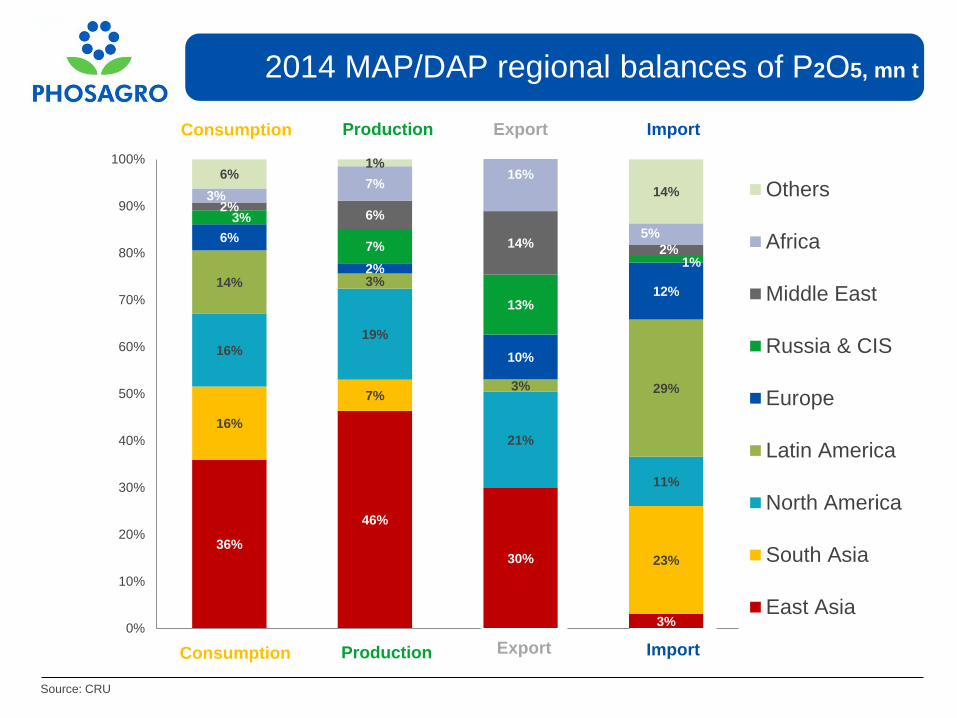
2014 MAP/DAP regional balances of P2O5, mn t
Source: CRU
Import Export Production Consumption
36%
46%
30%
3%
16%
7%
23%
16%
19%
21%
11%
14% 3%
3% 29%
6%
2%
10%
12%
3%
7%
13%
1%
2% 6%
14% 2%
3% 7%
16%
5%
6% 1%
14%
0%
10%
20%
30%
40%
50%
60%
70%
80%
90%
100%
Consumption Production Export Import
Others
Africa
Middle East
Russia & CIS
Europe
Latin America
North America
South Asia
East Asia
Import Export Production Consumption

4
160
53
0
79
170
166
166
166
225
235
225
170
178
210
225
225
225
103
103
103
0
50
100
150
200
250
0
200
400
600
800
1000
1200
1400
Jan-9
9A
pr-
99
Jul-9
9O
ct-
99
Jan-0
0A
pr-
00
Jul-0
0O
ct-
00
Jan-0
1A
pr-
01
Jul-0
1O
ct-
01
Jan-0
2A
pr-
02
Jul-0
2O
ct-
02
Jan-0
3A
pr-
03
Jul-0
3O
ct-
03
Jan-0
4A
pr-
04
Jul-0
4O
ct-
04
Jan-0
5A
pr-
05
Jul-0
5O
ct-
05
Jan-0
6A
pr-
06
Jul-0
6O
ct-
06
Jan-0
7A
pr-
07
Jul-0
7O
ct-
07
Jan-0
8A
pr-
08
Jul-0
8O
ct-
08
Jan-0
9A
pr-
09
Jul-0
9O
ct-
09
Jan-1
0A
pr-
10
Jul-1
0O
ct-
10
Jan-1
1A
pr-
11
Jul-1
1O
ct-
11
Jan-1
2A
pr-
12
Jul-1
2O
ct-
12
Jan-1
3A
pr-
13
Jul-1
3O
ct-
13
Jan-1
4A
pr-
14
Jul-1
4O
ct-
14
Jan-1
5A
pr-
15
Jul-1
5O
ct-
15
Jan-1
6
DAP, $/t, FOB Tampa Grain basket price Spread relative to basket price, % (rhs) Median DAP to basket price, %
Source: Fertecon, Argus-FMB, FAO, USDA, IFA, S&P Capital IQ
Note: (1) agricultural commodity prices are represented by a grain index calculated as follows:
(wheat price*7+ corn price *8 rice price*4.5+soybeans price*2.5)/22
Prices are as of 25 January 2016
DA
P a
nd c
ere
als
basket price, $U
S/t
DA
P
sp
rea
d r
ela
tive
to
baske
t p
rice,%
7
Cereals basket to DAP price spread
High correlation between cereals basket and
DAP prices
High grain prices driven by market imbalances
motivate farmers to use more fertilizers
0
200
400
600
800
1,000
1,200
1,400
0 200 400 600
10 year correlation
R2=0.86
New Big Capacities:
- China +5200
- India +1700
- Australia +980
- Morocco +740
2008/09
Financial
Crisis
- Low DAP import in
India
- Potash BPC break
up
DAP FOB
Tampa (21%)
Wheat (17.2%)
Corn (6.6%)
Rice (4.6%)
Soybeans (12.6%)
Price dynamics from
the beginning of 2015
4
160
53
0
79
170
166
166
166
225
235
225
170
178
210
225
225
225
103
103
103
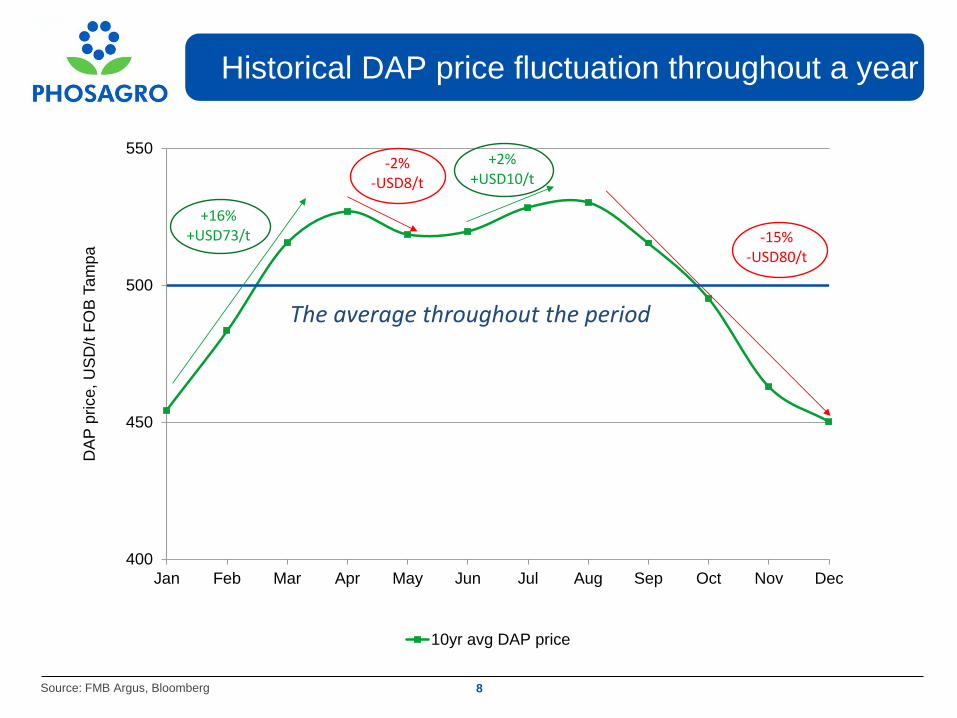
Historical DAP price fluctuation throughout a year
Source: FMB Argus, Bloomberg
8
400
450
500
550
Jan Feb Mar Apr May Jun Jul Aug Sep Oct Nov Dec
DA
P p
rice, U
SD
/t F
OB
Tam
pa
10yr avg DAP price
The average throughout the period
+16% +USD73/t
-2%-USD8/t
+2% +USD10/t
-15%-USD80/t

Fertilizer price developments
Source: Argus-FMB, S&P Capital IQ, PhosAgro analysis
Note:(*) – rebased at 1 January 2014
9
INR/USD -6%
DAP -21%
BRL/USD -34%
Urea -38%
RUB/USD -31%
MOP -18%

4
160
53
0
79
170
166
166
166
225
235
225
170
178
210
225
225
225
103
103
103
10
Source: CRU ‘
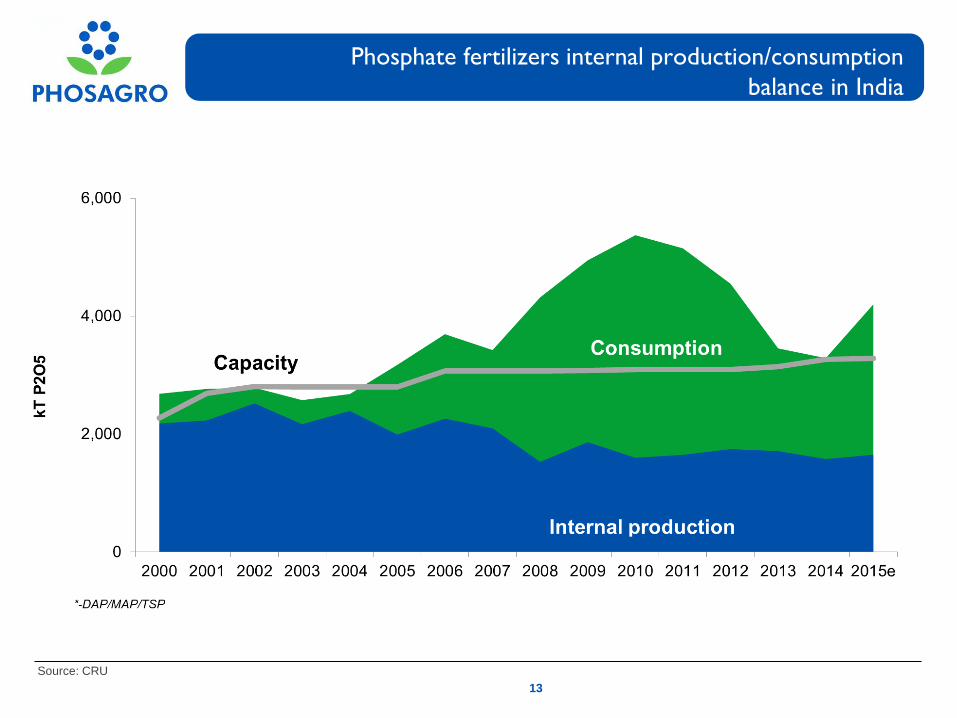
Phosphate fertilizers internal production/consumption
balance in China
4
160
53
0
79
170
166
166
166
225
235
225
170
178
210
225
225
225
103
103
103
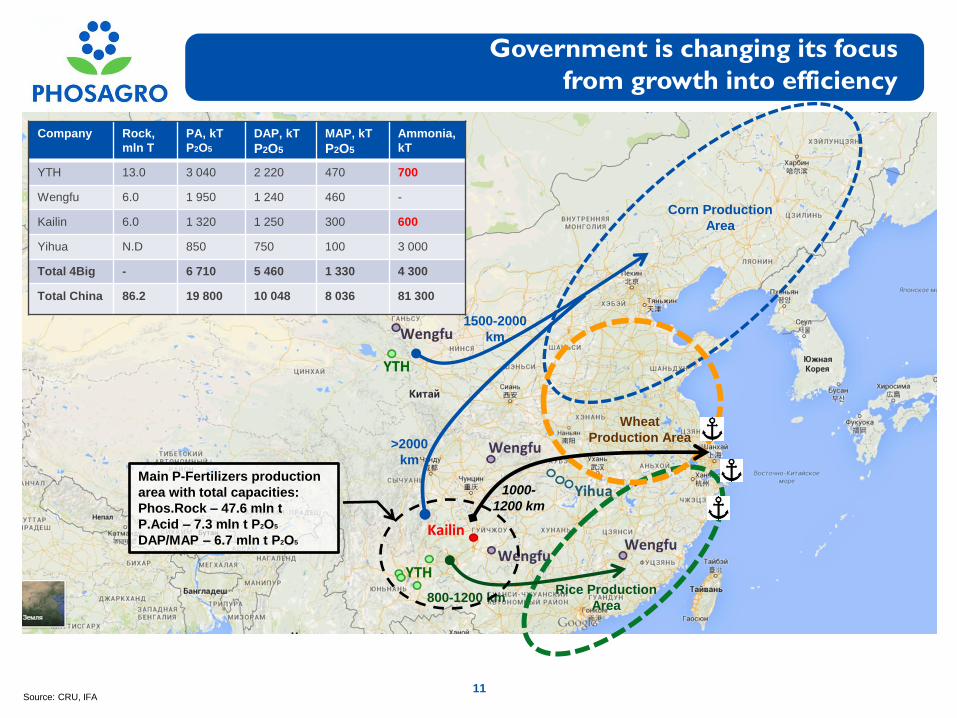
Government is changing its focus
from growth into efficiency
Corn Production
Area
Rice Production
Area
Wheat
Production Area
Company Rock,
mln T
PA, kT
P2O5
DAP, kT
P2O5
MAP, kT
P2O5
Ammonia,
kT
YTH 13.0 3 040 2 220 470 700
Wengfu 6.0 1 950 1 240 460 -
Kailin 6.0 1 320 1 250 300 600
Yihua N.D 850 750 100 3 000
Total 4Big - 6 710 5 460 1 330 4 300
Total China 86.2 19 800 10 048 8 036 81 300
1500-2000
km
800-1200 km
1000-
1200 km
Main P-Fertilizers production
area with total capacities:
Phos.Rock – 47.6 mln t
P.Acid – 7.3 mln t P2O5
DAP/MAP – 6.7 mln t P2O5
>2000
km
Source: CRU, IFA 11

4
160
53
0
79
170
166
166
166
225
235
225
170
178
210
225
225
225
103
103
103
1.8
1.9
2
2.1
2.2
2.3
1997 2002 2007 2014
Fresh water availability per capita, 1000 m³
95
100
105
110
115
120
125
1997 2002 2007 2014
Arable land, mn ha
......aiming to reduce pollution
...as well as increase yields and crop quality
Water scarcity, contamination and
pollution
Fertilizer burn
Soil pollution and cadmium
contamination
Tainted rice was discovered in several Chinese provinces
Chinese ag resources deteriorate with limited arable land
12
High
intensity
agriculture
All pollutants
from pesticides
and fertilizers
end up in soil
For
30
years
Chinese farmers use high-intensity agricultural techniques
Polluted
Cadmium
rice (Cd)
Arsenic
rice (As) Lead rice
(Pb)
... and water availability decreases
Source: FAO, Global Times
4
160
53
0
79
170
166
166
166
225
235
225
170
178
210
225
225
225
103
103
103
13
Source: CRU
Phosphate fertilizers internal production/consumption
balance in India

4
160
53
0
79
170
166
166
166
225
235
225
170
178
210
225
225
225
103
103
103
Source: IGC, CRU, FAI, USDA, WGR, PhosAgro
India’s subsidy policy: favouring urea leads to unbalanced fertilization
Evolution of N : P2O5 : K2O ratio in India India introduced a new subsidy system in 2010
14
Price Disparity, Rs/mT Consumption Disparity and Rice yield dynamic, mln t
N P2O5 K2O
Balanced ratio 4.0 2.0 1.0
2010/11 4.3 2.0 1.0
2011/12 6.9 3.1 1.0
2012/13 7.7 3.0 1.0
N P2O5 K2O
2011/12 27.153 32.338 26.756
2012/13 24.0 21.804 24.0
2013/14 20.875 18.679 18.833
2014/15 20.875 18.679 15.5
2015/16e 20.875 18.679 15.5
2015/2011 Change -23% -42% -42%
Nutrient Based Subsidy (NBS) Rates in India (Rs/kg nutrient)
5310 5310 5310
8671
18221
24000 25000
0
5000
10000
15000
20000
25000
199
0-9
1
199
1-9
2
199
2-9
3
199
3-9
4
199
4-9
5
199
5-9
6
199
6-9
7
199
7-9
8
199
8-9
9
199
9-2
00
0
200
0-0
1
200
1-0
2
200
2-0
3
200
3-0
4
200
4-0
5
200
5-0
6
200
6-0
7
200
7-0
8
200
8-0
9
200
9-1
0
201
0-1
1
201
1-1
2
201
2-1
3
201
3-1
4
201
4-1
5
201
5-1
6
UreaDAP
DAP to Urea Farm gate
Price Disparity has
increased from 1.87 to 4.4
1700
1900
2100
2300
2500
2700
2900
0
5
10
15
20
25
30
35
199
0-9
1
199
2-9
3
199
4-9
5
199
6-9
7
199
8-9
9
200
0-0
1
200
2-0
3
200
4-0
5
200
6-0
7
200
8-0
9
201
0-1
1
201
2-1
3
201
4-1
5
Kg
/Ha
mln
T
Urea DAP rice yield
395 415364
306 293207 225
246 243 378
354380 503 505
30
35
40
45
50
55
60
65
70
0
100
200
300
400
500
600
700
800
09/10 10/11 11/12 12/13 13/14 14/15 15/16
US
D/I
NR
ra
te
Su
bsid
ies, R
s b
n
P&K Subsidies, Rs bn (lhs) Urea Subsidies, Rs bn (lhs) USD/INR (rhs)
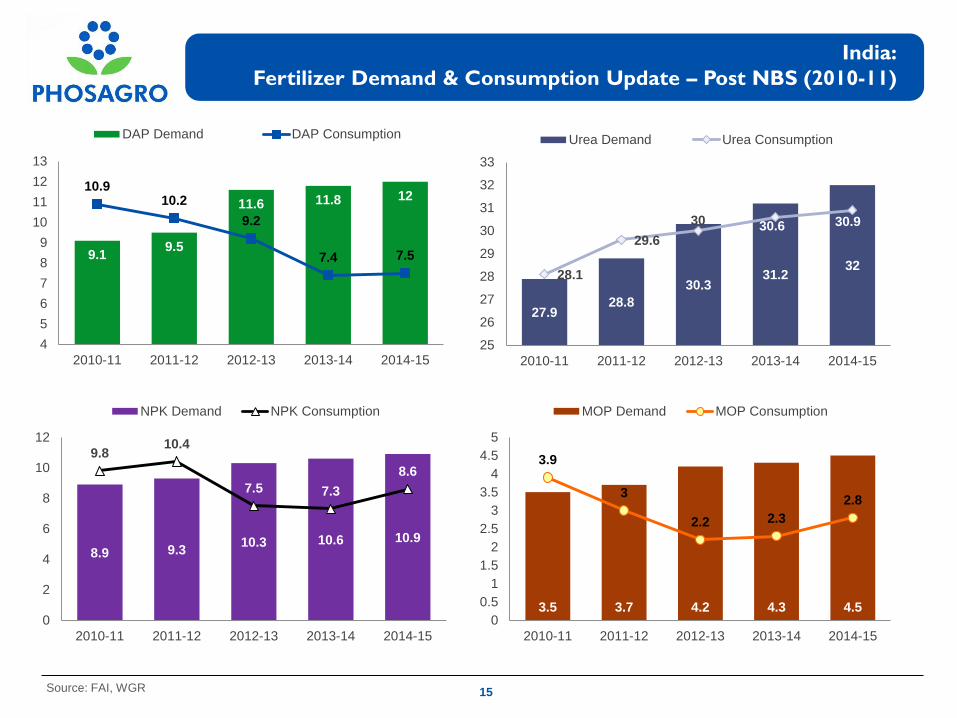
India:
Fertilizer Demand & Consumption Update – Post NBS (2010-11)
9.1 9.5
11.6 11.8 12 10.9
10.2
9.2
7.4 7.5
4
5
6
7
8
9
10
11
12
13
2010-11 2011-12 2012-13 2013-14 2014-15
DAP Demand DAP Consumption
27.9 28.8
30.3 31.2
32 28.1
29.6
30 30.6 30.9
25
26
27
28
29
30
31
32
33
2010-11 2011-12 2012-13 2013-14 2014-15
Urea Demand Urea Consumption
8.9 9.3 10.3 10.6 10.9
9.8 10.4
7.5 7.3
8.6
0
2
4
6
8
10
12
2010-11 2011-12 2012-13 2013-14 2014-15
NPK Demand NPK Consumption
3.5 3.7 4.2 4.3 4.5
3.9
3
2.2 2.3
2.8
0
0.5
1
1.5
2
2.5
3
3.5
4
4.5
5
2010-11 2011-12 2012-13 2013-14 2014-15
MOP Demand MOP Consumption
Source: FAI, WGR 15

India: Fertilizer Demand & Import – Medium Term Outlook
Source: FAI, WGR
32.9 33.7 33.8 34.5
12.2 12.4 12.8 13
11.1 11.4 11.8 12.3 4.6 4.8 4.9 5
0
10
20
30
40
50
60
70
2015-16e 2016-17e 2017-18e 2018-19e
Demand, mln T Urea DAP NPK MOP (direct sale)
10.4 11.2 11.3 12
8.7 8.9 9.3 9.5
3.1 3.4 3.8
4.3 4.6 4.8 4.9
5
0
5
10
15
20
25
30
35
2015-16e 2016-17e 2017-18e 2018-19e
Import, mln T Import Urea Import DAP Import NPK Import MOP (direct sale)
Urea Demand Growth estimated @ 2.7%
annually;
DAP, NPK, and MOP Demand estimated
to grow @ 4% annually;
DAP and Complex fertilizer consumption
to remain low due to High Price Disparity
with Urea
DAP and Complex Fertilizer sale,
however, likely to be higher than 2014-15
16

17
Source: CRU
Phosphate fertilizers internal production/consumption
balance in Brazil
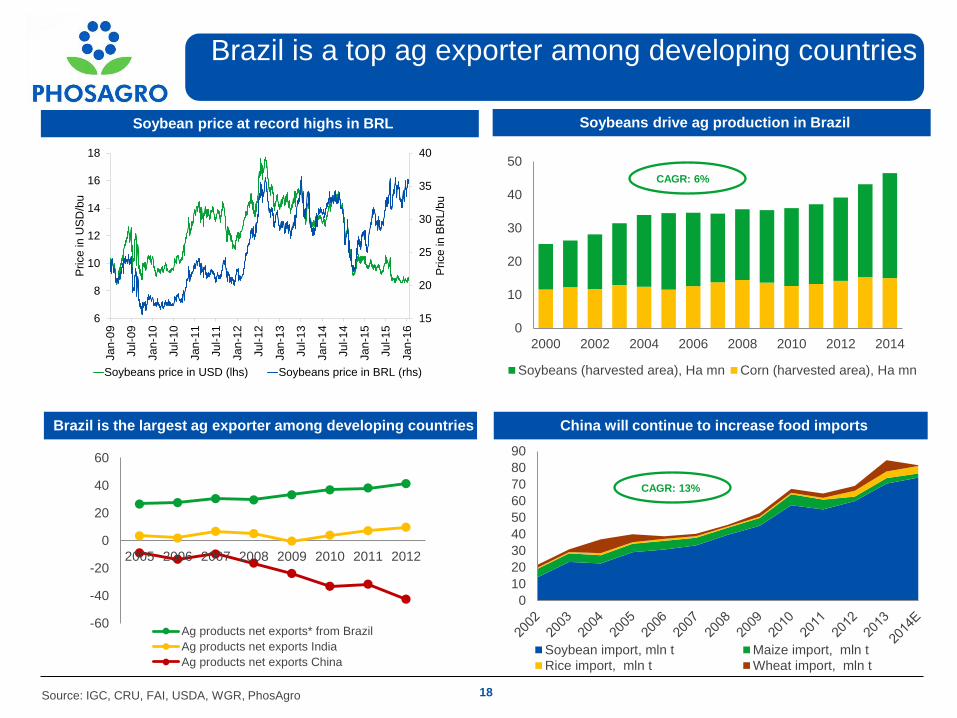
Source: IGC, CRU, FAI, USDA, WGR, PhosAgro
Brazil is a top ag exporter among developing countries
Soybeans drive ag production in Brazil Soybean price at record highs in BRL
18
Brazil is the largest ag exporter among developing countries China will continue to increase food imports
0
10
20
30
40
50
60
70
80
90
Soybean import, mln t Maize import, mln t
Rice import, mln t Wheat import, mln t
CAGR: 13%
-60
-40
-20
0
20
40
60
2005 2006 2007 2008 2009 2010 2011 2012
Ag products net exports* from Brazil
Ag products net exports India
Ag products net exports China
0
10
20
30
40
50
2000 2002 2004 2006 2008 2010 2012 2014
Soybeans (harvested area), Ha mn Corn (harvested area), Ha mn
CAGR: 6%
15
20
25
30
35
40
6
8
10
12
14
16
18
Ja
n-0
9
Ju
l-0
9
Ja
n-1
0
Ju
l-1
0
Ja
n-1
1
Ju
l-1
1
Ja
n-1
2
Ju
l-1
2
Jan
-13
Ju
l-1
3
Ja
n-1
4
Ju
l-1
4
Ja
n-1
5
Ju
l-1
5
Ja
n-1
6
Pri
ce
in
BR
L/b
u
Price
in U
SD
/bu
Soybeans price in USD (lhs) Soybeans price in BRL (rhs)
19
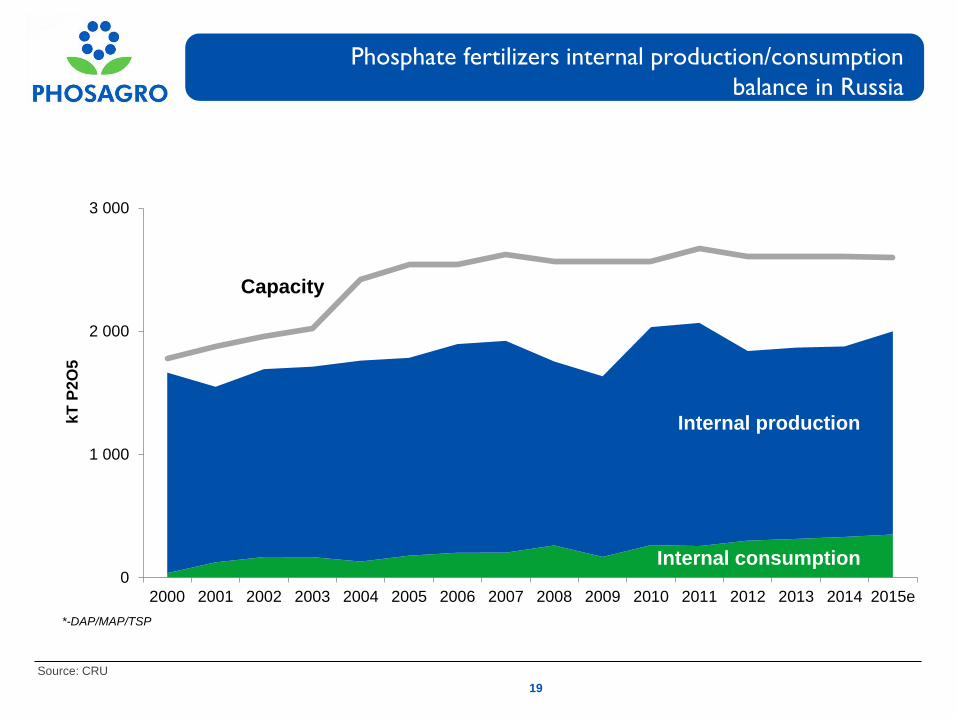
Source: CRU
Phosphate fertilizers internal production/consumption
balance in Russia
Capacity
0
1 000
2 000
3 000
2000 2001 2002 2003 2004 2005 2006 2007 2008 2009 2010 2011 2012 2013 2014 2015e
kT
P2O
5
Internal production
*-DAP/MAP/TSP
Internal consumption
4
160
53
0
79
170
166
166
166
225
235
225
170
178
210
225
225
225
103
103
103
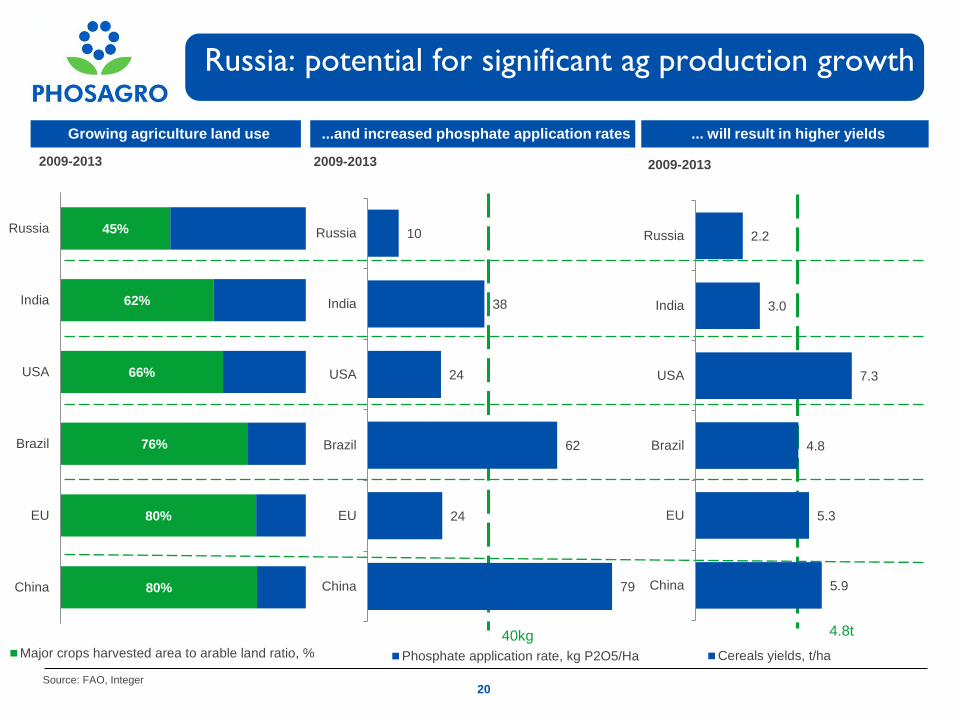
Russia: potential for significant ag production growth
20
Growing agriculture land use ... will result in higher yields ...and increased phosphate application rates
Source: FAO, Integer
2009-2013 2009-2013 2009-2013
80%
80%
76%
66%
62%
45%
China
EU
Brazil
USA
India
Russia
Major crops harvested area to arable land ratio, %
40kg 4.8t
5.9
5.3
4.8
7.3
3.0
2.2
China
EU
Brazil
USA
India
Russia
Cereals yields, t/ha
79
24
62
24
38
10
China
EU
Brazil
USA
India
Russia
Phosphate application rate, kg P2O5/Ha
21
Sales focus and
Industry developments
4
160
53
0
79
170
166
166
166
225
235
225
170
178
210
225
225
225
103
103
103
22
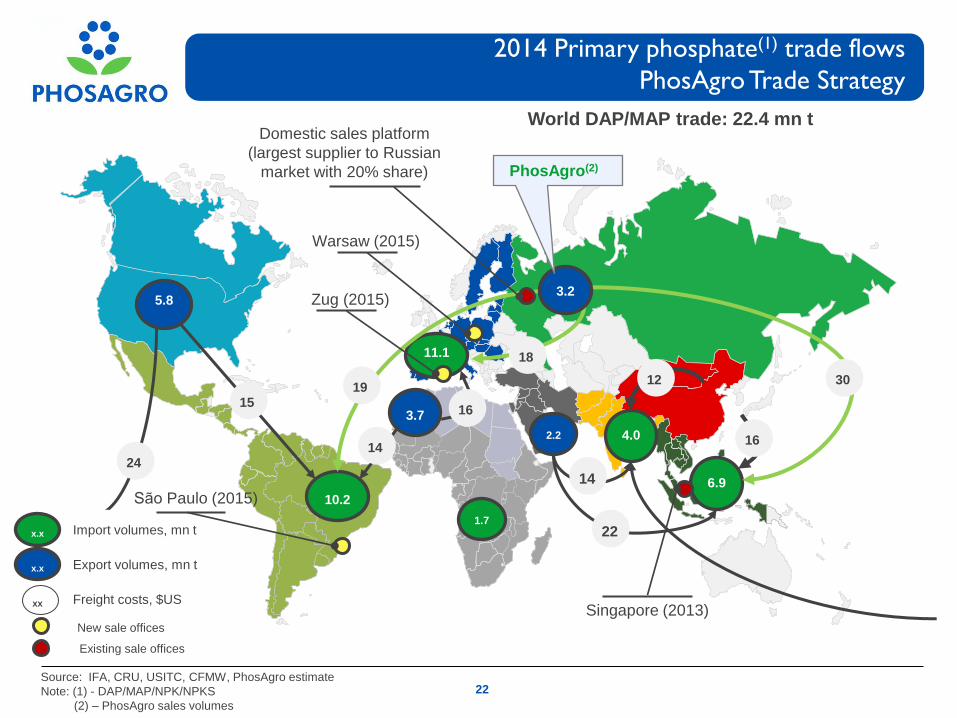
2014 Primary phosphate(1) trade flows
PhosAgro Trade Strategy
Source: IFA, CRU, USITC, CFMW, PhosAgro estimate
Note: (1) - DAP/MAP/NPK/NPKS
(2) – PhosAgro sales volumes
5.8
10.2
11.1
1.7
2.2
4.0
6.9
World DAP/MAP trade: 22.4 mn t
3.7
3.2
15
19
30
14
14
16
18
16
12
22
x.x
xx Freight costs, $US
x.x Export volumes, mn t
x.x Import volumes, mn t
24
PhosAgro(2)
Domestic sales platform
(largest supplier to Russian
market with 20% share)
São Paulo (2015)
Zug (2015)
Warsaw (2015)
Singapore (2013) New sale offices
Existing sale offices

23
Source: European Council, National Fertilizer and Environmental Research Center, Tennessee Valley; TUV
Priorities: trade restrictions vs. health
Apatit
2.05
billion tonnes of
apatite-nepheline ore
Sokli
Cadmium restrictions
Phophate
rock Cd As Pb
Russia (Kola) 0.05-0.09 0.2-0.3 0.6-0.8
South Africa 0.2 6 35
USA 11 12 12
Middle East 9 6 4
Morocco 30 11 7
Other N.Africa 60 15 6
Heavy metal content, mg/kg P2O5
Ura
ls
23
Siilinjärvi
European
countries grouped
by allowable
cadmium level
Maximum limits of cadmium
in national fertilizers
containing more than 5%
P2O5, mg/kg P2O5
Strict limits 20
Medium limits ~55
Mild limits 90
4
160
53
0
79
170
166
166
166
225
235
225
170
178
210
225
225
225
103
103
103
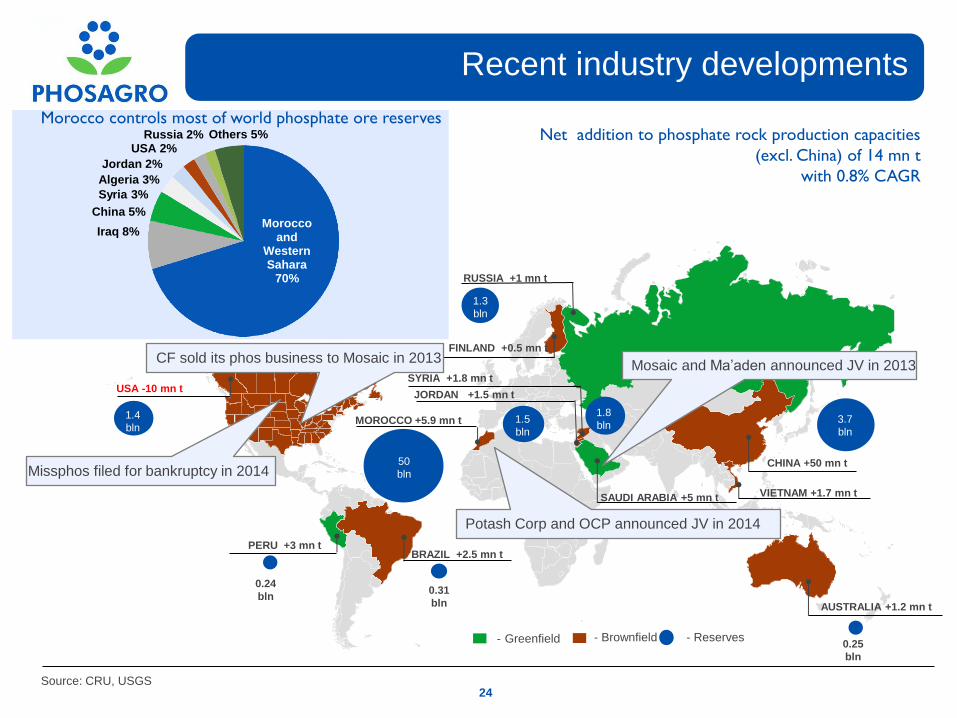
Recent industry developments
Source: CRU, USGS
- Greenfield - Brownfield - Reserves
Net addition to phosphate rock production capacities
(excl. China) of 14 mn t
with 0.8% CAGR
RUSSIA +1 mn t
1.3
bln
FINLAND +0.5 mn t
USA -10 mn t
1.4
bln MOROCCO +5.9 mn t
50
bln
BRAZIL +2.5 mn t
PERU +3 mn t
0.24
bln 0.31
bln
SYRIA +1.8 mn t
1.8
bln 1.5
bln
SAUDI ARABIA +5 mn t
CHINA +50 mn t
3.7
bln
AUSTRALIA +1.2 mn t
0.25
bln
VIETNAM +1.7 mn t
JORDAN +1.5 mn t
Morocco controls most of world phosphate ore reserves
Morocco and
Western Sahara
70%
Iraq 8%
China 5%
Algeria 3%
Syria 3%
Jordan 2%
USA 2% Russia 2% Others 5%
24
CF sold its phos business to Mosaic in 2013
Missphos filed for bankruptcy in 2014
Potash Corp and OCP announced JV in 2014
Mosaic and Ma’aden announced JV in 2013
4
160
53
0
79
170
166
166
166
225
235
225
170
178
210
225
225
225
103
103
103
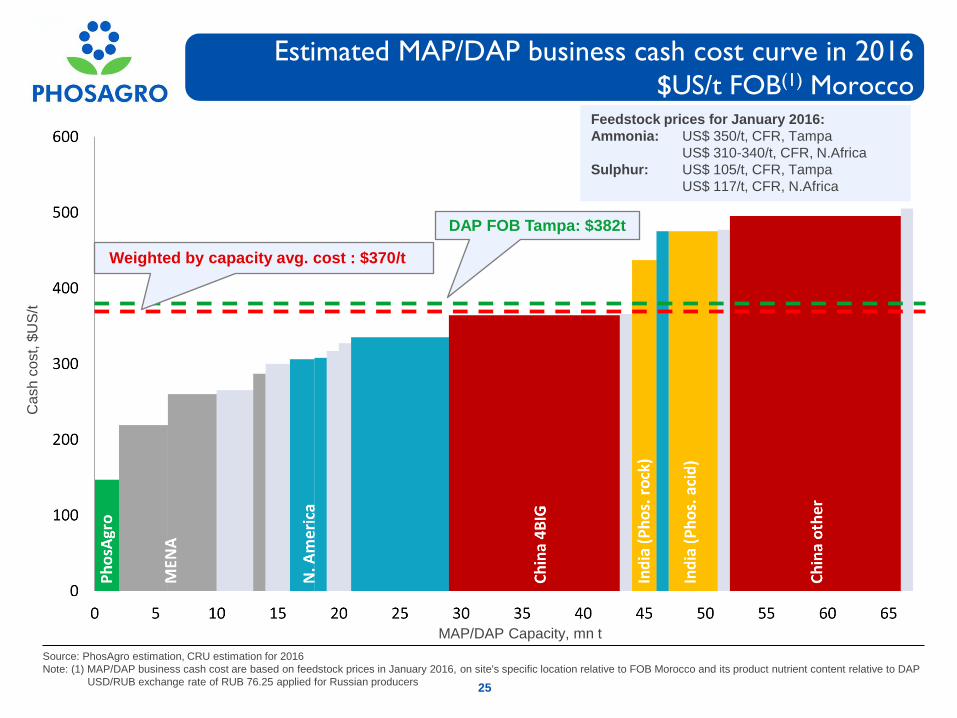
Feedstock prices for January 2016:
Ammonia: US$ 350/t, CFR, Tampa
US$ 310-340/t, CFR, N.Africa
Sulphur: US$ 105/t, CFR, Tampa
US$ 117/t, CFR, N.Africa
Estimated MAP/DAP business cash cost curve in 2016
$US/t FOB(1) Morocco
25
MAP/DAP Capacity, mn t
Source: PhosAgro estimation, CRU estimation for 2016
Note: (1) MAP/DAP business cash cost are based on feedstock prices in January 2016, on site's specific location relative to FOB Morocco and its product nutrient content relative to DAP
USD/RUB exchange rate of RUB 76.25 applied for Russian producers
DAP FOB Tampa: $382t
Ca
sh c
ost,
$U
S/t
Weighted by capacity avg. cost : $370/t

4
160
53
0
79
170
166
166
166
225
235
225
170
178
210
225
225
225
103
103
103
Estimated Urea export cash cost curve $US/t FOB(1)
Yuzhny
in Q4 2014
26
Source: PhosAgro estimates, CRU, Fertecon, IFA, Argus-FMB
Note: (1) Urea cash cost estimates are based on feedstock prices in Q1 2016
USD/RUB exchange rate of RUB 76,25 applied for calculation urea export cash cost
4
160
53
0
79
170
166
166
166
225
235
225
170
178
210
225
225
225
103
103
103
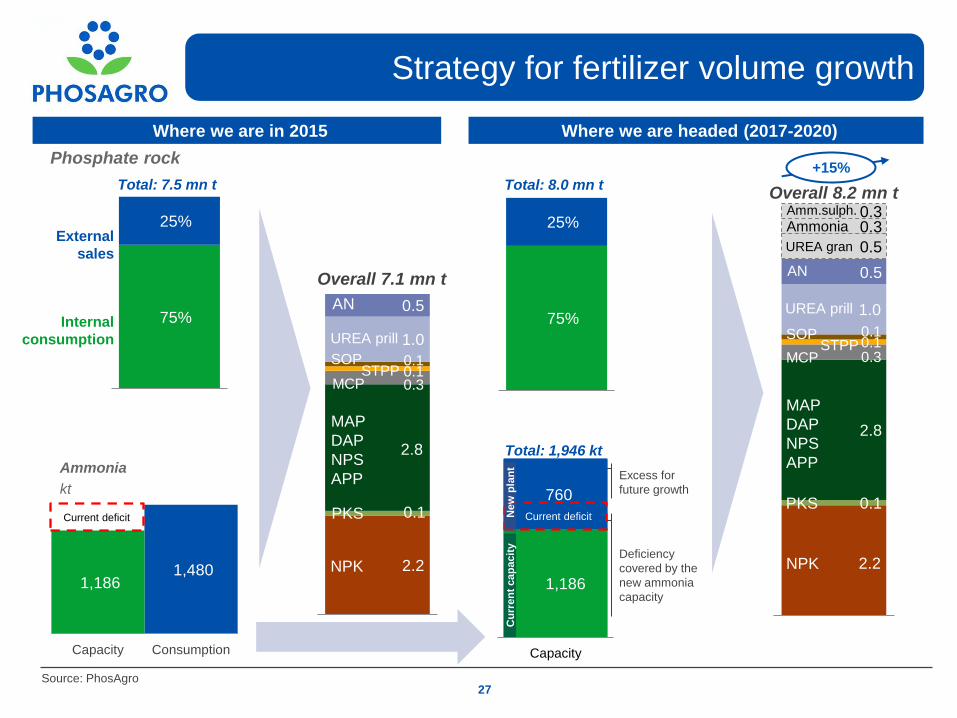
2.2
0.1
2.8
0.3 0.1 0.1
1.0
0.5
0.5
0.3 0.3
1,186 1,480
Capacity Consumption
75%
25%
Where we are in 2015
Source: PhosAgro
Phosphate rock
Strategy for fertilizer volume growth
15
External
sales
Internal
consumption
Ammonia
kt
27
Where we are headed (2017-2020)
Total: 7.5 mn t
Deficiency
covered by the
new ammonia
capacity
Excess for
future growth
75%
25%
Total: 8.0 mn t Overall 8.2 mn t
MCP
UREA prill
AN
MAP
DAP
NPS
APP
NPK
STPP SOP
UREA gran
Ammonia
Current deficit
1,186
760
Capacity
N
ew
pla
nt
Cu
rren
t cap
acit
y
Total: 1,946 kt
Current deficit
+15%
2.2
0.1
2.8
0.3 0.1 0.1
1.0
0.5
MCP
UREA prill
AN
MAP
DAP
NPS
APP
NPK
Overall 7.1 mn t
STPP SOP
PKS
Amm.sulph.
PKS

Industry Broker
Ratings

Peer valuations
#
of Analysts 19 23 21 27 17 35 34 30 14 14 15
Average Target
Price Premium 48% 48% 76% 20% 23% 29% 20% 33% 12% 24% 27%
Sources: Bloomberg (21 January 2015), PhosAgro analysis
Nitrogen 12% - 100% 34% - - 97% 11% - - 12%
Phosphates 88% 12% * 6% 24% - 2% 22% - - -
Potash - 56% - 16% - 70% 1% 67% 100% 48% 56%
Recommendations:
29
(Typically a 12 month outlook)
84%
59% 56% 54% 50% 41% 38% 35%
18% 15% 14%
16%
36% 38% 42%
31%
27%
56% 54%
36%
77% 86%
5% 6% 4% 19%
32%
6% 12%
46%
8%
Phosagro Mosaic CFindustries
Agrium Incitec K+S Yara Potash Corp Uralkali SQM ICL
Sells
Holds
Buys

4
160
53
0
79
170
166
166
166
225
235
225
170
178
210
225
225
225
103
103
103
30 Source: Bloomberg, S&P Capital IQ (as of January 28, 2016), PhosAgro analysis
Performance relative to peers
EV/EBITDA 1yr fwd
Company Current Price,
USD Mcap, $ mln
EV/EBITDA P/E Dividend yield,%
2016E 2017E 2016E 2017E 2016E 2017E
PhosAgro 11,7 4 526 5,7 4,8 7,2 6,4 6,9%* 7,8%*
International peers
Potash Corp 15,5 12 917 7,7 7,1 13,1 11,6 7,4% 7,4%
Yara Int 37,5 10 315 5,2 5,0 8,9 8,8 4,7% 5,0%
Mosaic 23,0 8 107 5,6 4,9 9,8 8,1 4,9% 5,0%
Median 6,1 5,7 10,6 9,5 5,7% 5,8%
Discount , % 8% 15% 32% 33%
P/E 1yr fwd
* - Calculated based on 50% payout ratio and FY16 and FY17 NI forecast provided by Bloomberg
0
2
4
6
8
10
12
Oct-
14
No
v-1
4
De
c-1
4
Ja
n-1
5
Fe
b-1
5
Mar-
15
Apr-
15
Ma
y-1
5
Ju
n-1
5
Ju
l-1
5
Aug
-15
Sep
-15
Oct-
15
No
v-1
5
De
c-1
5
Ja
n-1
6
PHOR LI YARA NO POT US MOS US Peers avg
0
5
10
15
20
25
Oct-
14
No
v-1
4
Dec-1
4
Ja
n-1
5
Feb-1
5
Ma
r-15
Apr-
15
Ma
y-1
5
Ju
n-1
5
Ju
l-1
5
Aug
-15
Sep
-15
Oct-
15
Nov-1
5
Dec-1
5
Ja
n-1
6
PHOR LI YARA NO POT US MOS US Peers avg
Appendix
32
Su
pp
ly –
dem
an
d b
ala
nce
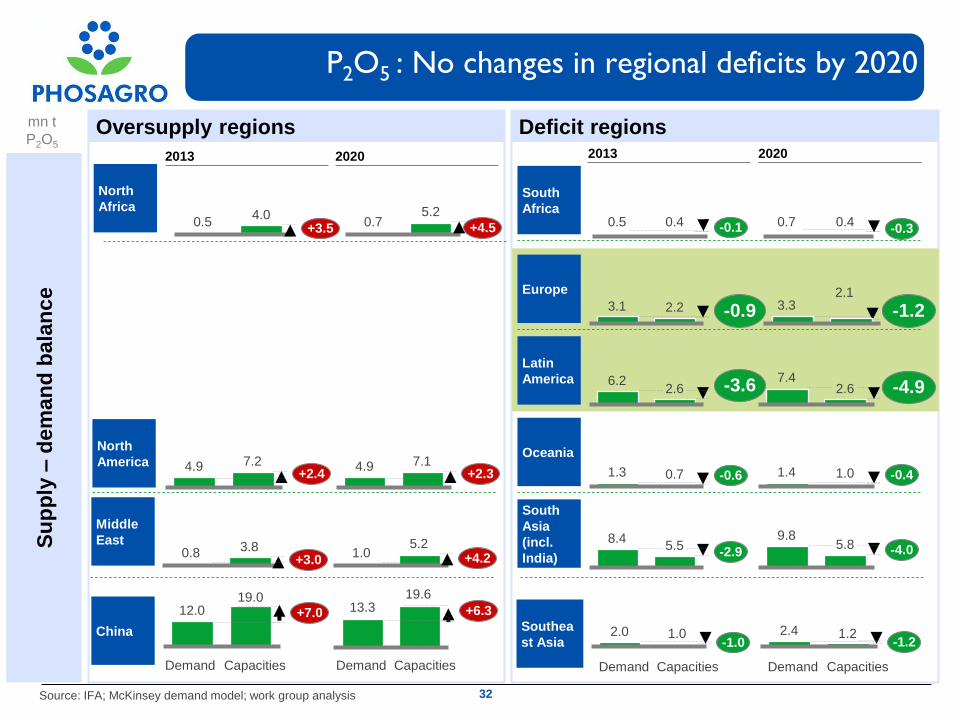
P2O5 : No changes in regional deficits by 2020
Source: IFA; McKinsey demand model; work group analysis
mn t
P2O5
North
Africa
China
Europe
Latin
America
Middle
East
North
America Oceania
2020 2013
2.6 -3.6 6.2
2.2 -0.9 3.1
+7.0 12.0 19.0
4.0 +3.5
0.5
3.8 +3.0
0.8
7.2 +2.4
Capacities Demand
4.9 0.7 -0.6 1.3
5.2
+4.5 0.7
2.6 -4.9 7.4
2.1
-1.2 3.3
+6.3 13.3
5.2 +4.2 1.0
7.1 +2.3
Capacities
Demand
4.9 1.0 -0.4 1.4
South
Asia
(incl.
India)
South
Africa
Southea
st Asia 1.0
-1.0
Capacities
Demand
2.0
5.5 -2.9
8.4
-1.2
Capacities
Demand
2.4 1.2
-4.0 5.8 9.8
Oversupply regions Deficit regions 2020 2013
0.4 -0.1 0.5 0.4 -0.3
0.7
32
19.6
4
160
53
0
79
170
166
166
166
225
235
225
170
178
210
225
225
225
103
103
103
Country China India Brazil Russia USA
Employment in agriculture, % of total 35 47 15 10 2
Rural population, mn 636 852 30 38 59
Rural population, % of total 47% 68% 15% 26% 19%
Total population, mn 1,375 1,241 197 142 312
Farm Holdings, mn 201 138 5 23 2.2
Value added in agriculture, % of GDP 10 18 6 4 < 1
Arable land per capita, ha 0.1 0.1 0.4 0.8 0.5
Water resources per capita, ‘000 m3/cap 2.1 1.6 42.2 31.5 9.9
P2O5 consumption, mn t 16.7 6.7 4.3 0.6 4.0
P2O5 consumption, % of world total 36% 15% 9% 1% 9%
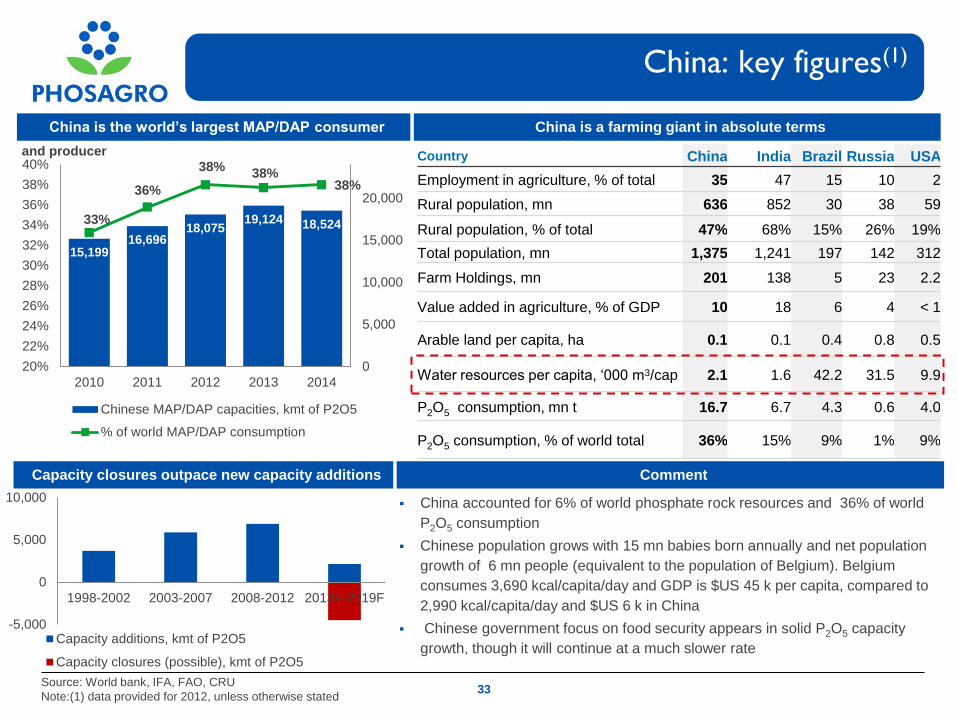
China: key figures(1)
China is a farming giant in absolute terms
33 Source: World bank, IFA, FAO, CRU
Note:(1) data provided for 2012, unless otherwise stated
Comment
China accounted for 6% of world phosphate rock resources and 36% of world
P2O5 consumption
Chinese population grows with 15 mn babies born annually and net population
growth of 6 mn people (equivalent to the population of Belgium). Belgium
consumes 3,690 kcal/capita/day and GDP is $US 45 k per capita, compared to
2,990 kcal/capita/day and $US 6 k in China
Chinese government focus on food security appears in solid P2O5 capacity
growth, though it will continue at a much slower rate
China is the world’s largest MAP/DAP consumer
Capacity closures outpace new capacity additions
and producer
15,199 16,696
18,075 19,124 18,524 33%
36%
38% 38%
38%
0
5,000
10,000
15,000
20,000
20%
22%
24%
26%
28%
30%
32%
34%
36%
38%
40%
2010 2011 2012 2013 2014
Chinese MAP/DAP capacities, kmt of P2O5
% of world MAP/DAP consumption
-5,000
0
5,000
10,000
1998-2002 2003-2007 2008-2012 2013F-2019F
Capacity additions, kmt of P2O5
Capacity closures (possible), kmt of P2O5

4
160
53
0
79
170
166
166
166
225
235
225
170
178
210
225
225
225
103
103
103
34
China exports a significant part of its p-based fertilizers to India ... and India imports correspond with China’s “export window”
Chinese exports go to India
DAP/MAP exports, mn t of P2O5
Source: CRU, FAI, IFA
Half of exports from China and Ma’aden go to India
1.1
3.2
1.6 0.7 0.5
DAP/MAP exports in 2014, mn t of P2O5
Trade volumes, mn t of P2O5
x.x Export volumes, mn t of P2O5
x.x Import volumes, mn t of P2O5
x.x
DAP imports, kt Export duty for DAP, %
50% 57% 80% 46% 15%
5% 4% 5%
10% 25%
46% 39%
15% 44%
60% 2.3 2.2
1.6
2.1
3.2
2010 2011 2012 2013 2014
India Brazil Others
0
20
40
60
80
100
120
0
200
400
600
800
1000
1200
1400
1600
Feb
-10
Ma
y-1
0A
ug-1
0N
ov-1
0F
eb
-11
Ma
y-1
1A
ug-1
1N
ov-1
1F
eb
-12
Ma
y-1
2A
ug-1
2N
ov-1
2F
eb
-13
Ma
y-1
3A
ug-1
3N
ov-1
3F
eb
-14
Ma
y-1
4A
ug-1
4N
ov-1
4F
eb
-15
Ma
y-1
5A
ug-1
5N
ov-1
5
India DAP imports, kt (lhs) China export duty, % (rhs)
13% VAT since
Sept 2015

4
160
53
0
79
170
166
166
166
225
235
225
170
178
210
225
225
225
103
103
103
Country India China Brazil Russia USA
Employment in agriculture, % of total 47 35 15 10 2
Rural population, mn 852 636 30 38 59
Rural population, % of total 68% 47% 15% 26% 19%
Total population, mn 1,241 1,375 197 142 312
Farm Holdings, mn 138 201 5 23 2.2
Value added in agriculture, % of GDP 18 10 6 4 < 1
Arable land per capita, ha 0.1 0.1 0.4 0.8 0.5
Water resources per capita, ‘000 m3/cap 1.6 2.1 42.2 31.5 9.9
P2O5 consumption, mn t 6.7 16.7 4.3 0.6 4.0
P2O5 consumption, % of world total 15% 36% 9% 1% 9%
India: key figures(1)
Rural population and ag production dominate in India
35 Source: World bank, IFA, FAO, CRU, USDA
Note:(1) data provided for 2012, unless otherwise stated
Comment
India accounted for 0% of world phosphate rock resources and 15% of world P2O5 consumption
22 mn babies are born annually in India; this is the equivalent of the entire population of Australia. Australia consumes
3,220 kcal/capita/day and GDP is $US 67 k per capita compared to 2,360 kcal/capita/day and GDP of $US 1.5 k in India
Second largest population in combination with scarcity in phosphate resource make India a major importer of phosphates
Large number of farm holdings implies their relative small size: limited access to modern farming and agronomic
technologies result in imbalanced fertilizer application
India is the second largest MAP/DAP consumer
and the world largest DAP importer
5,320 5,074 4,548
3,444 3,500
50% 48%
40%
26% 25%
0%
10%
20%
30%
40%
50%
60%
0
1000
2000
3000
4000
5000
6000
2010 2011 2012 2013 2014
India MAP/DAP consumption, mln t of P2O5
% of world total DAP imports, P2O5

4
160
53
0
79
170
166
166
166
225
235
225
170
178
210
225
225
225
103
103
103
0
500
1,000
1,500
2,000
2,500
3,000
2009/10 2010/11 2011/12 2012/13 2013/14 2014/15 2015/16
Food Indigenous urea
Imported urea P & K fertilizers
Petroleum Other subsidies
% of subsidies in Indian budget
15.8% 17.0%
18.6% 18.2%
16.3% 15.9%
13.7%
Source: CRU Fertilizer Week, Indian government, Capital IQ
India
su
bsid
ies, IN
R b
n
36
Commodity prices and Indian fertilizer subsidies
Drop in commodity prices supports budget rebalancing
- 28%
INR devaluation
$/bbl
2015/16 Budget
- 50% Brent oil
- 27% DAP
- 49% Urea
- 40% MOP
- 32% Wheat &
Rice
basket
0
100
200
300
400
500
600
700
800
0
20
40
60
80
100
120
Brent oil, $/bbl
INR/USD
Urea prilled, $/t FOB Yuzhniy
DAP FOB, $/t US Gulf/Tampa
MOP standard, $/t FOB bulk FSU (Baltic)
Wheat & Rice basket price, $/t

4
160
53
0
79
170
166
166
166
225
235
225
170
178
210
225
225
225
103
103
103
601
1,073
1,448 1,379
1,519
2,020
1,171
1,633 1,957 2,097
2,137
2,648
0
500
1000
1500
2000
2500
3000
2009 2010 2011 2012 2013 2014
MAP/DAP imports to Brazil, kT of P2O5
MAP/DAP consumption in Brazil, kT P2O5
CAGR
Country Brazil China India Russia USA
Employment in agriculture, % of total 15 35 47 10 2
Rural population, mn 30 636 852 38 59
Rural population, % of total 15% 47% 68% 26% 19%
Total population, mn 197 1,375 1,241 142 312
Farm Holdings, mn 5 201 138 23 2.2
Value added in agriculture, % of GDP 6 10 18 4 < 1
Arable land per capita, ha 0.4 0.1 0.1 0.8 0.5
Water resources per capita, ‘000 m3/cap 42.2 2.1 1.6 31.5 9.9
P2O5 consumption, mn t 4.3 16.7 6.7 0.4 4.0
P2O5 consumption, % of world total 9% 36% 15% 1% 9%
Brazil: key figures(1)
Brazil is a rising star of world ag production and P consumption
37
Source: World bank, IFA, FAO, CRU
Note:(1) data provided for 2012, unless otherwise stated
(*) Net export equals ag production exports less ag production imports
Comment
Brazil is the largest ag exporter among developing countries
Brazil accounted for 0.4% of world phosphate rock resources
and 9% of world P2O5 consumption
Agricultural exports are a key driver of Brazil ag production
growth
Growing P consumption is secured by imports
+16% +26%
-60
-40
-20
0
20
40
60
2005 2006 2007 2008 2009 2010 2011 2012
Ag products net exports* from Brazil
Ag products net exports India
Ag products net exports China
4
160
53
0
79
170
166
166
166
225
235
225
170
178
210
225
225
225
103
103
103
Country Russia China India Brazil USA
Employment in agriculture, % of total 10 35 47 15 2
Rural population, mn 38 636 852 30 59
Rural population, % of total 26% 47% 68% 15% 19%
Total population, mn 142 1,375 1,241 197 312
Farm Holdings, mn 23 201 138 5 2.2
Value added in agriculture, % of GDP 4 10 18 6 < 1
Arable land per capita, ha 0.8 0.1 0.1 0.4 0.5
Water resources per capita, ‘000 m3/cap 31.5 2.1 1.6 42.2 9.9
P2O5 consumption, mn t 0.4 16.7 6.7 4.3 4.0
P2O5 consumption, % of world total 1% 36% 15% 9% 9%
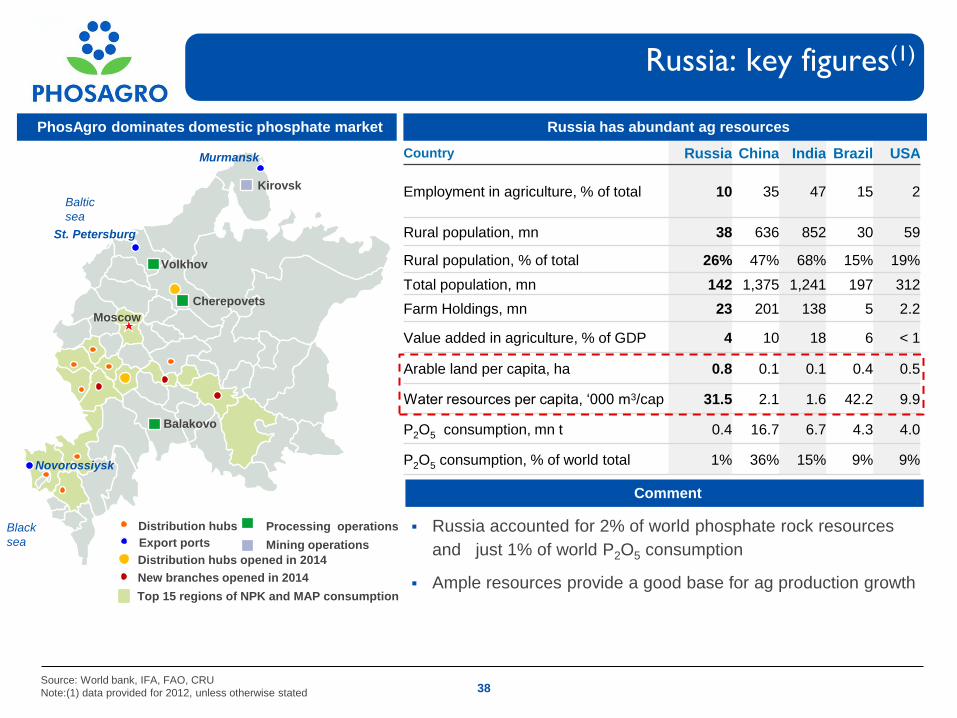
Russia: key figures(1)
Russia has abundant ag resources
38 Source: World bank, IFA, FAO, CRU
Note:(1) data provided for 2012, unless otherwise stated
Comment
PhosAgro dominates domestic phosphate market
Russia accounted for 2% of world phosphate rock resources
and just 1% of world P2O5 consumption
Ample resources provide a good base for ag production growth
Moscow
Balakovo
Cherepovets
Kirovsk
Novorossiysk
Baltic
sea
St. Petersburg
Murmansk
Distribution hubs
Export ports
Volkhov
Processing operations
Mining operations
Distribution hubs opened in 2014
Top 15 regions of NPK and MAP consumption
New branches opened in 2014
Black
sea
4
160
53
0
79
170
166
166
166
225
235
225
170
178
210
225
225
225
103
103
103
39%
34%
17% 16% 16%
PhosAgro Ma'aden PotashCorp Mosaic Agrium
87%
67%
49%
10% 11%
13%
61%
33%
51%
19%
56%
33%
10%
PhosAgro Ma'aden Mosaic Agrium PotashCorp
Phosphate Nitrogen Potash Other
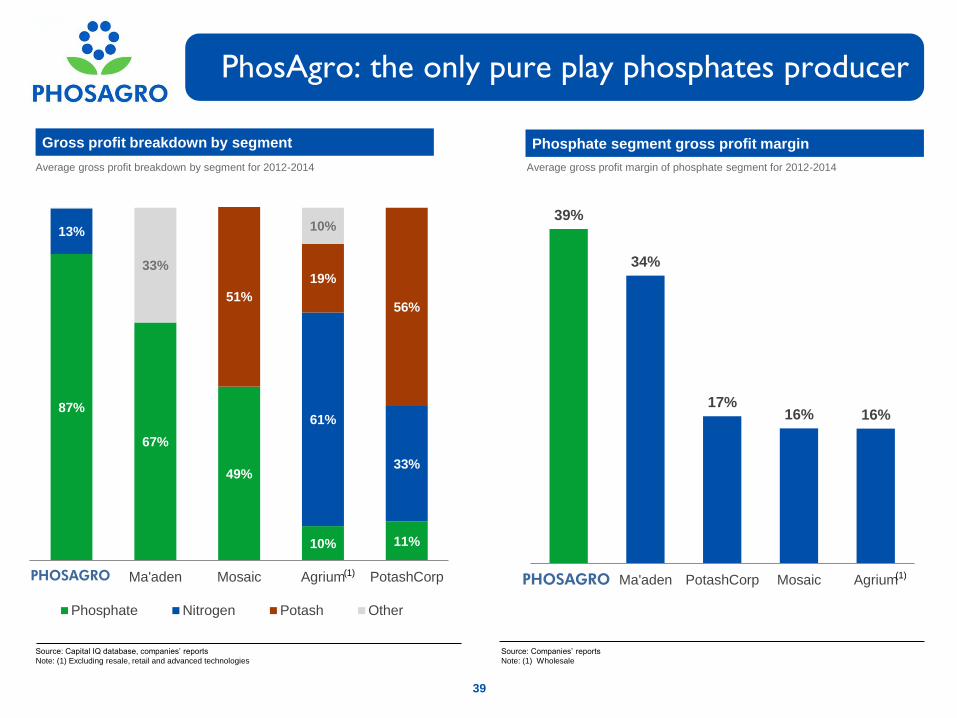
PhosAgro: the only pure play phosphates producer
Gross profit breakdown by segment Phosphate segment gross profit margin
Source: Companies’ reports
Note: (1) Wholesale
Source: Capital IQ database, companies’ reports
Note: (1) Excluding resale, retail and advanced technologies
Average gross profit margin of phosphate segment for 2012-2014 Average gross profit breakdown by segment for 2012-2014
(1)
39
(1)
4
160
53
0
79
170
166
166
166
225
235
225
170
178
210
225
225
225
103
103
103
40
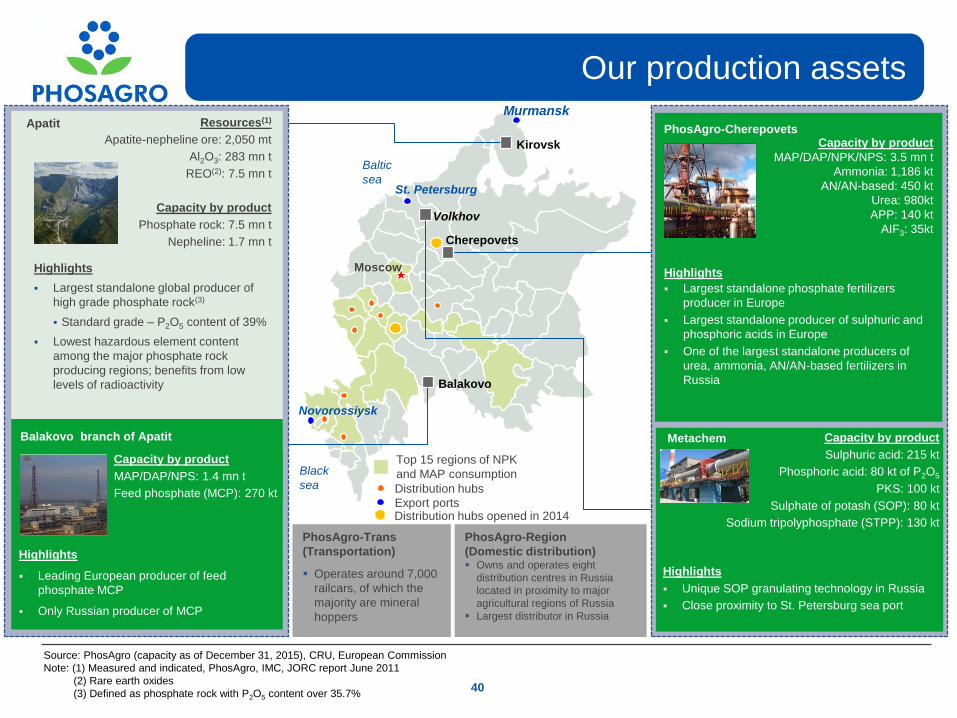
Highlights
Largest standalone global producer of
high grade phosphate rock(3)
Standard grade – P2O5 content of 39%
Lowest hazardous element content
among the major phosphate rock
producing regions; benefits from low
levels of radioactivity
Apatit Resources(1)
Apatite-nepheline ore: 2,050 mt
Al2O3: 283 mn t
REO(2): 7.5 mn t
Capacity by product
Phosphate rock: 7.5 mn t
Nepheline: 1.7 mn t
PhosAgro-Region
(Domestic distribution) Owns and operates eight
distribution centres in Russia
located in proximity to major
agricultural regions of Russia
Largest distributor in Russia
PhosAgro-Trans
(Transportation)
Operates around 7,000
railcars, of which the
majority are mineral
hoppers
Capacity by product
MAP/DAP/NPS: 1.4 mn t
Feed phosphate (MCP): 270 kt
Highlights
Leading European producer of feed
phosphate MCP
Only Russian producer of MCP
Balakovo branch of Apatit
Our production assets
Source: PhosAgro (capacity as of December 31, 2015), CRU, European Commission
Note: (1) Measured and indicated, PhosAgro, IMC, JORC report June 2011
(2) Rare earth oxides
(3) Defined as phosphate rock with P2O5 content over 35.7%
Moscow
Balakovo
Cherepovets
Kirovsk
Novorossiysk
Baltic
sea St. Petersburg
Murmansk
Distribution hubs
Export ports
Volkhov
Top 15 regions of NPK
and MAP consumption
Distribution hubs opened in 2014
Black
sea
PhosAgro-Cherepovets
Highlights
Largest standalone phosphate fertilizers
producer in Europe
Largest standalone producer of sulphuric and
phosphoric acids in Europe
One of the largest standalone producers of
urea, ammonia, AN/AN-based fertilizers in
Russia
Capacity by product
MAP/DAP/NPK/NPS: 3.5 mn t
Ammonia: 1,186 kt
AN/AN-based: 450 kt
Urea: 980kt
APP: 140 kt
AIF3: 35kt
Metachem
Highlights
Unique SOP granulating technology in Russia
Close proximity to St. Petersburg sea port
Capacity by product
Sulphuric acid: 215 kt
Phosphoric acid: 80 kt of P2O5
PKS: 100 kt
Sulphate of potash (SOP): 80 kt
Sodium tripolyphosphate (STPP): 130 kt
41
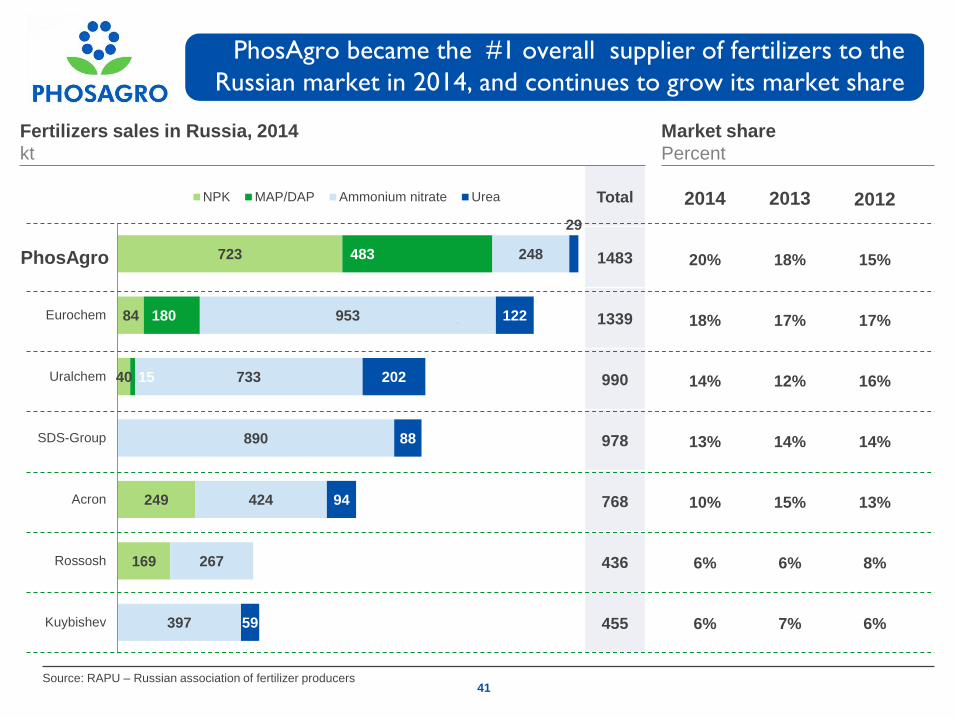
723
84
40
249
169
483
180
15
248
953
733
890
424
267
397
29
122
202
88
94
59
PhosAgro
Eurochem
Uralchem
SDS-Group
Acron
Rossosh
Kuybishev
NPK MAP/DAP Ammonium nitrate Urea 2014 2013 2012
20% 18% 15%
18% 17% 17%
14% 12% 16%
13% 14% 14%
10% 15% 13%
6% 6% 8%
6% 7% 6%
Total
1483
1339
990
978
768
436
455
PhosAgro
Market share
Percent
Fertilizers sales in Russia, 2014
kt
PhosAgro became the #1 overall supplier of fertilizers to the
Russian market in 2014, and continues to grow its market share
41 Source: RAPU – Russian association of fertilizer producers
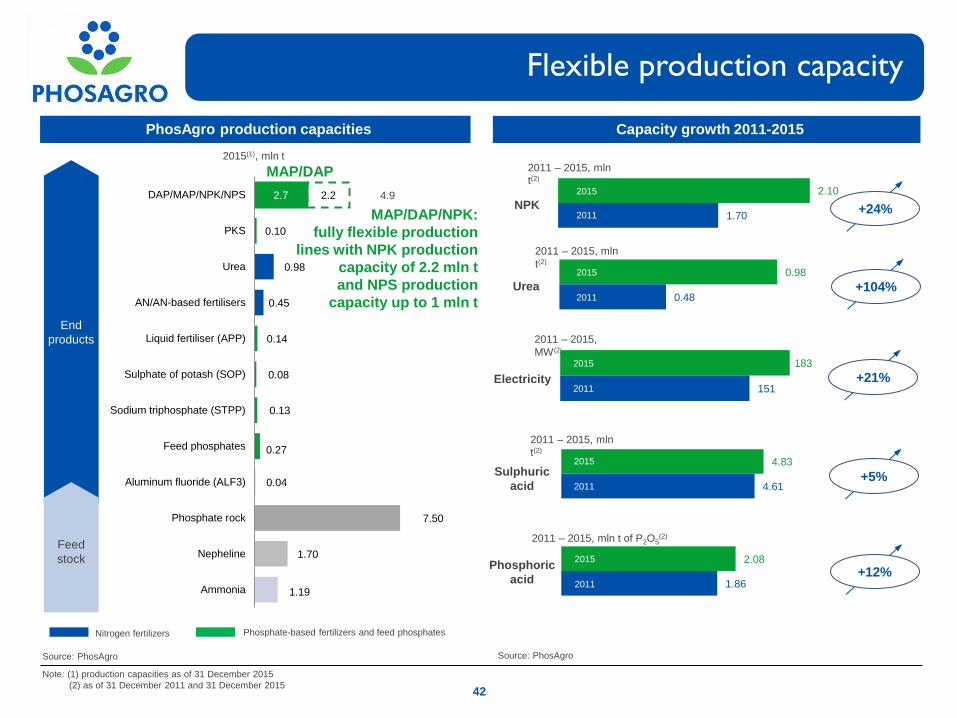
2.7
0.10
0.98
0.45
0.14
0.08
0.13
0.27
0.04
7.50
1.70
1.19
2.2 DAP/MAP/NPK/NPS
PKS
Urea
AN/AN-based fertilisers
Liquid fertiliser (APP)
Sulphate of potash (SOP)
Sodium triphosphate (STPP)
Feed phosphates
Aluminum fluoride (ALF3)
Phosphate rock
Nepheline
Ammonia
Note: (1) production capacities as of 31 December 2015
(2) as of 31 December 2011 and 31 December 2015
4.9
2015(1), mln t
Nitrogen fertilizers Phosphate-based fertilizers and feed phosphates
End
products
Feed
stock
MAP/DAP
Capacity growth 2011-2015 PhosAgro production capacities
Source: PhosAgro Source: PhosAgro
Flexible production capacity
MAP/DAP/NPK:
fully flexible production
lines with NPK production
capacity of 2.2 mln t
and NPS production
capacity up to 1 mln t
42
2.10
1.70
2011 – 2015, mln
t(2)
+24%
2015
2011
0.98
0.48 2011
2015
2011 – 2015, mln
t(2)
2011 – 2015,
MW(2)
183
151
2015
2011
NPK
Urea
Electricity
4.61
4.83 Sulphuric
acid
2011 – 2015, mln
t(2)
1.86
2.08 Phosphoric
acid
2011 – 2015, mln t of P2O5(2)
+104%
2015
2011
2015
2011
+21%
+5%
+12%

Source: PhosAgro
Note: (1) EBITDA estimations are based on January 2016 feedstock prices (ammonia, sulphur and potash)
in mln USD 2016F DAP FOB Baltic price, $/tonne
360 380 400 420 440 460 480
RUB/USD
exchange rate
60 864 949 1,033 1,117 1,201 1,285 1,370
65 946 1,030 1,114 1,198 1,282 1,367 1,451
70 1,015 1,099 1,184 1,268 1,352 1,436 1,520
75 1,076 1,160 1,244 1,328 1,412 1,497 1,581
80 1,128 1,213 1,297 1,381 1,465 1,549 1,634
85 1,175 1,259 1,343 1,428 1,512 1,596 1,680
RUB devaluation: EBITDA sensitivity(1)
EB
ITD
A, $
US
mn
DAP, $US
0
200
400
600
800
1,000
1,200
1,400
1,600
360 380 400 420 440 460 480
RUB/USD: 85 RUB/USD: 60
43
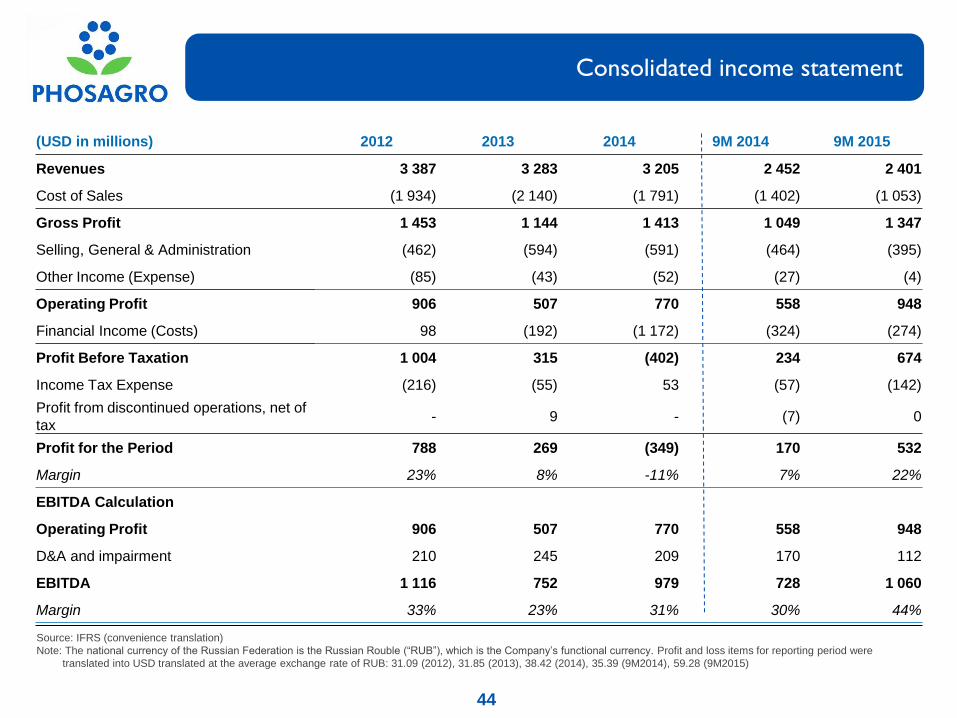
Consolidated income statement
Source: IFRS (convenience translation)
Note: The national currency of the Russian Federation is the Russian Rouble (“RUB”), which is the Company’s functional currency. Profit and loss items for reporting period were
translated into USD translated at the average exchange rate of RUB: 31.09 (2012), 31.85 (2013), 38.42 (2014), 35.39 (9M2014), 59.28 (9M2015)
25 44
(USD in millions) 2012 2013 2014 9M 2014 9M 2015
Revenues 3 387 3 283 3 205 2 452 2 401
Cost of Sales (1 934) (2 140) (1 791) (1 402) (1 053)
Gross Profit 1 453 1 144 1 413 1 049 1 347
Selling, General & Administration (462) (594) (591) (464) (395)
Other Income (Expense) (85) (43) (52) (27) (4)
Operating Profit 906 507 770 558 948
Financial Income (Costs) 98 (192) (1 172) (324) (274)
Profit Before Taxation 1 004 315 (402) 234 674
Income Tax Expense (216) (55) 53 (57) (142)
Profit from discontinued operations, net of
tax - 9 - (7) 0
Profit for the Period 788 269 (349) 170 532
Margin 23% 8% -11% 7% 22%
EBITDA Calculation Operating Profit 906 507 770 558 948
D&A and impairment 210 245 209 170 112
EBITDA 1 116 752 979 728 1 060
Margin 33% 23% 31% 30% 44%
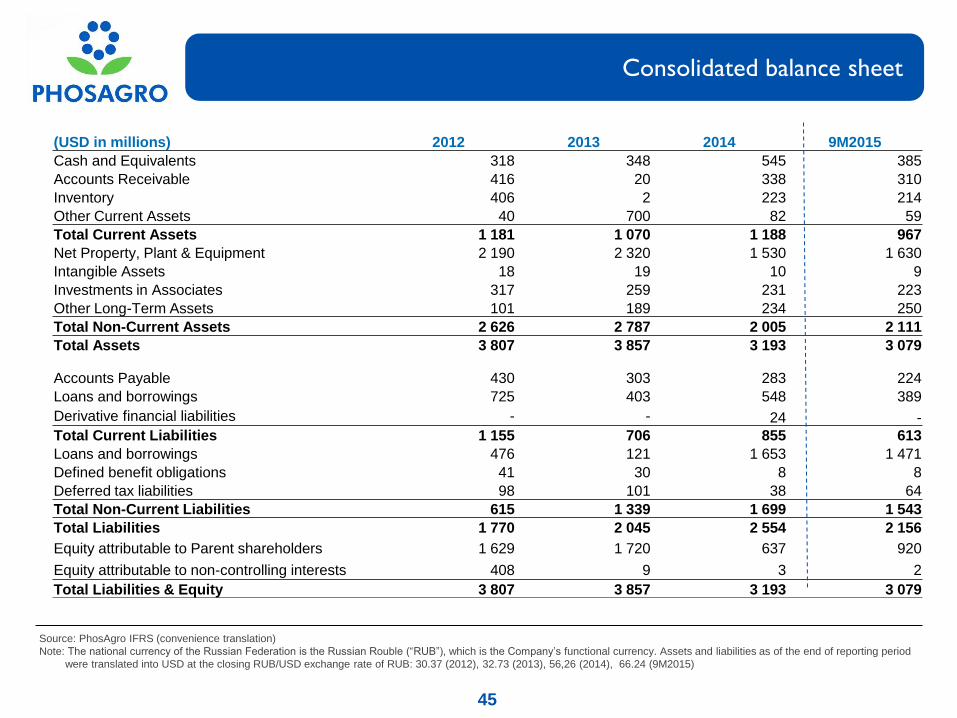
Consolidated balance sheet
Source: PhosAgro IFRS (convenience translation)
Note: The national currency of the Russian Federation is the Russian Rouble (“RUB”), which is the Company’s functional currency. Assets and liabilities as of the end of reporting period
were translated into USD at the closing RUB/USD exchange rate of RUB: 30.37 (2012), 32.73 (2013), 56,26 (2014), 66.24 (9M2015)
26 45
(USD in millions) 2012 2013 2014 9M2015
Cash and Equivalents 318 348 545 385
Accounts Receivable 416 20 338 310
Inventory 406 2 223 214
Other Current Assets 40 700 82 59
Total Current Assets 1 181 1 070 1 188 967
Net Property, Plant & Equipment 2 190 2 320 1 530 1 630
Intangible Assets 18 19 10 9
Investments in Associates 317 259 231 223
Other Long-Term Assets 101 189 234 250
Total Non-Current Assets 2 626 2 787 2 005 2 111
Total Assets 3 807 3 857 3 193 3 079
Accounts Payable 430 303 283 224
Loans and borrowings 725 403 548 389
Derivative financial liabilities - - 24 -
Total Current Liabilities 1 155 706 855 613
Loans and borrowings 476 121 1 653 1 471
Defined benefit obligations 41 30 8 8
Deferred tax liabilities 98 101 38 64
Total Non-Current Liabilities 615 1 339 1 699 1 543
Total Liabilities 1 770 2 045 2 554 2 156
Equity attributable to Parent shareholders 1 629 1 720 637 920
Equity attributable to non-controlling interests 408 9 3 2
Total Liabilities & Equity 3 807 3 857 3 193 3 079

Consolidated cash flow statement
Source: IFRS (convenience translation)
Note: The national currency of the Russian Federation is the Russian Rouble (“RUB”), which is the Company’s functional currency. Cash flow items for reporting period were
translated into USD translated at the average exchange rate of RUB: 31.09 (2012), 31.85 (2013), 38.42 (2014), 35.39 (9M2014), 59.28 (9M2015) 27 46
(USD in millions) 2012 2013 2014 9M 2014 9M 2015
Profit before taxation 1 004 315 (402) 234 674
Depreciation, amortisation + reversal of impairment loss 210 245 209 170 112
Finance Costs 47 71 302 75 77
Finance Income (67) (36) (28) (18) (17)
Other (60) 104 938 259 223
Operating Profit before changes in Working Capital and
Provisions 1 134 700 1 020 720 1 069
(Inc.) Dec. in Trade and other Receivables (10) 48 (187) (2) (25)
(Inc.) Dec. in Inventory (59) 4 (3) 36 (27)
Inc. (Dec.) in Trade and other Payables 29 (26) 56 (21) 6
(Inc.) Dec. in Net Working Capital (40) 26 (134) 14 (46)
Cash flows from operations before income taxes and interest paid 1 094 726 886 734 1 023
Income tax paid (229) (103) (100) (83) (86)
Finance costs paid (46) (60) (70) (45) (79)
Cash Flow From Operating activities 819 563 716 606 858
Loans repaid/(issued) (5) 25 (24) (14) 4
Acquisition of property, plant and equipment (430) (559) (535) (339) (514)
Acquisition of investments (1) - - - -
Other 31 44 32 20 13
Cash Flows used in Investing Activities (404) (490) (526) (332) (497)
Proceeds from borrowings 687 1 493 1 859 886 522
Repayment of borrowings (513) (1 161) (1 123) (592) (782)
Dividends paid (394) (236) (149) (75) (181)
Other (425) (208) (368) (189) (54)
Cash Flows used in Financing Activities (644) (111) 219 30 (495)
Net decrease/increase in Cash and Equivalents (229) (38) 409 304 (134)
Cash and Equivalents at beginning of the year/period 526 318 348 348 545
Effect of exchange rate fluctuations 14 16 157 25 46
Forex in cash 7 52 (368) (154) (73)
Cash and Equivalents at the end of the year/period 318 348 545 523 385
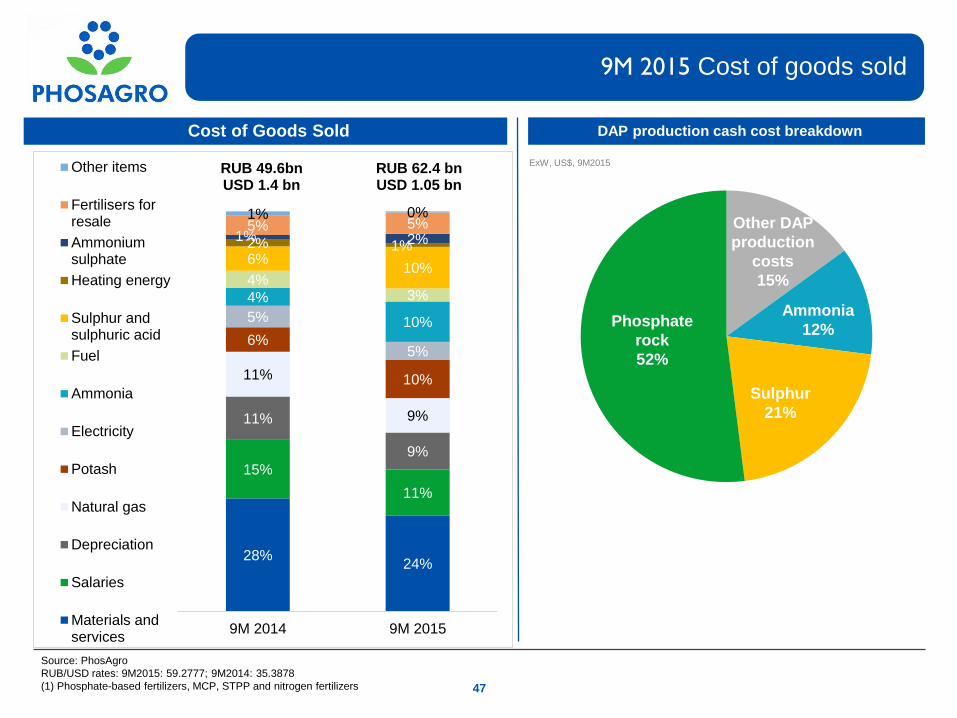
9M 2015 Cost of goods sold
47
Source: PhosAgro
RUB/USD rates: 9M2015: 59.2777; 9M2014: 35.3878
(1) Phosphate-based fertilizers, MCP, STPP and nitrogen fertilizers
Cost of Goods Sold DAP production cash cost breakdown
ExW, US$, 9M2015
Other DAP
production
costs
15%
Phosphate
rock
52%
Sulphur
21%
Ammonia
12%
28%24%
15%
11%
11%
9%
11%
9%
6%
10%
5%
5%
4%
10%
4%3%
6%10%
2% 1%1% 2%
5% 5%1% 0%
9M 2014 9M 2015
Other items
Fertilisers forresale
Ammoniumsulphate
Heating energy
Sulphur andsulphuric acid
Fuel
Ammonia
Electricity
Potash
Natural gas
Depreciation
Salaries
Materials andservices
RUB 49.6bnUSD 1.4 bn
RUB 62.4 bnUSD 1.05 bn
4,362 3,663 3,583 4,117 4,144 5,270 3,483 4,843
3,156 3,623 2,190 4,542 5,275 4,007
2,135
12,162 3,572 3,378
1,503 1,086
3,528 5,112
6,405
10,199
603 688 3,756
2,030 1,741
4,380
916 388
1,070
4,116
15,598
7,429
512 1,525 956 1,206
3,779
2,044
1,129
2,756
12,353
12,206 13,040 12,905 13,370
17,795
20,549
42,844 41,770
2009 2010 2011 2012 2013 2014 9M2015/2015E
2016F
Maintenace Mining and beneficiation Phosphate fertilizers production Urea production
Ammonia capacity expansion Other Q4 2015E EBITDA
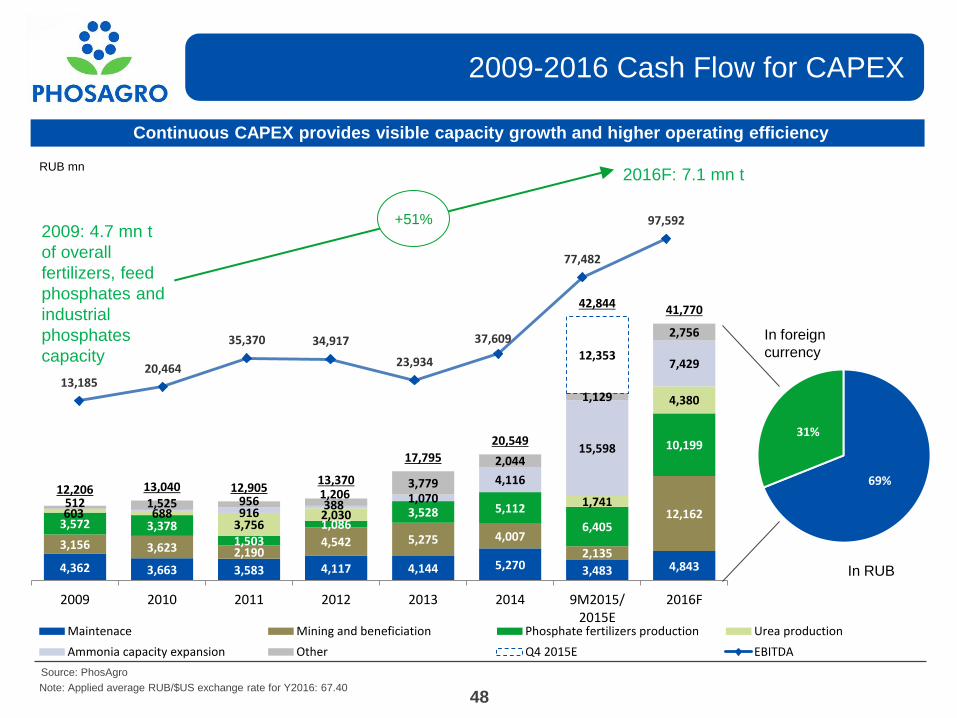
48
2009-2016 Cash Flow for CAPEX
Continuous CAPEX provides visible capacity growth and higher operating efficiency
Source: PhosAgro
RUB mn
2016F: 7.1 mn t
Note: Applied average RUB/$US exchange rate for Y2016: 67.40
2009: 4.7 mn t
of overall
fertilizers, feed
phosphates and
industrial
phosphates
capacity
13,185 20,464
35,370 34,917
23,934
37,609
77,482
97,592 +51%
69%
31%
In foreign
currency
In RUB

Source: PhosAgro
Note: (*) - for recommended dividend for 3Q 2015 per GDR applied USD/RUB exchange rate 66.6343 (as of 16.11.2015)
Dividend history
Dividends
Post-IPO dividends
paid
Dividends,
RUB bln
Net profit attributable to
PhosAgro shareholders,
RUB bln
Payout ratio, %
2011 (April-December) 7.2 14.6 49%
2012 10.4 21.3 49%
2013 4.5 7.6 59%
2014 7.8 13.6 57%
1H2015 13.6 27.7 49%
Total 43.5 84.8 51%
Total paid
Post-IPO dividends per share, RUB per GDR, RUB per GDR, US$
2011 April-December 57.50 19.17 0.61
2012 82.90 27.63 0.88
2013 34.75 11.58 0.35
2014 45.00 14,97 0,29
1Q2015 48.00 16.00 0.31
2Q2015 57.00 19.00 0.29
3Q2015 63.00 21.00 0.32
Subtotal for 2015 168.00 56.00 0.92
49
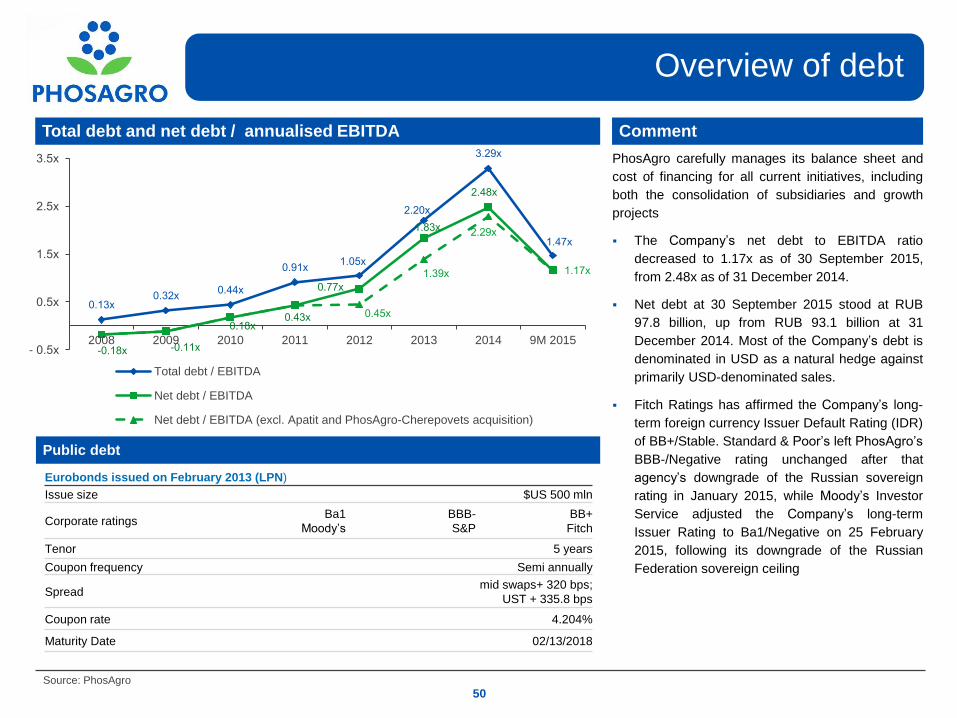
Total debt and net debt / annualised EBITDA
Overview of debt
Comment
Dividends
PhosAgro carefully manages its balance sheet and
cost of financing for all current initiatives, including
both the consolidation of subsidiaries and growth
projects
The Company’s net debt to EBITDA ratio
decreased to 1.17x as of 30 September 2015,
from 2.48x as of 31 December 2014.
Net debt at 30 September 2015 stood at RUB
97.8 billion, up from RUB 93.1 billion at 31
December 2014. Most of the Company’s debt is
denominated in USD as a natural hedge against
primarily USD-denominated sales.
Fitch Ratings has affirmed the Company’s long-
term foreign currency Issuer Default Rating (IDR)
of BB+/Stable. Standard & Poor’s left PhosAgro’s
BBB-/Negative rating unchanged after that
agency’s downgrade of the Russian sovereign
rating in January 2015, while Moody’s Investor
Service adjusted the Company’s long-term
Issuer Rating to Ba1/Negative on 25 February
2015, following its downgrade of the Russian
Federation sovereign ceiling
Source: PhosAgro
Public debt
Eurobonds issued on February 2013 (LPN)
Issue size $US 500 mln
Corporate ratings Ba1
Moody’s
BBB-
S&P
BB+
Fitch
Tenor 5 years
Coupon frequency Semi annually
Spread mid swaps+ 320 bps;
UST + 335.8 bps
Coupon rate 4.204%
Maturity Date 02/13/2018
50
0.13х 0.32х
0.44х
0.91х 1.05х
2.20х
3.29х
1.47х
-0.18х -0.11х
0.18х 0.43х
0.77х
1.83х
2.48х
0.45х
1.39х
2.29х
1.17х
- 0.5х
0.5х
1.5х
2.5х
3.5х
2008 2009 2010 2011 2012 2013 2014 9M 2015
Total debt / EBITDA
Net debt / EBITDA
Net debt / EBITDA (excl. Apatit and PhosAgro-Cherepovets acquisition)
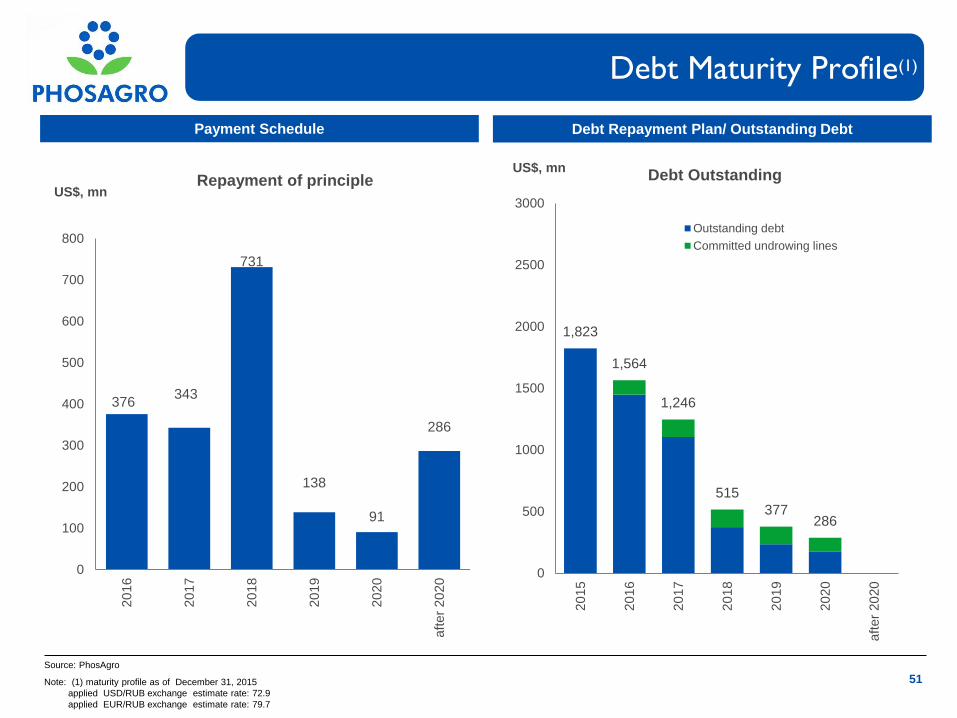
Debt Maturity Profile(1)
51
Payment Schedule Debt Repayment Plan/ Outstanding Debt
51 Note: (1) maturity profile as of December 31, 2015
applied USD/RUB exchange estimate rate: 72.9
applied EUR/RUB exchange estimate rate: 79.7
Source: PhosAgro
1,823
1,564
1,246
515
377 286
0
500
1000
1500
2000
2500
3000
20
15
20
16
20
17
20
18
20
19
20
20
aft
er
20
20
US$, mn Debt Outstanding
Outstanding debt
Committed undrowing lines
376 343
731
138
91
286
0
100
200
300
400
500
600
700
800
20
16
20
17
20
18
20
19
20
20
aft
er
20
20
US$, mn Repayment of principle

0
1
10
100
0.00 0.02 0.04 0.06 0.08 0.10 0.12 0.14
Control of world’s premium phosphate resource base
Note: Size of the bubble represents P2O5 content in phosphate rock in excess of 28%, which is recognized as a minimum for production of high quality phosphate fertilizers
Source: FERTECON, PhosAgro, companies’ data
9
Avera
ge C
ad
miu
m c
on
ten
t in
pp
m
Average Minor Element Ratio (MER)
GCT
PCS
OCP
Eurochem
CF Industries
Agrium
Phosphate rock
with MER > 0.10
significantly
increases costs for
production of
DAP
Mosaic
33%
32%
29%
28.5%
29% 29.5%
39–40% 37–38%
0
1
10
100
0.00 0.02 0.04 0.06 0.08 0.10 0.12 0.14
Higher cadmium
content in
sedimentary
rocks
52

53
Source: CRU ‘Phosphate Rock Cost Report’ 2014 edition
Premium/discount to the most affordable Moroccan
phosphate rock
China USA Morocco Others
High grade phosphate rock
Apatit (PhosAgro) Phosphate ore affects production costs associated with impurities
The benchmark: K10 phosphate rock, made by OCP (Morocco)
Important characteristics included:P2O5 content, CaO content, MER, F and Cl
Important characteristics not included: product variability, content of organic
matter, and the maintenance cost implications of different rock characteristics.
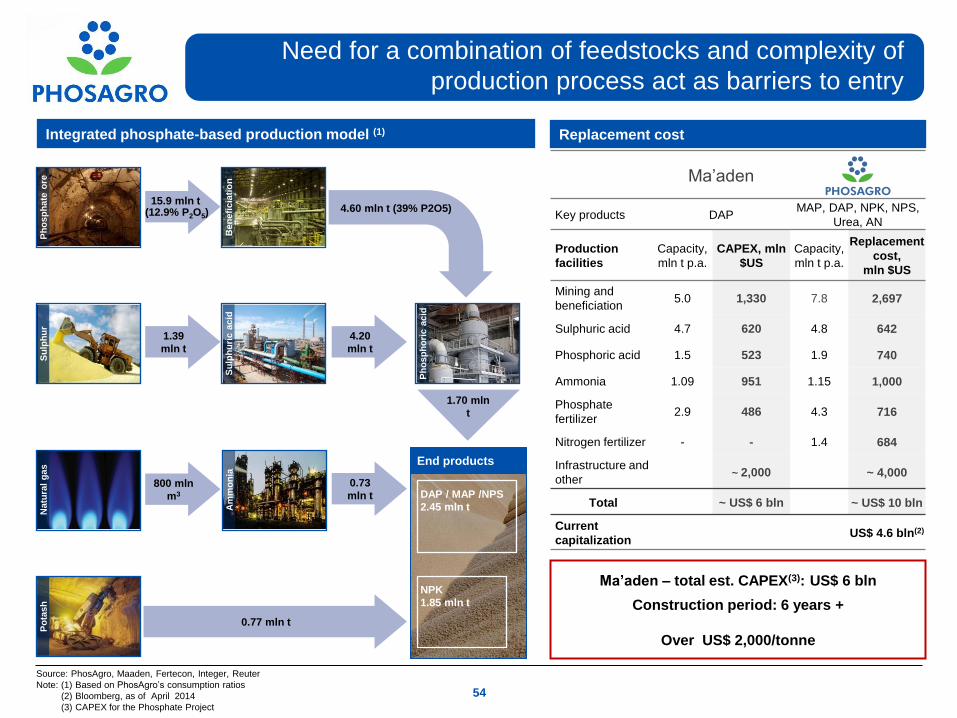
Need for a combination of feedstocks and complexity of
production process act as barriers to entry
1.39
mln t
15.9 mln t
800 mln
m3
0.73
mln t
1.70 mln
t
Source: PhosAgro, Maaden, Fertecon, Integer, Reuter
Note: (1) Based on PhosAgro’s consumption ratios
(2) Bloomberg, as of April 2014
(3) CAPEX for the Phosphate Project
Integrated phosphate-based production model (1)
0.77 mln t
4.60 mln t (39% P2O5)
NPK
1.85 mln t
End products
4.20
mln t
DAP / MAP /NPS
2.45 mln t
54
Ph
osp
hate
ore
S
ulp
hu
r N
atu
ral
gas
P
ota
sh
Ben
efi
cia
tio
n
Su
lph
uri
c a
cid
A
mm
on
ia
Ph
osp
ho
ric a
cid
(12.9% P2O5)
Ma’aden – total est. CAPEX(3): US$ 6 bln
Construction period: 6 years +
Over US$ 2,000/tonne
Ma’aden
Key products DAP MAP, DAP, NPK, NPS,
Urea, AN
Production
facilities
Capacity,
mln t p.a.
CAPEX, mln
$US
Capacity,
mln t p.a.
Replacement
cost,
mln $US
Mining and
beneficiation 5.0 1,330 7.8 2,697
Sulphuric acid 4.7 620 4.8 642
Phosphoric acid 1.5 523 1.9 740
Ammonia 1.09 951 1.15 1,000
Phosphate
fertilizer 2.9 486 4.3 716
Nitrogen fertilizer - - 1.4 684
Infrastructure and
other ~ 2,000 ~ 4,000
Total ~ US$ 6 bln ~ US$ 10 bln
Current
capitalization US$ 4.6 bln(2)
Replacement cost

4
160
53
0
79
170
166
166
166
225
235
225
170
178
210
225
225
225
103
103
103
Commissioning phosphate rock and phosphoric acid capacities
Delays in commissioning phosphoric acid capacities (excl.
China)
Delays in addition of new phosphate rock capacities (excl. China) Changes in world fertilizer capacities (excl. China)
Source: IFA, PhosAgro
Less new projects are announced in phosphates
Commissioning of new capacities is delayed
Shutdown in phosphate fertilizer capacities was more
significant while less new commissioning in the past 5
years in comparison with nitrogen and potash sectors
55
120
130
140
150
160
170
2010 2011 2012 2013 2014 2015 2016 2017 2018 2019
mln t
IFA 2010 IFA 2015
5 years
-5
0
5
10
15
20
25
2004-2009 2009-2014 2014-2019
mln t nutrients
Nitrogen Phosphates Potash
30
32
34
36
38
40
2010 2011 2012 2013 2014 2015 2016 2017 2018 2019
mln t P2O5
IFA 2010 IFA 2015
5 years

4
160
53
0
79
170
166
166
166
225
235
225
170
178
210
225
225
225
103
103
103
41.9
54.8 50.3
45.6
-4.5
1.8 1.5
1.3 3.3
4.6
3.3
Utilization
rate of 76%
Utilization
rate of 83%
Timing and completion of new capacities is uncertain
Total
Production
2014
Total
Capacities
2014
Closures
2014-2019
USA, China
OCP firm
2014-2019
Total
Expected
Capacities
2019
Total
Expected
Production
2019
56 Source: CRU, companies’ data
mln t of P2O5
OCP seeks to extract the
maximum value from its
phosphate ore reserve.
Management has recently
indicated that they will match
production to market demand
Joint Venture Mosaic
and Ma’aden estimated
cost USD 7 bln
Ma’aden II
2016-2018
Other firm
projects
Probable/
Speculative
projects

57
Thank you!