presentation - macquarie bank
TRANSCRIPT
Macquarie Group Limited
Presentation to Investors and Analysts
18-22 March 2013
Patrick Upfold, Chief Financial Officer
Stuart Green, Head of Corporate Communications and Investor Relations
Credit Suisse 16th Asian Investment Conference
Conrad Hotel, Hong Kong

2
Disclaimer This information has been prepared on a strictly confidential basis by Macquarie Group Limited ABN 94 122 169 279 (“Macquarie”) and may neither be reproduced in whole nor in part, nor may any of its contents be
divulged to any third party without the prior written consent of Macquarie. Other than Macquarie Bank Limited ABN 46 008 583 542 (Macquarie), any Macquarie group entity noted in this document is not an authorised
deposit-taking institution for the purposes of the Banking Act 1959 (Commonwealth of Australia). That entity‟s obligations do not represent deposits or other liabilities of Macquarie and Macquarie does not guarantee or
otherwise provide assurance in respect of the obligations of that entity, unless noted otherwise. This information is not intended to create legal relations and is not binding on Macquarie under any circumstances
whatsoever. This information has been prepared in good faith and is based on information obtained from sources believed to be reliable, however Macquarie does not make any representation or warranty that it is
accurate, complete or up to date. The information may be based on certain assumptions or market conditions, and if those assumptions or market conditions change, the information may change. No independent
verification of the information has been made. Any quotes given are indicative only. No part of this information is to be construed as a solicitation to buy or sell any product, or to engage in, or refrain from engaging in, any
transaction.
To the extent permitted by law, neither Macquarie nor its related bodies corporate (the “Macquarie Group”) nor any of its associates, directors, officers or employees, or any other person, makes any promise, guarantee,
representation or warranty (express or implied) to any person as to the accuracy or completeness of this information, or of any other information, materials or opinions, whether written or oral, that have been, or may be,
prepared or furnished by Macquarie Group, including, without limitation, economic and financial projections and risk evaluation. No responsibility or liability whatsoever (in negligence or otherwise) is accepted by any
person for any errors, mis-statements or omissions in this information or any other information or materials. Without prejudice to the foregoing, neither the Macquarie Group, nor any of its associates, directors, officers,
employees nor any other person shall be liable for any loss or damage (whether direct, indirect or consequential) suffered by any person as a result of relying on any statement in or omission from this information. Nothing
in this information should be construed as legal, financial, accounting, tax or other advice.
The Macquarie Group or its associates, directors, officers or employees may have interests in the financial products referred to in this information by acting in various roles including as provider of corporate finance,
underwriter or dealer, holder of principal positions, broker, lender or adviser and may receive fees, brokerage or commissions for acting in those capacities. In addition, the Macquarie Group and its associates, directors,
officers or employees may buy or sell the financial products as principal or agent and as such may effect transactions which are not consistent with any recommendations in this information.
Unless otherwise specified all information is for the half year ended 30 September 2012.
Certain financial information in this presentation is prepared on a different basis to the Macquarie Group Limited Financial Report, which is prepared in accordance with Australian Accounting Standards. Where financial
information presented within this presentation does not comply with Australian Accounting Standards, a reconciliation to the statutory information is provided.
This presentation provides further detail in relation to key elements of Macquarie Group Limited‟s financial performance and financial position. It also provides an analysis of the funding profile of the
Group because maintaining the structural integrity of the Group's balance sheet requires active management of both asset and liability portfolios. Active management of the funded balance sheet enables the Group to
strengthen its liquidity and funding position.
This presentation may contain forward looking statements including statements regarding our intent, belief or current expectations with respect to Macquarie‟s businesses and operations, market conditions, results of
operation and financial condition, capital adequacy, specific provisions and risk management practices. Readers are cautioned not to place undue reliance on these forward looking statements. Macquarie does not
undertake any obligation to publicly release the result of any revisions to these forward looking statements to reflect events or circumstances after the date hereof to reflect the occurrence of unanticipated events. While due
care has been used in the preparation of forecast information, actual results may vary in a materially positive or negative manner. Forecasts and hypothetical examples are subject to uncertainty and contingencies outside
Macquarie‟s control. Past performance is not a reliable indication of future performance.
Any additional financial information in this presentation which is not included in the Macquarie Group Limited Financial Report was not subject to independent audit or review by PricewaterhouseCoopers

3
Agenda
1. Overview
2. 3Q13 Update and Outlook
3. 1H13 Results
4. Appendix
5. Contacts

4
Overview 1 Macquarie Group Limited Presentation to Investors and Analysts March 2013

5
About Macquarie
Global provider of banking, financial, advisory, investment and funds management services
Main business focus is providing products and services to clients
Listed on Australian Securities Exchange (ASX: MQG; ADR: MQBKY)
Regulated by APRA, Australian banking regulator, as non-operating holding company of a licensed Australian bank
Assets under management $A341b1
Founded in 1969, currently operates in 28 countries and employs 13,5492 people
1. 30 Sep 12 2. 31 Dec 12
Macquarie Group Limited Macquarie Bank Limited
Short-term
rating
Long-term
rating
Long-term
rating outlook
Short-term
rating
Long-term
rating
Long-term
rating outlook
Fitch Ratings F-2 A- Stable F-1 A Stable
Moody’s P-2 A3 Stable P-1 A2 Stable
Standard and Poor’s A-2 BBB Stable A-1 A Stable
For further information on Macquarie, visit www.macquarie.com/mgl/com/investor-relations

6
Macquarie has a long history of profitability
0.0 0.4 0.8 1.2 1.6 2.0
1969 1970 1971 1972 1973 1974 1975 1976 1977 1978 1979
Hill Samuel UK
opens branch
office in Sydney
Currency
Crisis
Recession
0
20
40
60
80
100
1980 1981 1982 1983 1984 1985 1986 1987 1988 1989 1990 1991 1992 1993 1994 1995
Savings and
loan crisis
US banks
capital losses
Global debt
crisis US
recession $A floated
MBL
established
First listed
property trust
Enter
stockbroking
Stock
market
crash
London office
opens
Hills Motorway
Mortgage
securitisation Global real
estate crash Recession
0
500
1000
1500
2000
1996 1997 1998 1999 2000 2001 2002 2003 2004 2005 2006 2007 2008 2009 2010 2011 2012 1H13
Orion Securities
CIT Systems Leasing
Group Restructure
Significant Market Disruption
MBL
listed BT
Australia
acquired
Sydney
Airport
ING
Acquired Asian
Financial
Crisis
Russian
Debt
Crisis
Dot
Com
crash
9/11
US
Recession SARS
Thames Water
Giuliani Capital GFC
Constellation
Tristone
Delaware
FPK
Blackmont
Sal Opp.
ILFC
GMAC
Presidio
Innovest
REGAL Onstream

7
About Macquarie Macquarie Funds Group
1. Data as at 30 Sep 12. 2. Based on the amount of infrastructure direct investment capital formed in the last five years. 3. AsianInvestor 2012 Investment Performance Awards for institutional funds management. 4. The award, based in Hong Kong, assesses
funds that primarily sell into the Asian region and is judged on nominal and risk-adjusted performance over one, three and five year periods. 5. Financial Review Smart Investor Blue Ribbon Awards 2012
Provides clients with access to a
diverse range of capabilities and
products, including:
– Infrastructure and real asset
management
– Securities investment management
– Fund and equity-based solutions
Top 50 global asset manager with $337b1 of assets under management
Ranked 1st in Infrastructure Investor
magazine‟s list of top
infrastructure investors2 for
the third consecutive year
Macquarie Enhanced Global
Bond Fund was recognised
by AsianInvestor as the best
Global Fixed Income
Fund (Hedged)4
“Best Infrastructure”
and
“Best Real Estate” Fund Manager House Awards
for 2012 by AsianInvestor3
Macquarie
Investment
Management
Macquarie
Infrastructure
and Real Assets
Macquarie
Specialised
Investment
Solutions
AUM: $A229b1
AUM: $A106b1 AUM: $A2b1
Macquarie Funds Group
Best Diversified
Credit/Multi-Strategy
Income Fund
Macquarie Income
Opportunities Fund5

8
0
50
100
150
200
250
300
350
400
Mar 09 Mar 10 Mar 11 Mar 12 Sep 12
Fixed income Direct infrastructure
Equities Cash
Direct real estate Currency
Other
Assets under management of $A341b
AUM increased $A13.6b or 4% since 31 Mar 12, primarily driven by positive market and valuation
movements and investments in the infrastructure and real assets business
$A243b
$A326b $A310b
$A327b $A341b
$Ab
Data as at 30 Sep 12

9
About Macquarie Corporate and Asset Finance
Aircraft
Portfolio: $A3.2b1
Equipment
Finance
Portfolio: $A1.9b1
Meters
Portfolio: $A0.7b1
Motor Vehicles
Portfolio: $A6.7b1
Mining Equipment
Portfolio: $A0.4b1
Lending
Portfolio: $A8.1b1
Corporate and
Asset Finance
Rail
Portfolio: $A0.4b1
One of the
largest providers of motor
vehicle finance in
Australia
Provider of tailored finance and asset management
solutions to clients across specialised assets
through the cycles
– Niche positions in deep, attractive markets
– Origination through the cycles
– Strong credit and asset discipline
– Strong funder and investor demand for assets
– Cost management and returns focus
– Successfully converted opportunities during
cycles
Expertise in corporate debt and asset finance
including: aircraft, motor vehicles, technology,
healthcare, manufacturing, industrial, energy, rail
and mining equipment
One of North
America‟s
largest
independent lessors
of technology
equipment
Portfolio
diversified by geography, assets,
industries, product
types, exposures and
clients
$A21.4b1 of loans and assets under finance
1. Data as at 30 Sep 12.

10 1. Data as at 30 Sep 12 2. IRESS: consideration traded and volume 30 Sep 12. 3. Investment Executive Brokerage Report Card 2012 (Canada) 4. Fairfax Blue Ribbon Smart Investor Awards 2012 5. Money Magazine 2012 Best of the Best Awards‟
Cheapest Flexible Home Loan for Classic P&L Home Loan.
~1.1 million high net worth clients serviced by
625 Macquarie client advisers and our
Independent Financial Adviser partners
Leading provider of retail advisory services
and products
Extensive platform support services to
intermediaries in Australia
Specialist Relationship Banking provider to
Small to Medium Enterprises (SME)
$A30.8b1 retail on-balance sheet cash
Banking and
Financial
Services
About Macquarie Banking and Financial Services
No.1 full-service
Australian retail
stockbroker in terms of
volume and market
share2
Macquarie Super and
Pension Consolidator named
Super Platform of
the Year4
No.1 National
Independent Canadian
Advisory firm3
Macquarie Mortgages
awarded Money
Magazine‟s 2012 Best of
the Best awards5
Mortgages
Relationship
banking Financial advice
services
Cash Wrap
Insurance

11
About Macquarie Macquarie Securities Group
1. Peter Lee Associates Survey of Asian/Australian Institutional Investors – Australian Equities. 2. Greenwich Survey of US Institutional Investors – Australian Equities and Greenwich Survey of European Institutional Investors – Australian
Equities. 3. Abel Nosser 2012. 4. Bloomberg league tables 1 Jan – 30 Sep 12. 5. Local exchanges.
Global institutional securities house with
strong Asia-Pacific foundations covering
sales, research, ECM, execution and
derivatives activities
Full-service cash equities in Australia, Asia,
South Africa and Canada with offerings in US
and Europe. Specialised derivatives in key
locations globally
Key specialities: infrastructure and utilities,
TMET, resources (mining and energy),
industrials and financial institutions
Macquarie
Securities
Group
Research
Corporate
Access
Derivatives Arbitrage
Execution
Equity capital
markets
Equity finance
210+ equity research
analysts
2,215+ stocks under coverage
25+ years Knowledge and
experience in
Asia-Pacific
No.1 in Asia1,
US and Europe2, and
No.2 in Australia1
for Australian equities
No.1 warrants market
share Singapore5
No.3 in Australia5&
No.5 HK5
No.1 Execution
Quality Asia-Pacific3
No.3 Australian
ECM4

12
About Macquarie Macquarie Capital Group
1. 2012 Capital/CFO Awards. 2 Announced deals by value, any involvement, Bloomberg 1Jan – 30 Sep 12. 3. Completed Equity, Equity-linked & Pfd deals by value, Bloomberg 1 Jan- 30 Sep 12. 4. International M&A Advisor Awards (for deals between
$1-3b) 5. EMEA Finance. 6. Infrastructure Journal, Jan-Jun 12. 7. (Downtown Tunnel/Midtown Tunnel/MLK Extension Project) Global Finance Magazine.
Global corporate finance capability,
including M&A, capital markets and
principal investments
Key specialities: infrastructure, utilities
and renewables; resources (mining
and energy); real estate; TMET;
industrials and financial institutions
Winner of over 20 awards globally in
2012, including Best Investment Bank
(Australia) and Best Equity House
(Australia)1
FINANCIAL INSTITUTIONS
INDUSTRIALS
INFRASTRUCTURE, UTILITIES
& RENEWABLES
REAL ESTATE
RESOURCES
TELECOMMUNICATIONS, MEDIA
ENTERTAINMENT & TECHNOLOGY ME
RG
ER
S &
AC
QU
ISIT
ION
S
PR
OJ
EC
T F
INA
NC
E
EQ
UIT
Y C
AP
ITA
L M
AR
KE
TS
DE
BT
CA
PIT
AL
MA
RK
ET
S
PR
IVA
TE
CA
PIT
AL
MA
RK
ET
S
PR
INC
IPA
L I
NV
ES
TM
EN
TS
No.1 ANZ M&A2
No. 3 ANZ ECM3
M&A Deal of
the Year (Tokio
Marine/Delphi
Financial Group)4
No.1 Financial Adviser for
Project Finance
Deals (Americas)6
Best PPP
EMEA Deal of
the Year (Muharraq STP)5
Best Project &
Infrastructure
Finance
Sponsor (Global)7

13 1. Percentages are based on operating income before impairment charges on investment securities available for sale and associates and joint ventures. 2. Platts, June 12.
Global fixed income, currencies and
commodities provider of finance, risk solutions
and market access to producers/consumers
and financial institutions/investors
Approx. 60% of operating income1 for the 12
months to 30 Sep 2012 from Commodity
markets
Growing presence in physical commodities
(natural gas, LNG, power, oil, coal, base
metals, iron ore, sugar and freight)
Predominant in US and Australia, niche
offering in Canada and Latin America, growing
presence in Asia and EMEA
Specialties: commodities, Asian and emerging
markets, high yield and distressed debt
FICC
About Macquarie Fixed Income, Currencies and Commodities
A portfolio of businesses across Commodity and Financial markets
Specialist provider of FX
transactional
services
20+ years actively trading
in global
agricultural
markets
30+ years in metals markets
and as a global
full service
futures broker
10+ years in global
energy markets -
No.4 physical gas
marketer in North
America2
Energy markets
Metals markets
Futures
Environmental financial
products
Asian and
emerging markets
Fixed income,
currency and
credit markets
Agricultural
markets
Metals and
energy capital

14
Macquarie‟s risk management principles have remained largely stable over 30 years and served the Group well over the past few years
The key aspects of Macquarie‟s risk management approach are:
Macquarie‟s approach to risk is supported by the Risk Management Group
Macquarie determines aggregate risk appetite by assessing risk relative to earnings, more than by reference to capital
Business heads responsible for
identifying risks within their
businesses and ensuring these are
managed appropriately.
Seek a clear analysis of the risks
before taking decisions.
Risk management approach based
on examining the consequences of
worst case outcomes and
determining whether risks can be
tolerated.
Adopted for all material risk types and
often achieved by stress testing.
Risk Management Group (RMG) signs
off all material risk acceptance decisions.
For material proposals, RMG opinion
sought at the early stage in decision
making process, and independent input
from RMG on risk and return is included
in the approval document submitted to
senior management.
Ownership of risk at the business
level
Understanding worst case
outcomes
Requirement for independent
sign-off by Risk Management
Long standing conservative Risk Management

15
3Q13 Update and Outlook 2 Macquarie Group Limited Presentation to Investors and Analysts March 2013

16
Since our 1H13 result announcement, market conditions have shown some signs of improvement, however client activity remains
subdued for capital markets facing businesses
Macquarie‟s annuity-style businesses (Macquarie Funds, Banking and Financial Services and Corporate and Asset Finance) continue
to perform well with combined Dec 12 qtr net profit contribution1 up on pcp (Dec 11 qtr) and the prior period (Sep 12 qtr)
Whilst Macquarie‟s capital markets facing businesses (FICC, Macquarie Securities Group and Macquarie Capital) continued to face
subdued market conditions, combined Dec 12 qtr net profit contribution1 was up strongly on both weak pcp and prior period
Macquarie Securities: Cash equities business remains marginally profitable and legacy expenses continuing to decline
Macquarie Capital: Overall deal activity was up on both weak pcp and prior period, although ECM levels remain low, particularly
in Asia and Australia
FICC: Continued good performance from Energy Markets and Credit Trading, however Metals & Energy Capital and Metals &
Agriculture Sales and Trading continue to be impacted by market conditions
Benefits from operating efficiencies continue with Dec 12 qtr operating expenses down approx. 10% on pcp
3Q13 Overview
1. Net Profit Contribution is operating income less operating expenses and is reported before profit share and income tax.

17
FY13 outlook
Summarised below are the outlook statements for each Operating Group
FY13 results will vary with market conditions, particularly the capital markets facing businesses which
continue to experience subdued market conditions
1. Range excludes FY09 provisions for loan losses of $A135m related to Real Estate Structured Finance loans as this is a restructured business. 2. Range excludes FY09 loss on sale of Italian mortgages of $A248m as this is a discontinued business.
Net profit contribution
Operating Group FY07- FY12
historical range FY07-FY12
average FY12 FY13 outlook as updated in Oct 12 Update to FY13 outlook
Macquarie Funds $A0.3b – $A1.1b $A0.7b $A0.7b Up on FY12 No change
Corporate and Asset Finance $A0.1b – $A0.7b1 $A0.3b $A0.7b Broadly in line with FY12 No change
Banking and Financial Services $A0.1b – $A0.3b2 $A0.2b $A0.3b Up on FY12 No change
Macquarie Securities $A(0.2)b – $A1.2b $A0.5b $A(0.2)b Up on FY12 but unlikely to be profitable if current markets persist
No change
Macquarie Capital $A(0.1)b – $A1.6b $A0.6b $A0.1b Up on FY12 No change
FICC $A0.5b – $A0.8b $A0.6b $A0.5b Up on FY12 Broadly in line
Corporate
– Compensation ratio to be consistent with historical levels
– Continued higher cost of funding reflecting market conditions and high liquidity levels
No change No change

18
FY13 outlook
Subject to market conditions, FY13 net profit contribution from operating groups expected to be materially
up on FY12
FY13 contribution from Corporate expected to be down on FY12 due to the net impact of a number of
items including the receipt of $A295m from Sydney Airport in FY12
Tax rate is expected to increase from 28% in FY12 to over 30% for FY13 due to the ongoing strength of
US businesses and weakness in Asian capital markets facing businesses
Whilst market conditions remain uncertain, we currently expect Macquarie‟s result for FY13 to be up
approx. 10% on FY12 with the probability of a stronger result should improved market conditions persist
The FY13 result remains subject to market conditions, completion rate of transactions and impairment
testing as well as a range of other factors including
the cost of our continued conservative approach to funding and capital
regulation, including the potential for regulatory changes
increased competition in some markets
the overall cost of funding

19
EUROPE, MIDDLE EAST
& AFRICA2
Staff: 1,184
ASIA
Staff: 2,945
AMERICAS
Staff: 3,267
AUSTRALIA3
Staff: 6,153
13,5491 staff in over 28 countries
1. Staff numbers as at 31 Dec 12. 2. Excludes staff in Macquarie First South joint venture and staff seconded to Macquarie Renaissance joint venture (Moscow). 3. Includes New Zealand.
20
30 September 2012 31 March 2012 31 March 2012 31 December 2012 30 September 2012
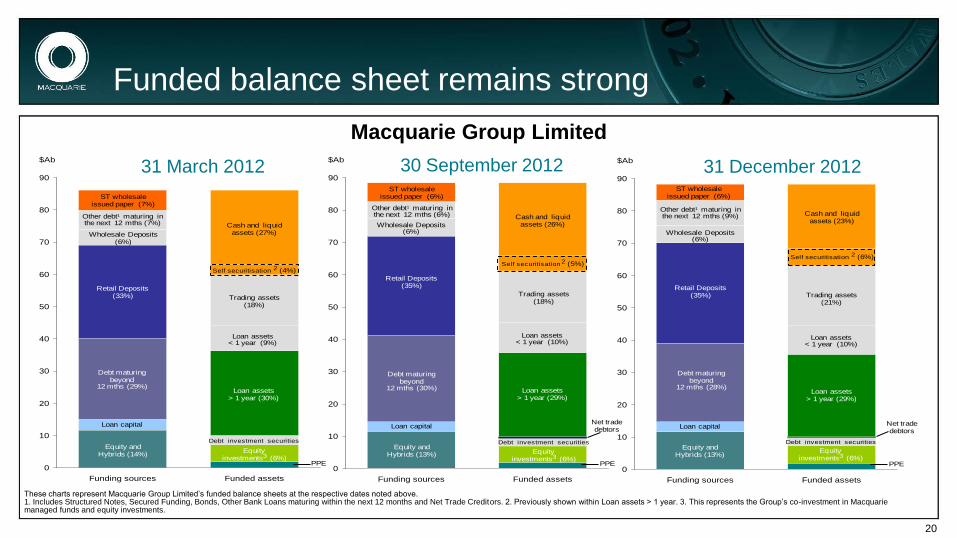
Funded balance sheet remains strong
Macquarie Group Limited
0
10
20
30
40
50
60
70
80
90
Funding sources Funded assets
$Ab
Loan capital
Trading assets (18%)
Loan assets < 1 year (9%)
Loan assets > 1 year (30%)
Equity investments3 (6%)
Cash and liquidassets (27%)
Debt maturingbeyond
12 mths (29%)
Equity andHybrids (14%)
ST wholesaleissued paper (7%)
Other debt1 maturing in the next 12 mths (7%)
PPE
Debt investment securities
Retail Deposits (33%)
Wholesale Deposits (6%)
0
10
20
30
40
50
60
70
80
90
Funding sources Funded assets
$Ab
Loan capital
Trading assets (21%)
Loan assets < 1 year (10%)
Loan assets > 1 year (29%)
Equity investments3 (6%)
Cash and liquidassets (23%)
Debt maturingbeyond
12 mths (28%)
Equity andHybrids (13%)
ST wholesaleissued paper (6%)
Other debt1 maturing in the next 12 mths (9%)
PPE
Debt investment securities
Retail Deposits (35%)
Wholesale Deposits (6%)
Net tradedebtors
0
10
20
30
40
50
60
70
80
90
Funding sources Funded assets
$Ab
Loan capital
Trading assets (18%)
Loan assets < 1 year (10%)
Loan assets > 1 year (29%)
Equity investments3 (6%)
Cash and liquidassets (26%)
Debt maturingbeyond
12 mths (30%)
Equity andHybrids (13%)
ST wholesaleissued paper (6%)
Other debt1 maturing in the next 12 mths (6%)
PPE
Debt investment securities
Retail Deposits (35%)
Wholesale Deposits (6%)
Net tradedebtors
Self securitisation 2 (4%)Self securitisation 2 (5%)
Self securitisation 2 (6%)
These charts represent Macquarie Group Limited‟s funded balance sheets at the respective dates noted above. 1. Includes Structured Notes, Secured Funding, Bonds, Other Bank Loans maturing within the next 12 months and Net Trade Creditors. 2. Previously shown within Loan assets > 1 year. 3. This represents the Group‟s co-investment in Macquarie managed funds and equity investments.

21
3.4 3.3
2.1
4.3 4.2
3.0
0.1 (0.1) (0.1) (1.2)
0.0
0.5
1.0
1.5
2.0
2.5
3.0
3.5
4.0
4.5
5.0
Harmonised Basel III at Sep 12
Net capital generation Increased regulatory requirements
Other Harmonised Basel III at Dec 12
APRA Basel III 'super equivalence'
APRA Basel III at Dec 12
Group regulatory surplus: Basel III (Dec 12)
Based on 8.5%
(minimum Tier 1
ratio + CCB),
which is not
required by APRA
until 2016
$Ab
Group regulatory surplus at 8.5% RWA Group regulatory surplus at 7% RWA
Harmonised Basel III Banking Group capital ratios at Dec 12 Common Equity Tier 1: 11.3%; Tier 1: 12.3%
Stable Basel III capital surplus
1. „Harmonised‟ Basel III estimates assume alignment with BIS in areas where APRA differs from the BIS. 2. Includes 3Q12 P&L net of 1H13 dividend and movement in reserves. 3. Relating to Operational Risk. 4. APRA Basel III „super-equivalence‟ includes full CET1 deductions of equity investments ($A0.7b); deconsolidated subsidiaries ($A0.3b); and DTA‟s and other impacts ($A0.2b).
1
2
4 3

22
Medium term
Macquarie remains well positioned to deliver superior performance in the medium term
Deep expertise in major markets
Build on our strength in diversity and continue to adapt our portfolio mix to changing market conditions
Annuity-style income is provided by three significant businesses which are delivering superior returns following
years of investment and recent acquisitions
Macquarie Funds, Corporate and Asset Finance and Banking and Financial Services
Three capital markets facing businesses:
Macquarie Securities and Macquarie Capital are well positioned to benefit from improvements in market
conditions with strong platforms and franchise positions
FICC well placed to benefit from niche expertise and more normalised conditions
Ongoing benefits of continued cost initiatives
Strong and conservative balance sheet
Well matched funding profile with minimal reliance on short term wholesale funding
Surplus funding and capital available to support growth
Proven risk management framework and culture

23
Operating Group
APRA Basel III Capital
@ 8.5% ($Ab) Approx. 1H13 Return
on Ordinary Equity1
Annuity-style businesses (excluding legacy) Approx. 6-Year Average
Return on Ordinary Equity1
Macquarie Funds Group 1.6
22% 20%2 Corporate and Asset Finance 2.1
Banking and Financial Services 0.9
Capital markets facing businesses (excluding legacy) 6-Year Average
profit pre tax and
profit share ($Ab)
Approx. 6-Year
Average Return on
Ordinary Equity1
Macquarie Securities 0.5 -
0.5 30%
Macquarie Capital 1.4 0.6 20%
FICC 2.6 9% 0.6 15%
Corporate and Other
Legacy Assets 0.9
Corporate 0.5
Total regulatory capital requirement @ 8.5% 10.5
Comprising: Ordinary Equity
Hybrid
8.8
1.7
Add: Surplus Ordinary Equity 2.1
Total APRA Basel III capital supply 12.6
Approximate business Basel III & ROE
1. NPAT used in the calculation of approx. ROE is based on Operating Group‟s net profit contribution adjusted for indicative allocations of profit share, tax and other corporate expenses. Accounting equity is attributed to businesses based on regulatory capital requirements. 6-year average covers FY07 to FY12, inclusively. 2. CAF excluded from 6-year average as not meaningful given the significant increase in scale of CAF‟s platform over the 6-year period. As at 30 Sep 12.

24
1H13 Results 3 Macquarie Group Limited Presentation to Investors and Analysts March 2013

25
1H13 result
Net profit of $A361m, up 18% on 1H12 and down 15% on 2H12
Operating income $A3.1b, down 5% on 1H12 and down 17% on 2H12
Macquarie‟s annuity-style businesses, Macquarie Funds Group, Corporate and Asset Finance, Banking and Financial Services, continued to
perform well with 1H13 combined results broadly in line with a strong 1H12 and up on 2H12
As foreshadowed, Macquarie‟s capital markets facing businesses, Macquarie Securities, Macquarie Capital and FICC, although continuing to face
subdued market conditions, delivered a combined result up on 1H12 due to improved conditions for FICC
Macquarie Securities and Macquarie Capital continued to be impacted by low activity levels across ECM and M&A
Macquarie Securities impacted by low levels of client activity combined with run-off costs in its legacy businesses partially offset by ongoing
cost efficiencies
Operating expenses $A2.6b, down 9% on 1H12 and down 17% on 2H12, as a result of continued operating efficiencies
Increase in the half year effective tax rate to 30.2% up from 26.0% in 1H12 and 29.8% in 2H12
EPS $A1.06, up 22% on 1H12 and down 15% on 2H12
Return on equity 6.6%, up from 5.7% in 1H12 and down from 7.8% in 2H12
1H13 dividend of $A0.75 (unfranked), up on 1H12 dividend of $A0.65 (unfranked) and in line with 2H12 dividend of $A0.75 (unfranked)

26
1H13 result
Sep 12 v
Sep 11
Sep 12
$Am
Mar 12
$Am
Sep 11
$Am
Net operating income 5% 3,081 3,720 3,243
Total operating expenses 9% (2,564) (3,086) (2,828)
Operating profit before income tax 25% 517 634 415
Income tax expense 46% (156) (180) (107)
Profit attributable to non-controlling interests - (29) (3)
Profit attributable to MGL shareholders 18% 361 425 305

27
0
400
800
2H10 1H11 2H11 1H12 2H12 1H13
$Am
0
2,000
4,000
2H10 1H11 2H11 1H12 2H12 1H13
$Am
0.00
1.00
2.00
2H10 1H11 2H11 1H12 2H12 1H13
$A
0.00
1.00
2H10 1H11 2H11 1H12 2H12 1H13
$A
Financial performance
1H13 Profit of $A361m
1H13 up 18% on 1H12
1H13 Operating income of $A3,081m
1H13 down 5% on 1H12
1H13 EPS of $A1.06
1H13 up 22% on 1H12
1H13 DPS of $A0.75
1H13 up 15% on 1H12

28
Diversified income Operating income1 by source
11%
29%
2%
18%
9% 8%
23%
6 months to 30 Sep 12
$A3.3b
Operating income before impairments charges on equity investments and
non-financial assets
Institutional and retail
cash equities
Equity
derivatives
Securities funds management
and administration
M&A and advisory
income
Asset and equity
investments
Commodities, resources
and foreign exchange
Lending, leasing and margin
related income
12 months to 31 Mar 12
$A7.2b
4%
7% 12%
18%
25%
11%
26% 3%
18%
11% 8%
23%
14%
4%
20%
7% 14%
18%
23%
1. Operating income before impairments charges on equity investments and non-financial assets.

29
Diversified by region International income1 61% of total Total staff 13,463; International staff 54% of total
EUROPE, MIDDLE EAST
& AFRICA2
Income: $A625m (19% of total)
Staff: 1,229
ASIA
Income: $A353m (11% of total)
Staff: 2,813
AMERICAS
Income: $A1,006m (31% of total)
Staff: 3,276
AUSTRALIA3
Income: $A1,253m (39% of total)
Staff: 6,145
1. Operating income for half year to 30 Sep 12. Operating income in each region before impairment charges on equity investments and non-financial assets and income from the Corporate segment. 2. Excludes staff in Macquarie First South joint venture and staff seconded to Macquarie Renaissance joint venture (Moscow). 3. Includes New Zealand.

30
Diversified income Operating income1 by region
1. Operating income in each region before impairment charges on equity investments and non-financial assets and income from the Corporate segment.
61% of operating income1 in 1H13 is generated offshore
FX translation estimated to have a minimal impact on the 1H13 result compared to both 1H12 and 2H12
$Am
0
200
400
600
800
1,000
1,200
1,400
1,600
Australia Asia Americas Europe, Middle East & Africa
1H11
2H11
1H12
2H12
1H13

31
33 4 233 41
96
39
52
1,600
1,700
1,800
1,900
2,000
2,100
2,200
2,300
2,400
2,500
2,600
1H12 Investment in growth areas
Restructure MFG CAF BFS MSG Mac Cap FICC 1H13
Percentage reduction for each of the Operating Segments is based off 1H12 operating expenses (excluding brokerage and commissions expense). Restructuring includes incremental business rationalisation and restructuring costs.
Cost Performance
1H13 operating expenses (excluding brokerage and commissions expense) $A2.2b; down $A0.2b on 1H12
Achieved by ongoing cost reduction initiatives including centralisation of support functions and continued focus on costs
Select investment in growth areas including key markets, new products, processes and technologies
Macquarie Securities and Macquarie Capital continue to expect to reduce FY11 run rate costs by 20-25% by end of FY13
9%
14% 23%
16%
7% $A254m
reduction
10%
2%
$Am
2,442
2,217

32
Strong funding and balance sheet position
1. These balances represent total deposits per the funded balance sheet, which differs from total deposits per the statutory balance sheet ($A40.0b at 30 Sep 12). The funded balance sheet excludes any deposits which do not represent a funding source for the Group. 2. Loan assets exclude Canadian mortgages which are funded via a government sponsored securitisation program. 3. Includes $A1.0b term secured finance in Oct 12.
Diverse and stable funding base, minimal reliance on short term wholesale funding markets
Total deposits1 increased to $A36.2b at Sep 12 from $A33.9b at Mar 12
Represents 41% of the Group‟s total funding sources
Group loan assets represent 88% of total deposits2
Retail deposits increased to $A30.8b at Sep 12 from $A29.0b at Mar 12, primarily driven by an
increase in the CMA
$A5.9b of new term funding raised since Mar 123
Continue to diversify funding base and develop new markets including Switzerland, South Africa,
Korea and Taiwan
$A2.1b raised through private placements and structured note issuance
33
30 September 2011 30 September 2012 31 March 2012 30 September 2011 30 September 2012 31 March 2012
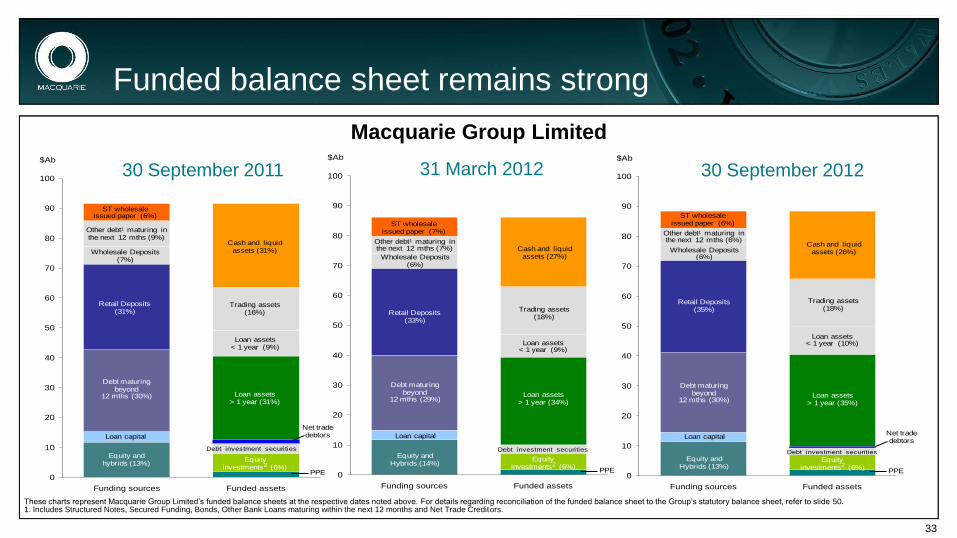
Funded balance sheet remains strong
These charts represent Macquarie Group Limited‟s funded balance sheets at the respective dates noted above. For details regarding reconciliation of the funded balance sheet to the Group‟s statutory balance sheet, refer to slide 50. 1. Includes Structured Notes, Secured Funding, Bonds, Other Bank Loans maturing within the next 12 months and Net Trade Creditors.
Macquarie Group Limited
0
10
20
30
40
50
60
70
80
90
100
Funding sources Funded assets
$Ab
0
10
20
30
40
50
60
70
80
90
100
Funding sources Funded assets
$Ab
Loan capital
Trading assets (16%)
Loan assets < 1 year (9%)
Loan assets > 1 year (31%)
Equity investments2 (6%)
Cash and liquid assets (31%)
Debt maturingbeyond
12 mths (30%)
Equity andhybrids (13%)
ST wholesaleissued paper (6%)
Other debt1 maturing in the next 12 mths (9%)
Trading assets (18%)
Loan assets < 1 year (9%)
Loan assets > 1 year (34%)
Equity investments2 (6%)
Cash and liquidassets (27%)
Debt maturingbeyond
12 mths (29%)
Equity andHybrids (14%)
ST wholesaleissued paper (7%)
Other debt1 maturing in the next 12 mths (7%)
PPE PPE
Net tradedebtorsLoan capital
Debt investment securities Debt investment securities
Retail Deposits (31%)
Wholesale Deposits (7%)
Retail Deposits (33%)
Wholesale Deposits (6%)
0
10
20
30
40
50
60
70
80
90
100
Funding sources Funded assets
$Ab
Loan capital
Trading assets (18%)
Loan assets < 1 year (10%)
Loan assets > 1 year (35%)
Equity investments2 (6%)
Cash and liquidassets (26%)
Debt maturingbeyond
12 mths (30%)
Equity andHybrids (13%)
ST wholesaleissued paper (6%)
Other debt1 maturing in the next 12 mths (6%)
PPE
Debt investment securities
Retail Deposits (35%)
Wholesale Deposits (6%)
Net tradedebtors

34
Well diversified funding sources
1. Term facilities for the Group were fully drawn as at 31 Dec 12
Well diversified funding sources
Minimal reliance on short term wholesale funding markets
Deposit base represents 41% of total funding sources
MGL term funding (drawn and undrawn1)
maturing beyond one year (including equity
and hybrids)
Diversity of MGL funding sources
Term funding beyond one year (excluding equity) has
a weighted average term to maturity of 4.5 years
Wholesale issued paper Deposits -
corporate &
wholesale
Deposits - retail
Structured notes
Other loans
Secured funding
Senior credit facility
Bonds
Loan capital
Equity & hybrids
0
5
10
15
20
1-2 yrs <3 yrs <4 yrs <5 yrs 5 yrs+
$AbEquity & hybrids Loan capital Debt

35
10%
15%
20%
25%
30%
35%
40%
0
5
10
15
20
25
30
35
40
Mar 08 Mar 09 Mar 10 Mar 11 Mar 12 Sep 12
$Ab
Retail Corporate/wholesale
Continued retail deposit growth
Macquarie has been successful in pursuing its strategy of diversifying its funding sources through
growing its deposit base
In excess of 1 million retail clients, of which more than 641,000 are depositors
Focus on the composition and quality of the deposit base
Continue to grow deposits in the CMA product which has an average balance of $A39k
Retail Corporate/wholesale
% of total
funding source

36
3.5 3.9 3.9 4.2
3.4 3.0
2.1
4.4 4.3
3.0
0.2 0.2
(0.5)
(1.3)
0.0
0.5
1.0
1.5
2.0
2.5
3.0
3.5
4.0
4.5
5.0
Harmonised Basel III at Mar 12
MEREP and Buyback Net capital generation Other Harmonised Basel III at Sep 12
APRA Basel III 'super equivalence'
APRA Basel III at Sep 12
Group regulatory surplus: Basel III (Sep 12)
Based on 8.5%
(minimum Tier 1
ratio + CCB),
which is not
required by
APRA until 2016
$Ab
Group regulatory surplus at 8.5% RWA Group regulatory surplus at 7% RWA
2
3
4
Stable Basel III capital position
Harmonised Basel III Group capital of $A12.6b, Group surplus of $A3.4b at Sep 121
1. Calculated at 8.5% RWA which includes the 2.5% capital conservation buffer (CCB) not required to be met by APRA until 2016 and by BIS until 2019. 2. „Harmonised‟ Basel III estimates assume alignment with BIS in areas where APRA differs from the BIS, except that central counterparty (CCP) capital changes are not included in the estimates. 3. Includes 1H13 P&L net of FY12 dividend and movements in share based payment reserve. 4. APRA Basel III „super-equivalence‟ includes full CET1 deductions of equity investments ($A0.8b); deconsolidated subsidiaries ($A0.4b); and other impacts ($A0.1b).

37
0%
2%
4%
6%
8%
10%
12%
MBL Bank 2 Bank 3 Bank 4 Bank 5 Bank 6 Bank 7 Bank 8 Bank 9 Bank 10 Bank 11 Bank 12 Bank 13 Bank 14 Bank 15
CE
T1 R
atio
Harmonised Basel III CET1 Ratio
Australian Banks Overseas Banks
Macquarie Bank capital position relative to global peers
1. As at Dec 12 2. “Results of the Basel III monitoring exercise as of 30 June 2011”, Basel Committee on Banking Supervision, 12 Apr 12. Average of 103 Group 1 banks (i.e. those that have Tier 1 capital in excess of €3b and are internationally active). 3. The Harmonised Basel III CET1 ratio for each bank is sourced from their most recently available Basel III public disclosure. For Australian banks, this refers to the disclosed estimated Basel III BIS „harmonised‟ or „aligned‟ CET1 ratios, which include full phase-in of additional Basel III deductions. For overseas banks, banks have been included where the disclosure indicated that the CET1 ratio was based on full implementation of the 2019 BIS rules, which include full phase-in of additional Basel III deductions and excludes any future run-off, management action and growth. Banks included are ANZ, CBA, NAB and WBC for the Australian banks; Barclays, BMO, BoA ML, BNP, Citi, CS, Deutsche Bank, HSBC, JPMorgan and UBS for the overseas banks.
MBL Harmonised Basel III CET1 ratio is well above minimum CET1 + CCB and highest among peers
MBL‟s CET1 ratio of 11.3%1 compares favourably to the estimated global average of 7.1% reported by BIS in a
survey of 103 global banks² 3
Minimum BIS Basel III
CET1 Ratio + CCB = 7%
Minimum BIS Basel III
CET1 Ratio = 4.5%

38
MBL long term ratings stability
Standard & Poor‟s and Moodys Rating Movements from 1 May 2007
JPMorgan
Chase Bank
Credit Suisse AG
UBS AG
Barclays Bank
Deutsche Bank
Goldman Sachs Group
Bank of
America Citibank Morgan
Stanley Bank
Macquarie Bank
Ratin
g m
ovem
ent (n
otc
hes)
2007 2012 Intra
-
period ratings movement
AA -
A+
A
AA
AA+
A -
BBB+
Ratin
g m
ovem
ent (n
otc
hes)
Macquarie Bank
JPMorgan Chase Bank
Credit Suisse AG
UBS AG Barclays Bank
Deutsche Bank
Goldman Sachs Group
Bank of America
Citibank Morgan Stanley Bank
2007 2012 Intra - period ratings movement
Aa3
A1
A2
Aa2
Aa1
A3
AAA
Baa1
MBL has maintained its S&P rating for 21 years
MBL long term Moody’s rating stability

39
Appendix 4 Macquarie Group Limited Presentation to Investors and Analysts March 2013

40
Loan portfolio1 growth
0
100
200
300
400
500
600
700
800
900
0
5
10
15
20
25
30
35
40
45
Sep 09 Mar 10 Sep 10 Mar 11 Sep 11 Mar 12 Sep 12
Mortgages CAF lending Banking Aircraft leasing
Structured investment loans Motor Vehicle leasing Resources & commodities Equipment leasing
Other lending Other leasing Real Estate Total income (RHS)
1 . For the purposes of this disclosure, loan assets at amortised cost of $A47.6b at 30 Sep 12 per the statutory balance sheet are adjusted to include fundable assets not classified as loans on the statutory balance sheet (for example, assets subject to operating leases) and exclude loan assets that do not represent a funding requirement of the Group. 2. Total income includes net interest income from mortgages and other lending areas, and net operating lease income, net of funding costs.
Peak in 1H12 due to early loan
repayments in Corporate Lending
portfolio and higher income from
financing facilities to external funds
Volume
$Ab
Total Income
$Am
2
41
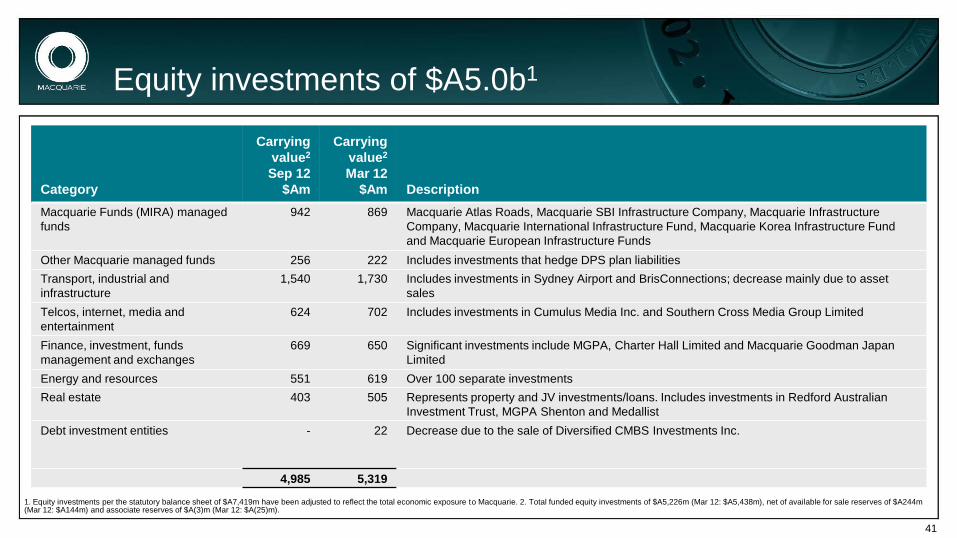
Equity investments of $A5.0b1
1. Equity investments per the statutory balance sheet of $A7,419m have been adjusted to reflect the total economic exposure to Macquarie. 2. Total funded equity investments of $A5,226m (Mar 12: $A5,438m), net of available for sale reserves of $A244m (Mar 12: $A144m) and associate reserves of $A(3)m (Mar 12: $A(25)m).
Category
Carrying
value2
Sep 12
$Am
Carrying
value2
Mar 12
$Am Description
Macquarie Funds (MIRA) managed
funds
942 869 Macquarie Atlas Roads, Macquarie SBI Infrastructure Company, Macquarie Infrastructure
Company, Macquarie International Infrastructure Fund, Macquarie Korea Infrastructure Fund
and Macquarie European Infrastructure Funds
Other Macquarie managed funds 256 222 Includes investments that hedge DPS plan liabilities
Transport, industrial and
infrastructure
1,540 1,730 Includes investments in Sydney Airport and BrisConnections; decrease mainly due to asset
sales
Telcos, internet, media and
entertainment
624 702 Includes investments in Cumulus Media Inc. and Southern Cross Media Group Limited
Finance, investment, funds
management and exchanges
669 650 Significant investments include MGPA, Charter Hall Limited and Macquarie Goodman Japan
Limited
Energy and resources 551 619 Over 100 separate investments
Real estate 403 505 Represents property and JV investments/loans. Includes investments in Redford Australian
Investment Trust, MGPA Shenton and Medallist
Debt investment entities - 22 Decrease due to the sale of Diversified CMBS Investments Inc.
4,985 5,319

42
Contacts 5 Macquarie Group Limited Presentation to Investors March 2013

43
Contact Details
Stuart Green
Head of Corporate Communications & Investor Relations
Macquarie Group Limited
Level 7, No.1 Martin Place
Sydney NSW 2000
Telephone: +612 8232 8845
Email: [email protected]
Patrick Upfold
Chief Financial Officer
Macquarie Group Limited
Level 7, No.1 Martin Place
Sydney NSW 2000
Telephone: +612 8232 7724
Email: [email protected]

Macquarie Group Limited