presentation of aeroports de paris 1 paris heliport 2 international airports • paris - charles de...
TRANSCRIPT

PRESENTATION OF AEROPORTS DE PARISPRESENTATION OF AEROPORTS DE PARIS
The 3 main Paris airports represent 5.8% of GDP and 8.3% of employment in Ile-de-France. They employ 340,290 people (2% of national employment), including 115,415 direct jobs, and generated 29.6 billion € of value added in 2010, representing 1.7% of French GDP (each increase of 1 million passenger traffic of Paris airports translates into 4,100 new jobs. a point of French GDP growth usual ly results in 2.3% of additional traffic).
� National public institution created in 1945 to main tain and operate civilian airports within 50 km around Paris
� Limited company since on 22/07/2005
� Principal shareholders: State: 52.1% - Strategic Inv estment Fund: 8% - Institutional French: 21%- Caisse des Dépôts et Consignations : 8, 7% - Schiphol Group: 8% -Employées : 2,2%
� Industrial and strategic partnership with Schiphol Group since 12/01/2008
� In the service sector, Hub Telecom offers a wide ra nge of telephony and data transfer.
� Aéroports de Paris Group is present on the internati onal stage through its subsidiary ADPI and ADPM, which respectively account engineeri ng activities of infrastructure and operation of airports.
PARIS AIRPORTS GROUPPARIS AIRPORTS GROUP
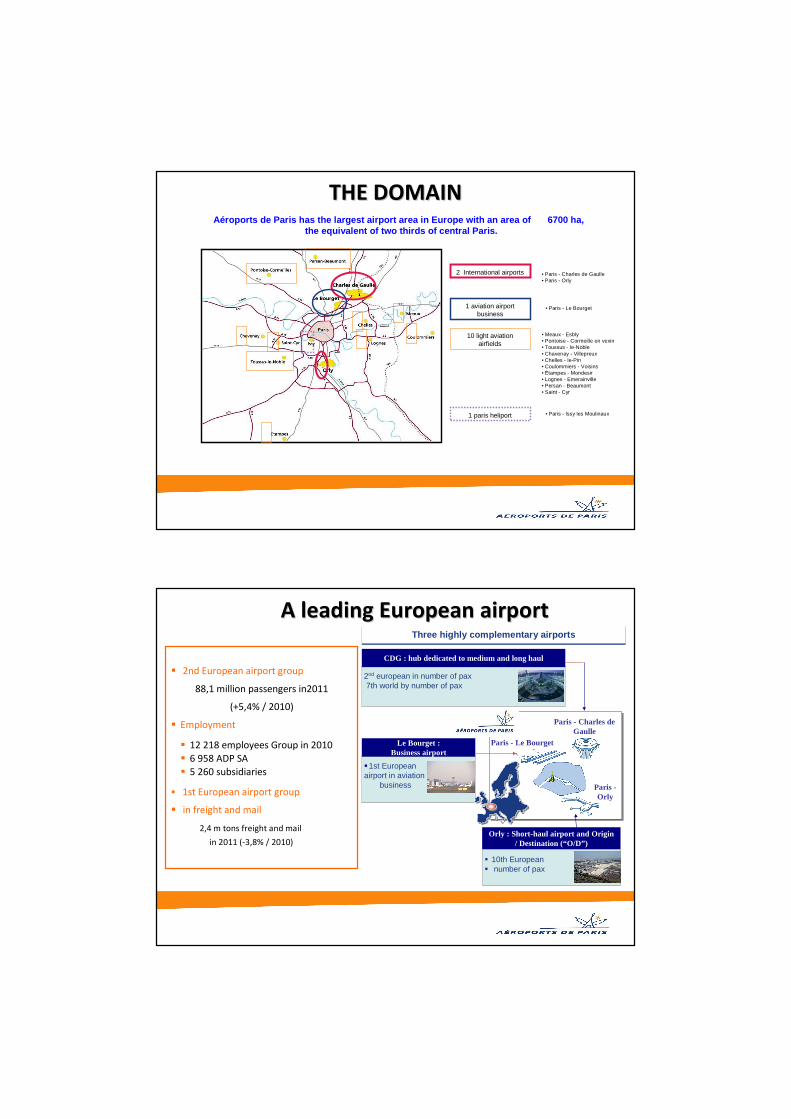
Aéroports de Paris has the largest airport area in Europe with an area of ��6700 ha,the equivalent of two thirds of central Paris.
10 light aviation airfields
1 aviation airport business
1 paris heliport
2 International airports • Paris - Charles de Gaulle• Paris - Orly
• Paris - Le Bourget
• Meaux - Esbly• Pontoise - Cormeille en vexin• Toussus - le-Noble• Chavenay - Villepreux• Chelles - le-Pin• Coulommiers - Voisins• Étampes - Mondesir• Lognes - Emerainville• Persan - Beaumont• Saint - Cyr
• Paris - Issy les Moulinaux
THE DOMAINTHE DOMAIN
A leading European airportA leading European airport
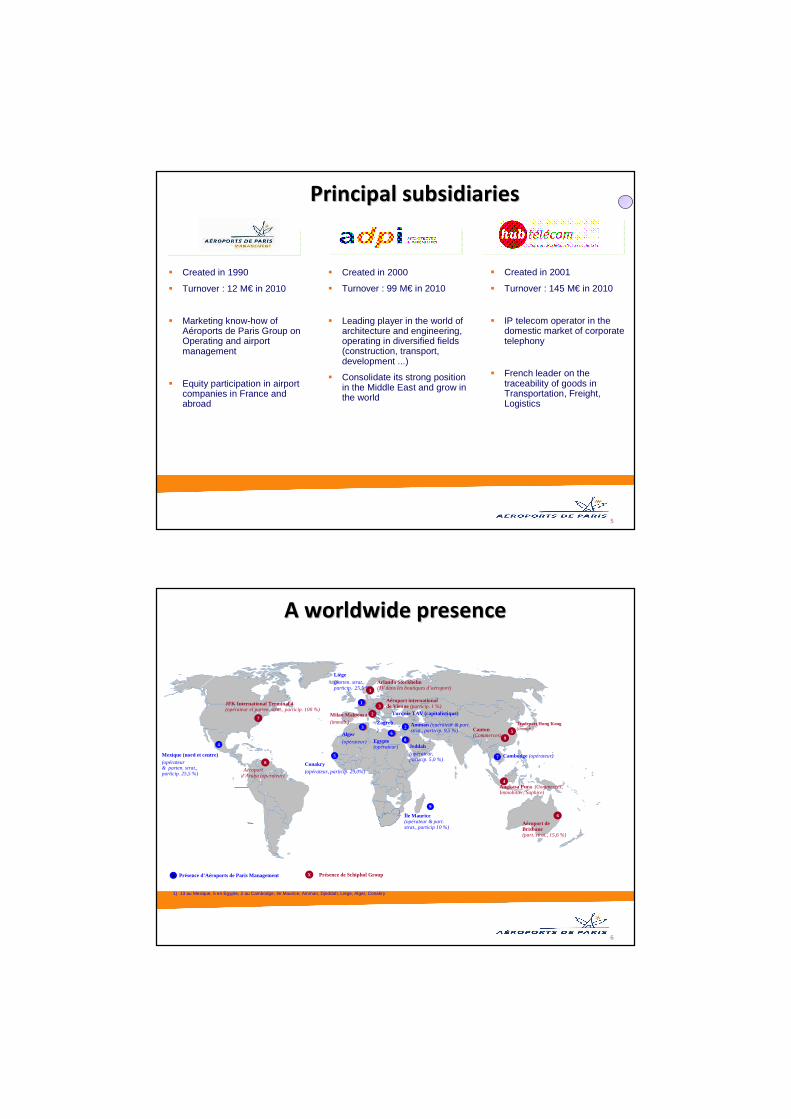
� 2nd European airport group
88,1 million passengers in2011
(+5,4% / 2010)
� Employment
� 12 218 employees Group in 2010
� 6 958 ADP SA
� 5 260 subsidiaries
� 1st European airport group
� in freight and mail
2,4 m tons freight and mail
in 2011 (-3,8% / 2010)
�1st Europeanairport in aviation
business
Le Bourget : Business airport
� 10th European� number of pax
Orly : Short-haul airport and Origin / Destination (“O/D”)
Paris - Le Bourget
Paris - Charles de Gaulle
Paris -Orly
Three highly complementary airportsThree highly complementary airports
2nd european in number of pax7th world by number of pax
CDG : hub dedicated to medium and long haul
5
……
� Created in 2001
� Turnover : 145 M€ in 2010
� IP telecom operator in the domestic market of corporate telephony
� French leader on the traceability of goods in Transportation, Freight, Logistics
…………
� Created in 2000
� Turnover : 99 M€ in 2010
� Leading player in the world of architecture and engineering, operating in diversified fields (construction, transport, development ...)
� Consolidate its strong position in the Middle East and grow in the world
� Created in 1990
� Turnover : 12 M€ in 2010
� Marketing know-how of Aéroports de Paris Group on Operating and airport management
� Equity participation in airport companies in France and abroad
Principal subsidiariesPrincipal subsidiaries
6
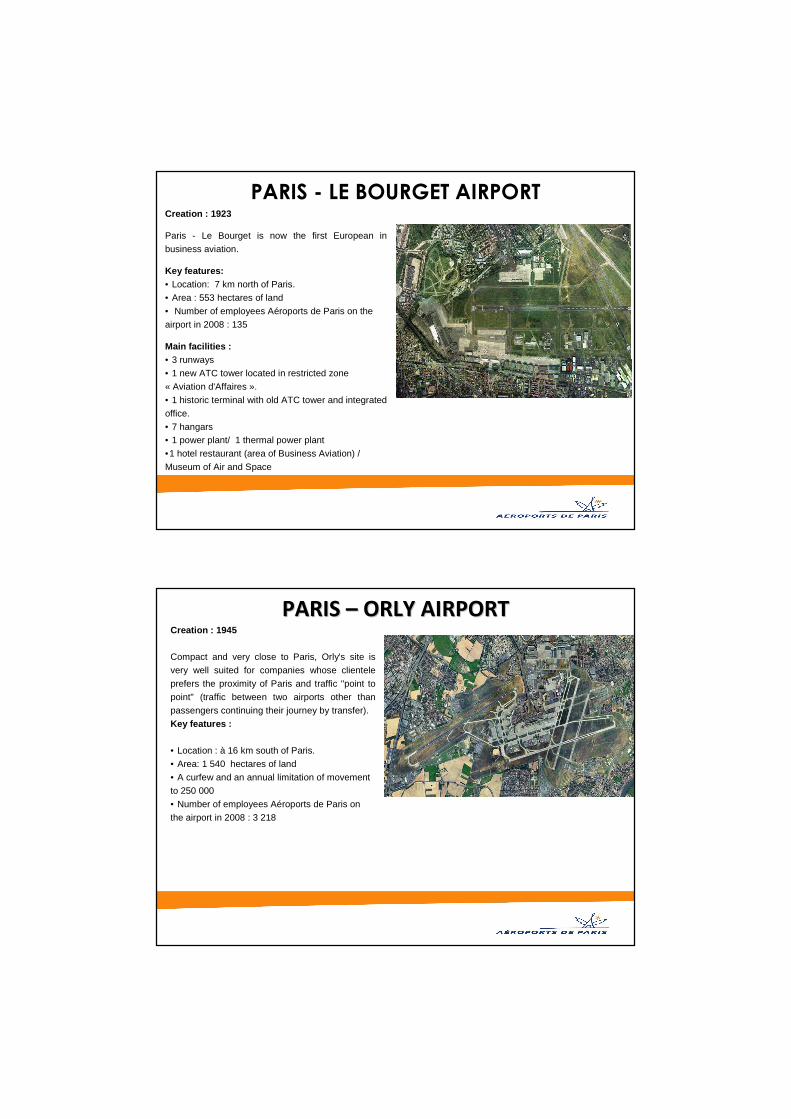
Mexique (nord et centre)(opérateur & parten. strat., particip. 25,5 %)
4
7
JFK International Terminal 4 (opérateur et parten. strat., particip. 100 %)
8
Aéroport d’Aruba (opérateur)
1
Liège(parten. strat., particip. 25,5 %)1
Arlanda Stockholm(JV dans les boutiques d’aéroport)
3Aéroport international de Vienne (particip. 1 %)
2Milan Malpensa(immob.)
2 Amman (opérateur & part. strat., particip. 9,5 %)
Egypte (opérateur)
6Alger(opérateur)
3
5
Conakry(opérateur, particip. 29,0%)
8Jeddah(opérateur, particip. 5,0 %)
Canton(Commerces)
5
Tradeport Hong Kong(immob.)
7 Cambodge (opérateur)
9
4Angkasa Pura (Commerces, Immobilier, Saphire)
Aéroport de Brisbane (part. strat., 15,6 %)
6
9
Île Maurice(opérateur & part. strat., particip 10 %)
X Présence d’Aéroports de Paris Management Présence de Schiphol Group X
1) 13 au Mexique, 5 en Egypte, 2 au Cambodge, Ile Maurice, Amman, Djeddah, Liège, Alger, Conakry
Le portefeuille des participations à l’international : ADPM + Schiphol Group
Turquie TAV (capitalistique)
Zagreb)
1
63
8
A worldwide presenceA worldwide presence
PARIS - LE BOURGET AIRPORTCreation : 1923
Paris - Le Bourget is now the first European in
business aviation.
Key features: • Location: 7 km north of Paris.
• Area : 553 hectares of land
• Number of employees Aéroports de Paris on the
airport in 2008 : 135
Main facilities : • 3 runways
• 1 new ATC tower located in restricted zone
« Aviation d'Affaires ».
• 1 historic terminal with old ATC tower and integrated
office.
• 7 hangars• 1 power plant/ 1 thermal power plant
•1 hotel restaurant (area of Business Aviation) /
Museum of Air and Space
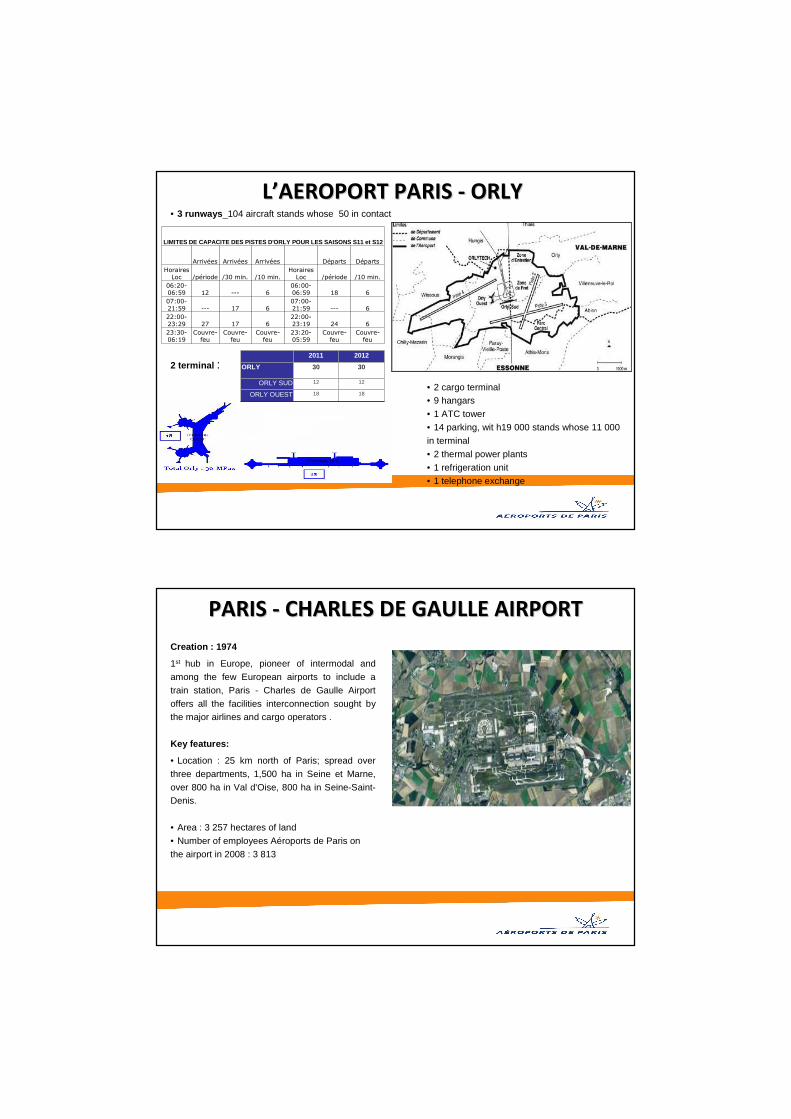
PARIS PARIS –– ORLY AIRPORTORLY AIRPORTCreation : 1945
Compact and very close to Paris, Orly's site is
very well suited for companies whose clientele
prefers the proximity of Paris and traffic "point to
point" (traffic between two airports other than
passengers continuing their journey by transfer).
Key features :
• Location : à 16 km south of Paris.
• Area: 1 540 hectares of land
• A curfew and an annual limitation of movement
to 250 000
• Number of employees Aéroports de Paris on
the airport in 2008 : 3 218
LL’’AEROPORT PARIS AEROPORT PARIS -- ORLYORLY• 3 runways _104 aircraft stands whose 50 in contact
LIMITES DE CAPACITE DES PISTES D'ORLY POUR LES SAIS ONS S11 et S12
Arrivées Arrivées Arrivées Départs Départs
Horaires Loc /période /30 min. /10 min.
Horaires Loc /période /10 min.
06:20-06:59 12 --- 6
06:00-06:59 18 6
07:00-21:59 --- 17 6
07:00-21:59 --- 6
22:00-23:29 27 17 6
22:00-23:19 24 6
23:30-06:19
Couvre-feu
Couvre-feu
Couvre-feu
23:20-05:59
Couvre-feu
Couvre-feu
2 terminal : 2011 2012
ORLY 30 30
ORLY SUD 12 12
ORLY OUEST 18 18• 2 cargo terminal• 9 hangars
• 1 ATC tower
• 14 parking, wit h19 000 stands whose 11 000
in terminal
• 2 thermal power plants
• 1 refrigeration unit
• 1 telephone exchange
PARIS PARIS -- CHARLES DE GAULLE AIRPORTCHARLES DE GAULLE AIRPORT
Creation : 1974
1st hub in Europe, pioneer of intermodal and
among the few European airports to include a
train station, Paris - Charles de Gaulle Airport
offers all the facilities interconnection sought by the major airlines and cargo operators .
Key features:
• Location : 25 km north of Paris; spread over
three departments, 1,500 ha in Seine et Marne,
over 800 ha in Val d'Oise, 800 ha in Seine-Saint-Denis.
• Area : 3 257 hectares of land
• Number of employees Aéroports de Paris on
the airport in 2008 : 3 813
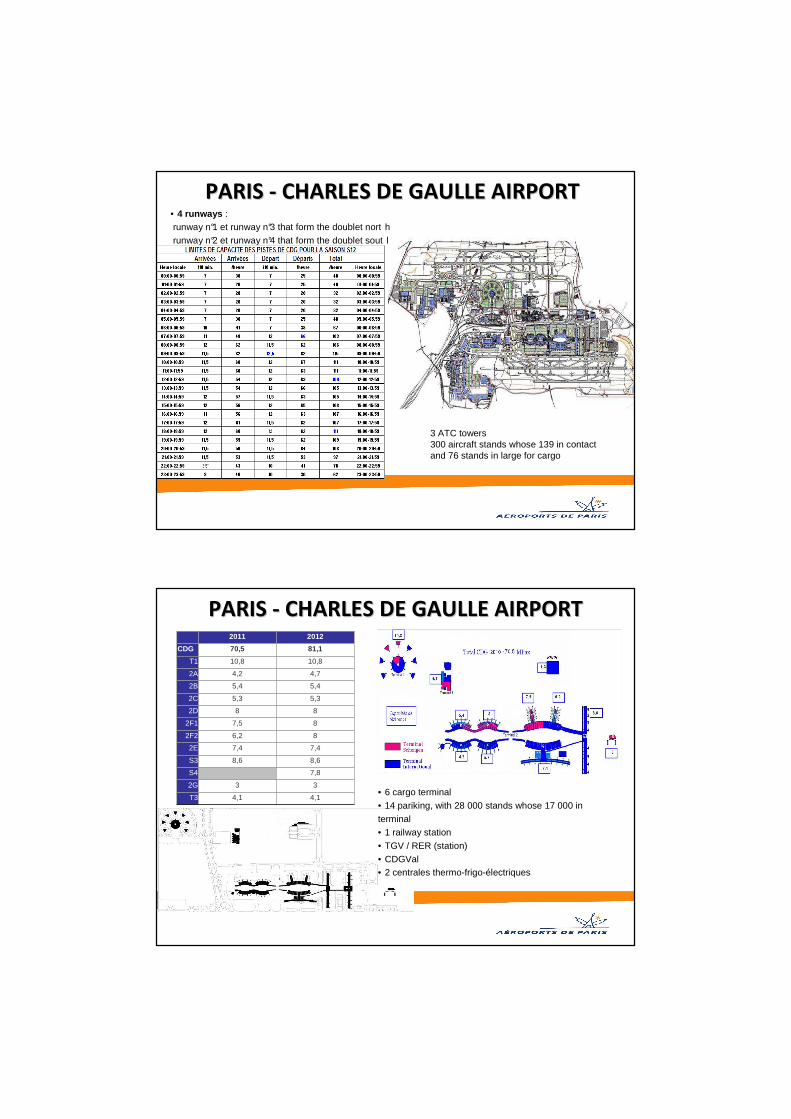
PARIS PARIS -- CHARLES DE GAULLE AIRPORTCHARLES DE GAULLE AIRPORT• 4 runways : runway n°1 et runway n°3 that form the doublet nort h
runway n°2 et runway n°4 that form the doublet sout h
3 ATC towers300 aircraft stands whose 139 in contactand 76 stands in large for cargo
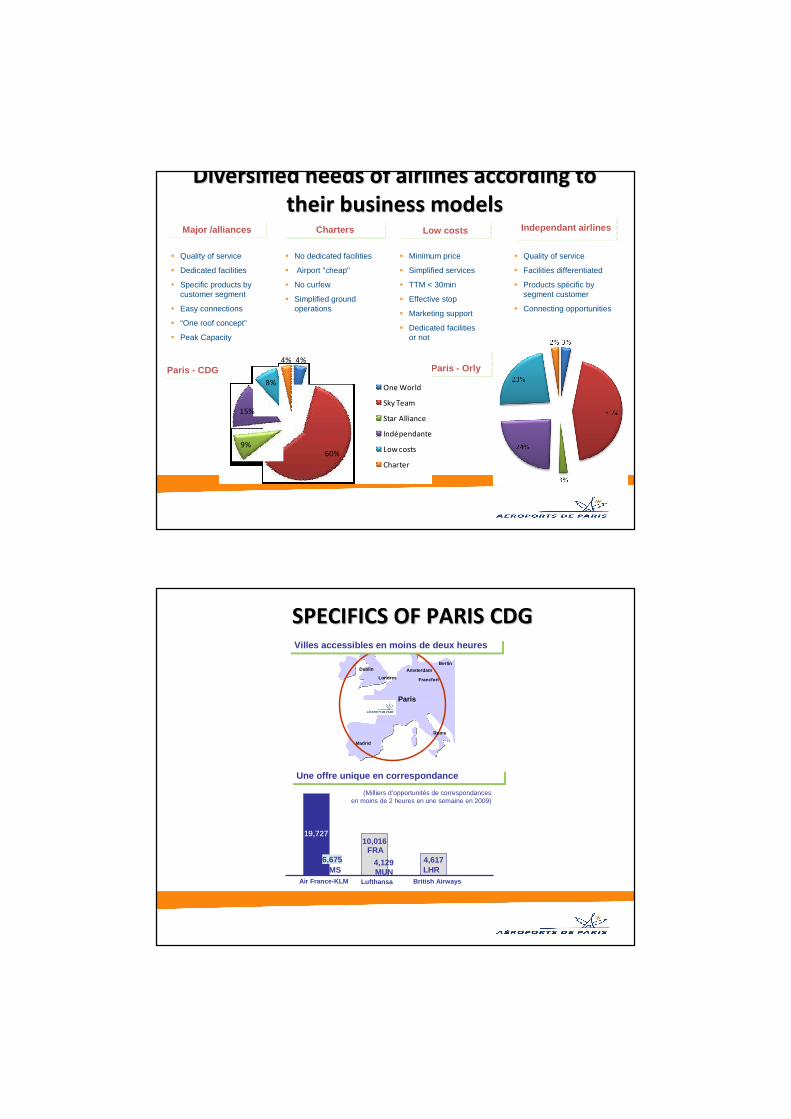
PARIS PARIS -- CHARLES DE GAULLE AIRPORTCHARLES DE GAULLE AIRPORT2011 2012
CDG 70,5 81,1
T1 10,8 10,8
2A 4,2 4,7
2B 5,4 5,4
2C 5,3 5,3
2D 8 8
2F1 7,5 8
2F2 6,2 8
2E 7,4 7,4
S3 8,6 8,6
S4 7,8
2G 3 3
T3 4,1 4,1• 6 cargo terminal
• 14 pariking, with 28 000 stands whose 17 000 in
terminal
• 1 railway station
• TGV / RER (station)
• CDGVal• 2 centrales thermo-frigo-électriques

Key datesKey dates
• 1947 : Aérogare provisoire Nord d’Orly
• 1948 : Orly aérogare Nord
• 1954 : Orly, première aérogare sud
• 1961 : Orly sud
• 1966 : Paris - Orly, nouvelle tour de contrôle
• 1969 : Orly sud satellite west
• 1971 : Orly ouest
• 1974 : Paris – Charles de Gaulle, aérogare 1
• 1981 : 1er module CDG 2 - terminal B
• 1982 : 2ème module CDG 2 - terminal A
• 1989 : 3 éme module CDG 2 - terminal D
• 1993 : 4 ème module CDG 2 - terminal C
• 1994 : Station TGV / RER
• 1998 : terminal 2F (1st part)
• 1999 : Paris – Charles de Gaulle, first runway doublet south and ATC tower south _ 2nd part of terminal 2F
• 2000 : Paris – Charles de Gaulle, runway 3 _ runway doublet north
• 2003 : terminal 2E
• April 2007 : CDGVal
• June 2007 : Galerie Parisienne (S3)
• September 2008 : Terminal 2G
• Summer 2012 : opening S4
Key figures 2011Key figures 2011

Passengers trafic : + 5,7 % in 2011Passengers trafic : + 5,7 % in 2011
– 2009 : 83,0 million de passengers
– 2010 : 83,4 million de passengers
– 2011 : 88,1 million de passengers
Breakdown by destinationBreakdown by airport
Paris-Charles de Gaulle : 298 airlines
479 cities served
Paris-Orly : 93 airlines
248 cities served
Europe : 37,2 Mpax 42,2%
Amériques : 11,4 Mpax 13%
Dom Tom : 3,5 Mpax 3,9%
Extrême Orient : 5,7 Mpax 6,4%
Proche Orient : 3,8 Mpax 4,3%
Afrique : 9,8 Mpax 11,2%
National : 16,7 Mpax 18,9%Paris ORLY : 27,1 Mpax
30,8%
Paris CDG : 61 Mpax 69,2%
Movements : + 3,9 % in 2011Movements : + 3,9 % in 2011
Breakdown by destinationBreakdown by airport
Europe : 380000 51,7%
Amériques : 53000 7,3%
Dom Tom : 10000 1,4%
Extrême Orient : 27000 3,7%
Proche Orient : 22000 3,0%
Afrique : 69000 9,4%
National : 174000 23,6%Paris ORLY : 228 534
31,1%
Paris CDG : 506 888 68,9%
– 2009 : 738 624 commercial movements
– 2010 : 707 578 commercial movements
– 2011 : 735 422 commercial movements

Freight and Mail : Freight and Mail : -- 3,8% in 20113,8% in 2011
– 2009 : 2,16 million de tons
– 2010 : 2,50 million de tons
– 2011 : 2,41 million de tons
Breakdown by airport
Paris-Charles de Gaulle2,3 millions de tonnes
Paris-Orly106 milliers de tonnes
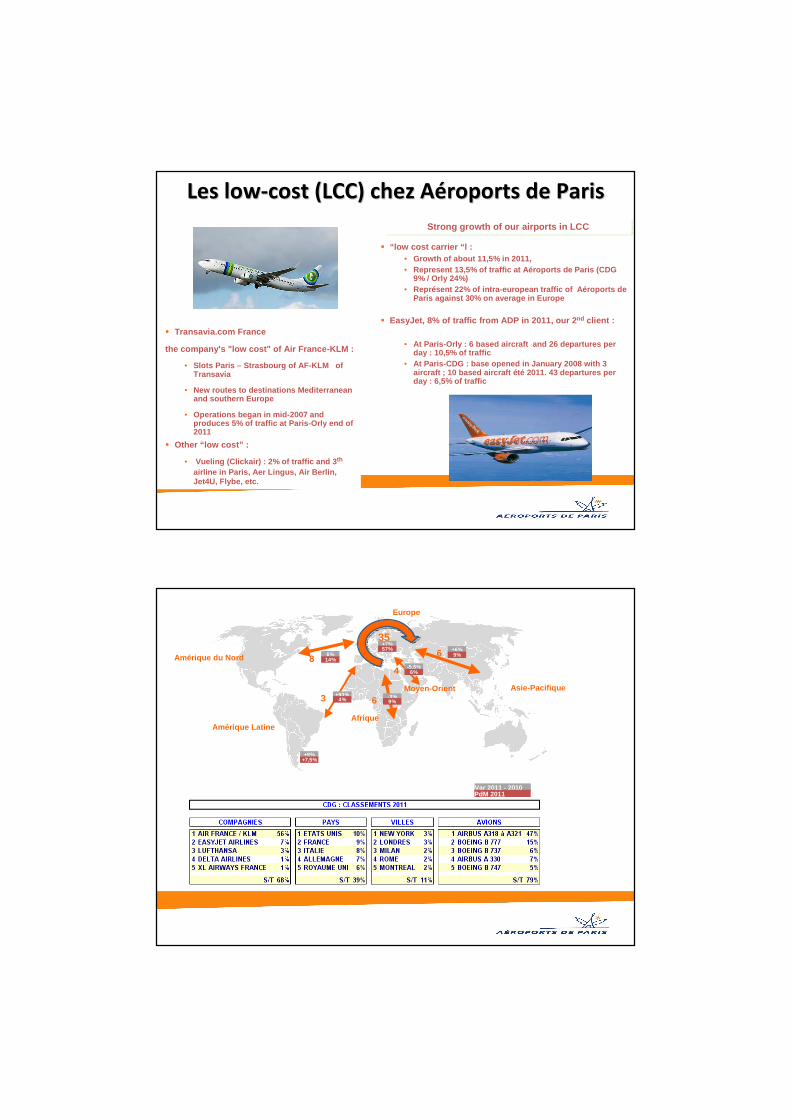
INTERNATIONAL COMPARISONSINTERNATIONAL COMPARISONS
� Quality of service
� Dedicated facilities
� Specific products by customer segment
� Easy connections
� “One roof concept”
� Peak Capacity
� No dedicated facilities
� Airport "cheap"
� No curfew
� Simplified ground operations
� Minimum price
� Simplified services
� TTM < 30min
� Effective stop
� Marketing support
� Dedicated facilitiesor not
� Quality of service
� Facilities differentiated
� Products spécific by segment customer
� Connecting opportunities
Diversified needs of airlines according to Diversified needs of airlines according to
their business modelstheir business models
Paris - CDGParis - CDG Paris - OrlyParis - Orly
Major /alliancesMajor /alliances ChartersCharters Low costsLow costs Independant airlines Independant airlines
4%
60%9%
15%
8%
4%
One World
Sky Team
Star Alliance
Indépendantes
Low costs
Charter
SPECIFICS OF PARIS CDGSPECIFICS OF PARIS CDG
Madrid
Rome
Londres
AmsterdamBerlin
Paris
Dublin
Francfort
(Milliers d’opportunités de correspondances en moins de 2 heures en une semaine en 2009)
Air France-KLM Lufthansa British Airways
19,72710,016
4,617FRA
LHR6,675AMS MUN
4,129
Une offre unique en correspondanceUne offre unique en correspondance
Villes accessibles en moins de deux heuresVilles accessibles en moins de deux heures

CDG, hub the must powerful in EuropeCDG, hub the must powerful in Europe
Weekly connecting opportunities through medium/ lo ng –haul in less than two hours - Source Air France
Roissy is also a triple cargo hub: Air France, Fede x and the Post
The Air France Hub at CDGThe Air France Hub at CDGPrinciple of the european hubPrinciple of the european hub
� Creating ranges visit which will
concentrate arrivals and departures
…. increasing opportunities for
connecting flights between medium-
haul and long haul flights
… to multiply with limited waiting time
between flights
PAU CDG
ETC…
50% of transfer
1,9 pax / volvers Luanda
0,2 pax / volvers Londres
0,1 pax / volvers Bombay
6:30 12:30 15:10 18:10 22:209:30
P1 P3 P3bis P4 P5P2
45mn2:403:00 3:00 3:00 4:10
Arrival LH (1) onlyet départure MH(2) only (whose primes times to Europe)
Arrivalsprime timeEurope
Départuresprime time
Europe
Arrivals MHand départures
LH only
MCT : 60 minutes
~25000 opportunities of connections MH et LH in less 2 hours per week
1300 possibilities of connections in P2 with only 80 flights in 2010 !
Le Hub d’Air France à CDG
1) LH = long haul
2) MH= medium haul
Départures LH (USA...)

Airports rethink the allocation of terminals and their relationship with the airlines according to the development of alliances
� Affiliated companies tend to be grouped in
the same terminal
• Strong commitment alliances (eg "Move-
under-one-Roof" Star Alliance to all
international airports)
• Principle of allocating terminals at CDG by
ADP
� These combinations result in:
• A heavier peaks connection to CDG
• A change in power relations between
airport and airlines (eg market share of
Lufthansa passengers at CDG: 2.6%,
11.4% for Star Alliance
T1
2A
2B
2C
2D
2E
2FS3
� Aer Lingus
� Qatar
� Olympic
� Malaysia
� BMI Baby
� Air Canada
� Etihad
� Air Austral
� El Al
� Air Algérie
� easyJet
� JAL
� Emirates
� Austrian
� China Eastnern
� Air India
� Gulf Air
+
+
+
Les alliances à CDG
Current allocation of the terminals of CDG
- Incomplete list -
The key user airlines from the Paris airportsThe key user airlines from the Paris airports
A fairly good balance between the weight of a powerful airline based and offers a sufficiently diversified and competitive:
�Air France/KLM 3° world airline and 1° european passengers (74 M in 2008) 2° world airline and 1° european in PKT (208 billions) 2° world airline and 1° european for freight ( 10 billions TKT) Turnover 2008/09: 24,7 MM€ (78% passengers, 12% cargo) – 2009/2010: 21 MM€ Air France is the largest private employer in IDF with nearly 50,000 employees Air France/KLM is 54% of passenger traffic ADP and 23.5% of its turnover in 2009
�Fedex 1° world airline for cargo ( 15,5 billions TKT). At CDG with 300 weekly flighs, the FedEx’ hub has a capacity of processing 1500 tonnes of packages per day, or 31,500 packages per hour
�Easyjet 14° world airline et 4° european passengers (44 M pax in 2008 ) after Air France-KLM, Ryanair and Lufhansa Group. 25° world airline and 6° european in PKT (48 billions) (The european low cost traffic is assured at 40% by Ryanair, 30% Easyjet and 30% the other low cost)
� Transavia.com France
the company's "low cost" of Air France-KLM :
• Slots Paris – Strasbourg of AF-KLM of Transavia
• New routes to destinations Mediterranean and southern Europe
• Operations began in mid-2007 and produces 5% of traffic at Paris-Orly end of 2011
� Other “low cost” :
• Vueling (Clickair) : 2% of traffic and 3 th
airline in Paris, Aer Lingus, Air Berlin, Jet4U, Flybe, etc.
� “low cost carrier “l :• Growth of about 11,5% in 2011,• Represent 13,5% of traffic at Aéroports de Paris (C DG
9% / Orly 24%)• Représent 22% of intra-european traffic of Aéropor ts de
Paris against 30% on average in Europe
� EasyJet, 8% of traffic from ADP in 2011, our 2 nd client :
• At Paris-Orly : 6 based aircraft and 26 departures per day : 10,5% of traffic
• At Paris-CDG : base opened in January 2008 with 3 aircraft ; 10 based aircraft été 2011. 43 departures per day : 6,5% of traffic
Strong growth of our airports in LCCStrong growth of our airports in LCC
Les lowLes low--cost (LCC) chez Acost (LCC) chez Aééroports de Parisroports de Paris
Amérique du Nord
Europe
Amérique Latine
Asie-PacifiqueMoyen-Orient
Afrique
84
35
6
6
3
+9%+7,5%
6%14%
+93%4% -3%
9%
+7%57%
-5,5%6%
+6%9%
Var 2011 - 2010PdM 2011
Arrivé es Dépa rts Tota lCDG Da te s Tra fic Dates Tra fic Dates Tra fic
Pointe s m ensue lles ju illet 23 097 ju illet 23 113 ju illet 46 210
Pointe s journa liè re s1 9 ju il 2010 804 25 ju in 2010 813 25 juin 2010 1 616 2 25 ju in 2010 803 9 ju il 2010 809 9 ju il 2010 1 613 3 16 ju il 2010 792 2 ju il 2010 806 2 ju il 2010 1 597 4 27 août 2010 792 27 août 2010 801 27 août 2010 1 593 5 2 ju il 2010 791 30 ju il 2010 799 30 ju il 2010 1 588
Pointe s hora ires 2010 - Pointe maximale 12 août 2010 71 13 mars 2010 78 3 ju il 2010 127 - 40ème heure 64 67 115
Pointe s "record" - Pointe maximale 29 sept 2008 71 2 oct 2007 78 14 ju il 2006 135 - 40ème heure 2007 66 2008 70 2008 122
0
20
40
60
80
100
120
D e 0h à
1h
De2h à3h
De4h à5h
De6h à7h
De8h à9h
De10h
à 11h
De12hà
13h
De14hà
15h
De16hà
17h
De18hà
19h
De20h
à21h
De22h
à23h
Mouvements
CDG ORLY
Nombre moyen de mouvements commerciaux
0
10 000
20 000
30 000
40 000
50 000
60 000
70 000
2001 2002 2003 2004 2005 2006 2007* 2008 2009 2010
National U.E.Autre International Total
Passagersen mil liers
Trafic passagers locaux CDG
Tranche kilométrique Passagers PartVariations2010/2009
de 0 à 500 km 9 936 258 11,9% -2,3%
de 501 A 1000 km 23 122 862 27,8% -2,7%
de 1001 A 2000 km 18 790 815 22,6% 2,5%
de 2001 A 3000 km 4 827 567 5,8% 6,4%
de 3001 A 5000 km 4 380 812 5,3% 2,5%
de 5001 A 10000 km 21 034 815 25,3% 1,5%
plus de 10000 km 1 180 972 1,4% 4,3% 100,0%
Part cumulée
62,3%
68,1%
73,3%
98,6%
11,9%
39,7%
Données 2010
THANK YOU