presentation of half year results 13 february 2001
Post on 18-Dec-2015
214 views
TRANSCRIPT

Presentation of Half Year ResultsPresentation of Half Year Results13 February 200113 February 2001
www.commbank.com.auwww.commbank.com.au
Presentation of Half Year ResultsPresentation of Half Year Results13 February 200113 February 2001
www.commbank.com.auwww.commbank.com.au
2
The material that follows is a presentation of The material that follows is a presentation of general background information about the Bank’s general background information about the Bank’s activities current at the date of the presentation, 13 activities current at the date of the presentation, 13 February 2001. It is information given in summary February 2001. It is information given in summary form and does not purport to be complete. It is not form and does not purport to be complete. It is not intended to be relied upon as advice to investors or intended to be relied upon as advice to investors or potential investors and does not take into account potential investors and does not take into account the investment objectives, financial situation or the investment objectives, financial situation or needs of any particular investor. These should be needs of any particular investor. These should be considered, with or without professional advice considered, with or without professional advice when deciding if an investment is appropriate.when deciding if an investment is appropriate.
DisclaimerDisclaimer

3
Speaker’s NotesSpeaker’s Notes
• Speaker’s notes for this presentation Speaker’s notes for this presentation are attached below each slide.are attached below each slide.
• To access them, you may need to To access them, you may need to save the slides in PowerPoint and save the slides in PowerPoint and view/print in “notes view.”view/print in “notes view.”

4
• Significant progress on the integration Significant progress on the integration
• Strong interest earnings with improved marginStrong interest earnings with improved margin
• Good growth in other banking incomeGood growth in other banking income
• Strong new business growth in funds managementStrong new business growth in funds management
• Good inflows of insurance new businessGood inflows of insurance new business
• Actions taken to address market shareActions taken to address market share
• Lower insurance earnings due to weak equity marketsLower insurance earnings due to weak equity markets
• Costs reflect volume growth and new businessesCosts reflect volume growth and new businesses
• $700m off-market share buy-back$700m off-market share buy-back
OverviewOverview

5
• Performance HighlightsPerformance Highlights
• Income and ExpenditureIncome and Expenditure
• Balance SheetBalance Sheet
• Colonial MergerColonial Merger
• Funding and CapitalFunding and Capital
• Performance HighlightsPerformance Highlights
• Income and ExpenditureIncome and Expenditure
• Balance SheetBalance Sheet
• Colonial MergerColonial Merger
• Funding and CapitalFunding and Capital
AgendaAgenda

Performance HighlightsPerformance Highlights
Commonwealth Bank GroupCommonwealth Bank GroupSet out in this presentation are unaudited proforma graphs and tables which comprise the profit and loss, balance sheet and life insurance and funds management statistics for the Commonwealth Bank Group and Colonial Limited for the half years ending December 1999 and June 2000. These have been prepared to illustrate the proforma consolidated position of Commonwealth Bank and Colonial as if Colonial had been merged with Commonwealth Bank as at 31 December 1999 for balance sheet purposes and from 1 July 1999 to 30 June 2000 for profit and loss purposes.
The proformas do not include goodwill amortisation or life insurance appraisal value uplift. The results included within the profit and loss have been adjusted for abnormal items and other items not considered part of the ongoing operations, such as the effect of Colonial’s UK life insurance business which was sold during the year and specific payments made by Colonial in relation to the merger with Commonwealth Bank. [No adjustments have been made for inconsistencies in accounting policies between Colonial and Commonwealth].

7
1,033 1,0351,109
0
200
400
600
800
1,000
1,200
Dec 1999** Jun 2000** Dec 2000
$m
Net Operating Profit* Net Operating Profit*
* * * * ProformaProforma
* * Net Profit after tax and outside equity interest - cash basis. Net Profit after tax and outside equity interest - cash basis. Excludes abnormal items, appraisal value uplift and goodwill amortisation.Excludes abnormal items, appraisal value uplift and goodwill amortisation.

8
Lending Assets GrowthLending Assets Growth
139,092
145.159
* Proforma
** Excludes securitised housing loan balances $4.7b (Dec’ 2000), $3b (June 2000), $1.7b (Dec’1999).
147,759

9
Australian Market Share Australian Market Share
Jun 2000
Dec2000
Home loans n/a 23.30%*
Credit Cards 29.00% 29.00%
Personal Loans 24.97% 24.93%*
Retail Deposits 25.29% 24.61%
Retail FUM 16.00% 16.77%**
Retail Broking 9.00% 8.50%* As at 30 November 2000** As at 30 September 2000

10
Home Loan Market ShareHome Loan Market Share
Commonwealth Bank Group Market Share (all lenders)
January - November 2000
15.00%
17.00%
19.00%
21.00%
23.00%
25.00%
27.00%
29.00%
31.00% OwnerOccupiedApprovals
OwnerOccupiedBalances
ResidentiallySecuredApprovals
ResidentiallySecuredBalances
*
* Since September APRA all lenders includes home loan reclassification (ie home equity and similar facilities). Figures have been adjusted for HEF proforma back to January 2000.
**
** APRA data includes owner occupied loans, home equity and similar facilities and investment home loans.
*
**

11
Jun2000
Dec 2000
Retail Lending 15% 16%
Retail Deposits 18% 18.5%
Credit Cards 12% 13.8%
Retail Funds Management 3.75% 4.7% est.
Main Bank Share 15% 16%
New ZealandNew Zealand
New Zealand Market Share New Zealand Market Share ASB GroupASB Group
12
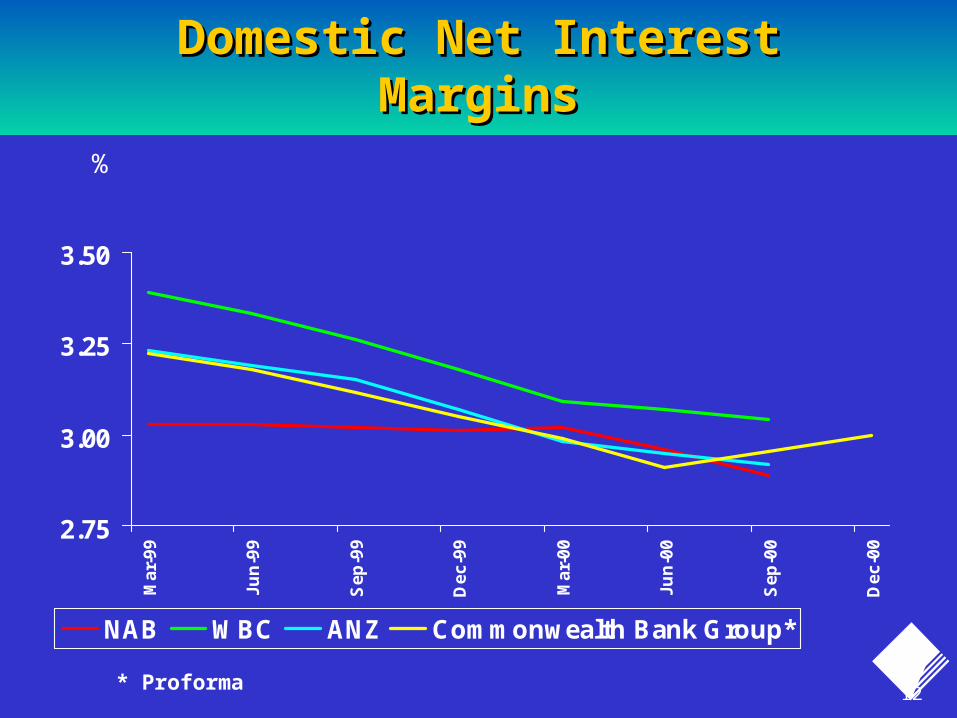
Domestic Net Interest MarginsDomestic Net Interest Margins
2.75
3.00
3.25
3.50
Ma
r-9
9
Ju
n-9
9
Se
p-9
9
De
c-9
9
Ma
r-0
0
Ju
n-0
0
Se
p-0
0
De
c-0
0
NAB WBC ANZ Commonwealth Bank Group*
%
* Proforma

Income and ExpenditureIncome and Expenditure

14
0500
1,0001,5002,0002,5003,0003,5004,0004,5005,000
Dec 1999* Jun 2000* Dec 2000
$m
Net Interest Income Other Banking Operating Income
Funds Management Income Life Insurance Income
Operating Income Operating Income
4,2014,201 4,2314,231
49%
26%
* Proforma
4,4014,401
19%
49%
26%
18%
51%
27%
15%7%
7%6%
15
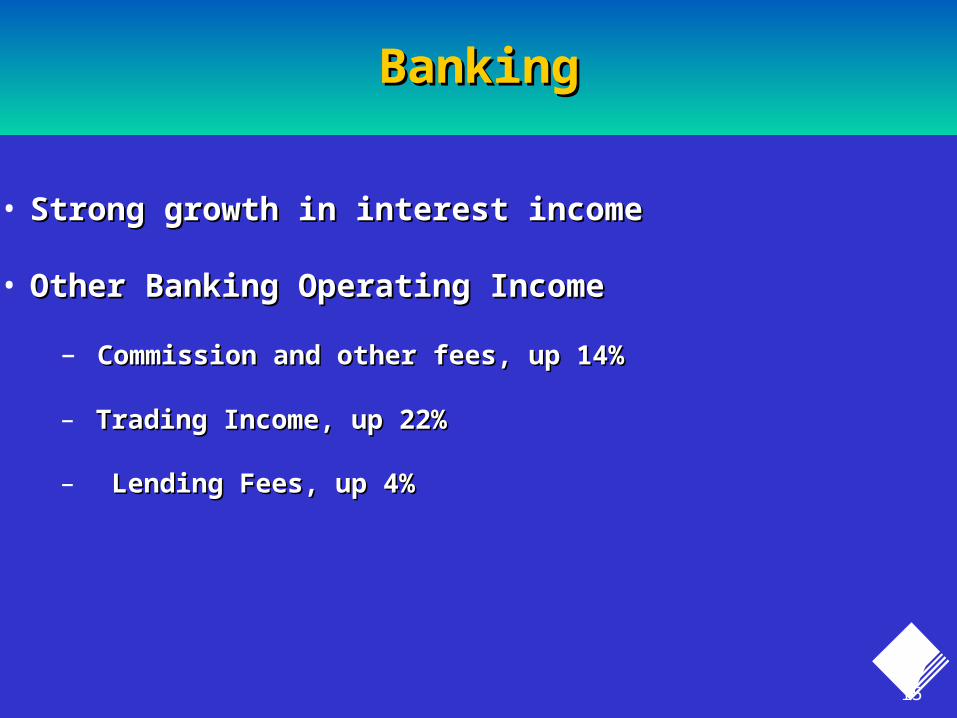
BankingBanking
• Strong growth in interest incomeStrong growth in interest income
• Other Banking Operating IncomeOther Banking Operating Income
– Commission and other fees, up 14%Commission and other fees, up 14%
– Trading Income, up 22%Trading Income, up 22%
– Lending Fees, up 4%Lending Fees, up 4%

16
Funds ManagementFunds Management
31/12/99*$M
30/06/00*$M
31/12/00$M
Operating income 255 318 340
Operating expenses 186 224 224
Operating profit before tax 69 94 116
Income tax expense 21 31 38
Operating profit after tax 48 63 78
* * Proforma

17
Funds ManagementFunds Management
23
28 32 35
2423 24
2018
212214
1210
8
0
20
40
60
80
100
120
140
Dec 1999* Jun 2000 Dec 2000
$b
Australian Retail Funds** Australian Wholesale Funds
International Funds Australian Life Assets
Other Life Assets
9292107107
115115
** Includes listed property trusts** Includes listed property trusts* Proforma* Proforma

18
Life InsuranceLife Insurance
31/12/99*$M
30/6/00*$M
31/12/00$M
The Margin on Services operating profit after taxis represented by :
Planned profit margins 103 122 128Experience Variation (12) (8) (33)New business / losses reversal ofcapitalised losses
11 2 (3)
Operating margins 102 116 92Investment earnings on assets in excessof policy liabilities
91 52 68
Other - 2 (4)Operating profit after income tax 193 170 156
* * Proforma
Sources of life insurance operating profit (excluding abnormals)

19
Life InsuranceLife Insurance
Target investment mix is 50 : 50 growth : income
As at December 2000– 38% is directly invested in equity markets– 12% is invested in property
Overall earnings were adversely impacted by poor equity returns for the period.
– net earnings on shareholder assets of $21m versus $91m for the same period in 1999
– Aust $28m vs $66m NZ $1m vs $7m Asia (-$8m) vs $18m
While returns have been poor, they have been in line with market indices– (-3%) return on All Ords index [~50% of total share exposure]– 3% return on Dow Jones index [~20% of total share exposure]– (-3%) return on Euro top 300 [10% of total share exposure]
Investment Earnings
20
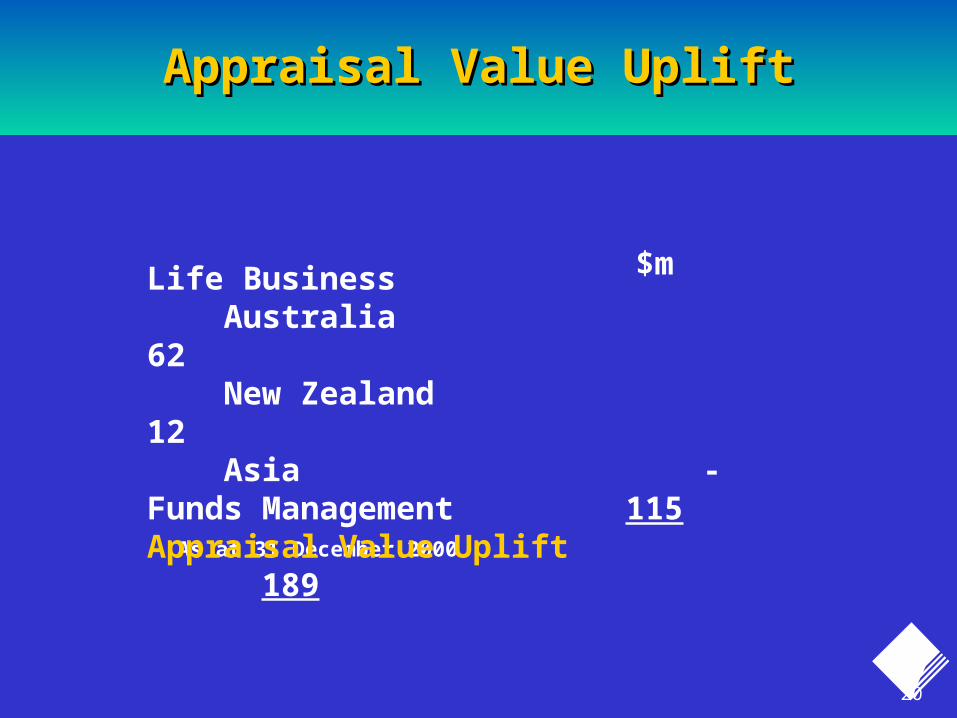
Appraisal Value UpliftAppraisal Value Uplift
$m
As at 31 December 2000
Life Business Australia 62 New Zealand 12 Asia -Funds Management 115Appraisal Value Uplift 189

21
Operating Expense AnalysisOperating Expense Analysis
2,349 2,427 2,470
46 115
0
500
1,000
1,500
2,000
2,500
3,000
Dec 1999* Jun 2000* Dec 2000
$m
Existing Operations Business acquisitions and GST
2,5852,585
* Proforma
2,4732,473
22
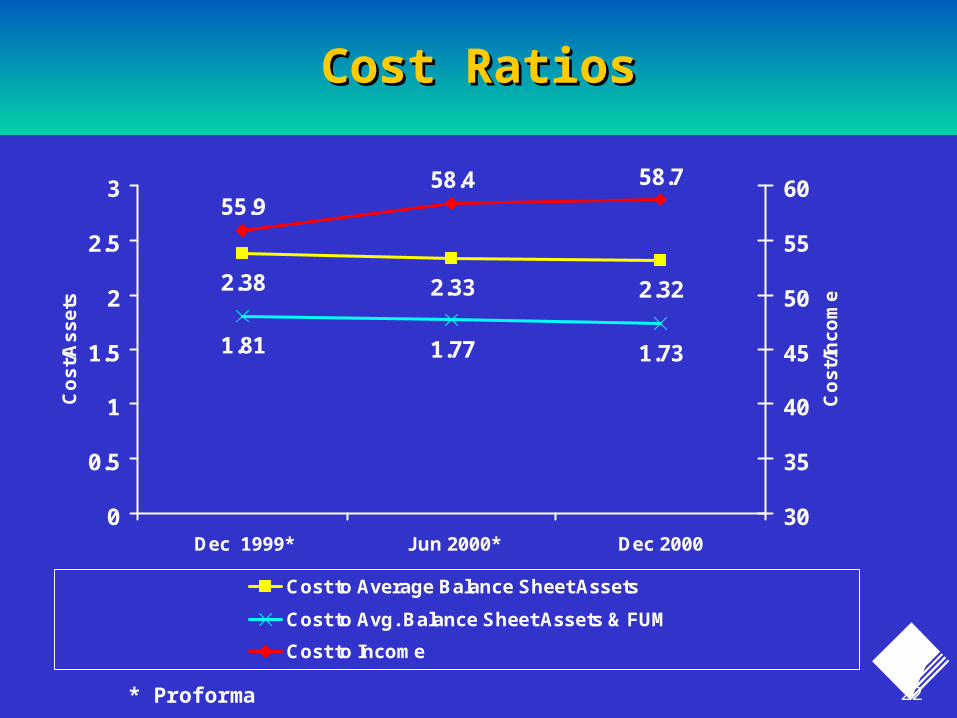
Cost RatiosCost Ratios
2.38 2.33 2.32
1.81 1.77 1.73
55.958.4 58.7
0
0.5
1
1.5
2
2.5
3
Dec 1999* Jun 2000* Dec 2000
Co
st/
As
se
ts
30
35
40
45
50
55
60
Co
st/
Inc
om
e
Cost to Average Balance Sheet Assets
Cost to Avg. Balance Sheet Assets & FUM
Cost to Income
* Proforma

– GoodwillGoodwill
– Asset QualityAsset Quality

24
GoodwillGoodwill
Goodwill amortisation HY31/12/00
$m
Colonial Acquisition 136ASB Group – Acquisition of Minority 3State Bank Victoria 20Other Group Entities 4
Total 163

25
Credit RiskCredit Risk
Total Risk Rated Exposures
0%
20%
40%
60%
80%
100%
30 June 2000 31 December 2000
% o
f E
xpo
sure
Other
BBB
A
AAA/AA

26
0
200
400
600
800
1,000
1,200
1,400
1,600
1,800
2,000
Jun94
Dec94
Jun95
Dec95
Jun96
Dec96
Jun97
Dec97
Jun98
Dec98
Jun99
Dec99
Jun00*
Dec00*
$m
0
50
100
150
200
250
300
%
General Provision
Specific Provision
Total Provisions/Gross Impaired Assets (axis on right)
Aggregate ProvisionsAggregate Provisions
* Includes Colonial

27
Net Impaired AssetsNet Impaired Assets
* Commonwealth Bank Group excluding Colonial

Colonial MergerColonial Merger

29
Integration ExpenditureIntegration Expenditure
Provision30/06/00
$m
ExpenditureHalf Year Ended
31/12/00$m
Provision31/12/00
$mRestructuring Costs
Colonial 294 62 232Commonwealth Bank 106 41 65
Total restructuring costs (pre tax) 400 103 297
Restructure Provision

30
Integration Related Staff MovementsIntegration Related Staff Movements
BusinessCase
Merger
Jan-00 Jun-00
Total Staff 40,018 39,575
Franchise Staff (56)
EDS Migration
Other Colonial Net Change 7
Retrenchments (129)
(178)
Movement
Jan to DecDec-00
38,028 (1,990)
(107)
(328)
(176)
(570)
(1,181)Total Integration Mvt
(183)
(441)
(1,003)
(51)
(328)
(1,181)
(853)
31
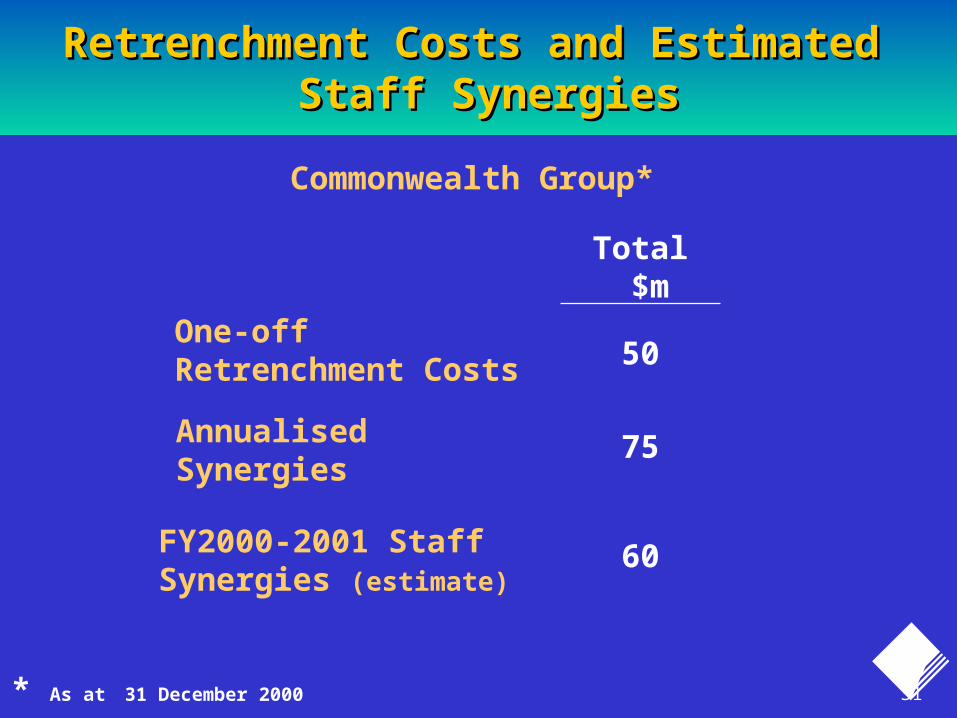
RetrenchmentRetrenchment Costs and Estimated Staff Costs and Estimated Staff SynergiesSynergies
Commonwealth Group*
Total $m
One-off Retrenchment Costs 50
Annualised Synergies
75
FY2000-2001 StaffSynergies (estimate)
60
* As at 31 December 2000

Funding and CapitalFunding and Capital

33
FundingFunding SourcesSources
A$bA$b %%
$3.2b$3.6b $5.5b
$3.2b
$6.4b$1.5b
$6.8b
Offshore - Public
Offshore - Private
Domestic - Public
Domestic - Private
USCP
ECP
NCD
RetailRetail WholesaleWholesale
Long Long TermTerm
54%54%
Short Short TermTerm
46%46%
Total $30bnTotal $30bn
At 31 December 2000At 31 December 2000

34
Funding InitiativesFunding Initiatives
• A$750 m Fixed Rate Bonds
• The Group’s first integrated wholesale & retail transaction launched in Aust mkt
• Orders taken online via ComSec
• Minimum parcel size $5000
• ASX listing & quotation
““Commets” IssueCommets” IssueGlobal Mortgage Global Mortgage Backed SecurityBacked Security
Japanese Retail Japanese Retail Bond IssuesBond Issues
• Two Global deals totalling A$4b overthe last 12 months
• SEC registered regular global benchmark issuance
• Benchmark for other Aust. MBS issues
• Further Global MBS expected during 2001
• A$450m of retail issues over the last 12 months
• Participation by over 30,000 retail investors
• Registered with the Japanese Ministry of Finance
• Most cost-effective source of long termAUD borrowings

35
Capital AdequacyCapital Adequacy
30 Jun 00 31 Dec 00 30 Jun 00 31 Dec 00
Gross Tier I 18,265 18,409Gross Tier I 18,265 18,409Less Goodwill (5,905) (6,007)Less Goodwill (5,905) (6,007)Preference Shares (86) (39) Preference Shares (86) (39) intangible component of investment intangible component of investment in non- consolidated subsidiaries in non- consolidated subsidiaries (2,656)(2,656) (3,449)(3,449)
Net Tier 1 9,618 8,914Net Tier 1 9,618 8,914Tier 1 Ratio 7.49% 6.71%Tier 1 Ratio 7.49% 6.71%Upper Tier 2 1,292 1,346Upper Tier 2 1,292 1,346Lower Tier 2 Lower Tier 2 4,8054,805 4,4564,456Total Tier 1 and Tier 2 15,715 14,716Total Tier 1 and Tier 2 15,715 14,716 Less Investment in non consolidated Less Investment in non consolidated subsidiaries net of intangible component subsidiaries net of intangible component deducted from Tier 1 (2,528) (2,169)deducted from Tier 1 (2,528) (2,169)
Other Other (669)(669) (109)(109)Total Capital Total Capital 12,51812,518 12,43812,438Total Capital Ratio 9.75% 9.37%Total Capital Ratio 9.75% 9.37%

36
ROE and EPSROE and EPS
0
5
10
15
20
25
Dec 1999* Jun 2000* Dec 2000
0
25
50
75
100
ROE - Cash Basis EPS ("Cash" Earnings)
ROEROE EPSEPS
* As reported in prior profit announcements (i.e. not proforma)

37
Annual DividendsAnnual Dividends
20 20 24
36 3845 46 49
58 61
20 22
36
4652
57 58
66
72
0
25
50
75
100
125
150
1992 1993 1994 1995 1996 1997 1998 1999 2000 2001
Ce
nts
0
10
20
30
40
50
60
70
80
90
100
%
First Half Second Half Payout Ratio
38
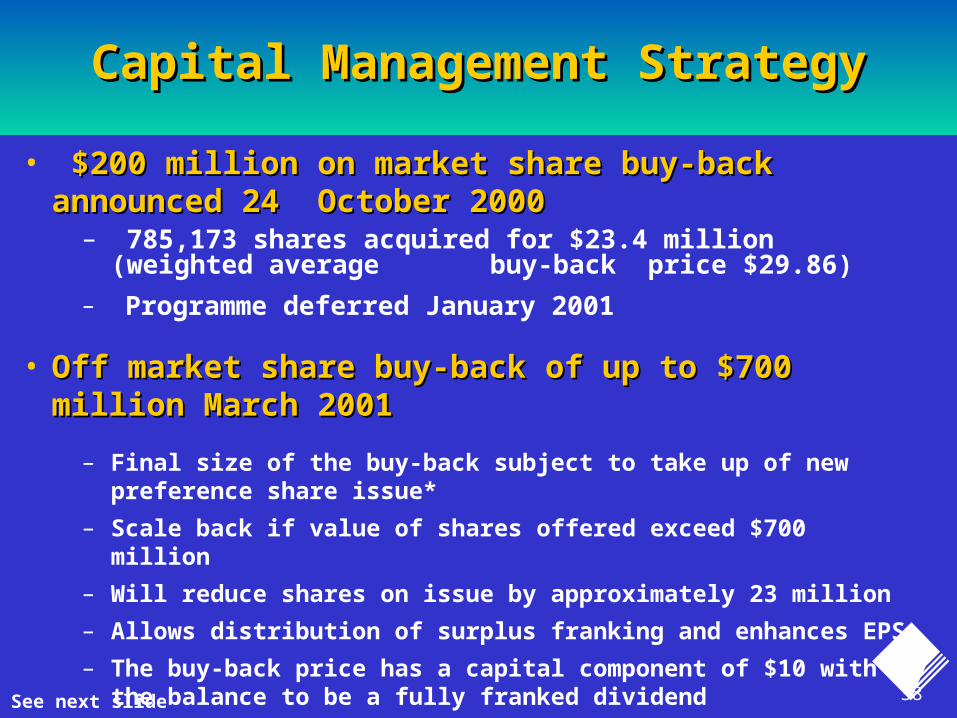
Capital Management StrategyCapital Management Strategy
• $200 million on market share buy-back announced 24 $200 million on market share buy-back announced 24 October 2000 October 2000
– 785,173 shares acquired for $23.4 million (weighted average buy-back price $29.86)
– Programme deferred January 2001
• Off market share buy-back of up to $700 million March Off market share buy-back of up to $700 million March 20012001
– Final size of the buy-back subject to take up of new preference share issue*
– Scale back if value of shares offered exceed $700 million
– Will reduce shares on issue by approximately 23 million
– Allows distribution of surplus franking and enhances EPS
– The buy-back price has a capital component of $10 with the balance to be a fully franked dividend
* See next slide

39
Capital Management StrategyCapital Management Strategy
• Preference Share Issue of $700 million in April 2001 Preference Share Issue of $700 million in April 2001 – Qualifies as Tier 1 capital
– Listed on the ASX
– Non-cumulative floating rate dividend for the first five years based off the Bank Bill rate
– Expected to be fully franked
– Dividends payable quarterly
– Investor flexibility to exit their investment at the Issue Price on each Rollover date from the fifth year
– Rated A- / a1 / A+ (Standard & Poor’s / Moody’s / Fitch IBCA)

40
SummarySummary
0
5
10
15
20
25
30
35
Dec1996
Jun1997
Dec1997
Jun1998
Dec1998
Jun1999
Dec1999
Jun2000
Dec2000
Sh
are
pri
ce
$
0
10
20
30
40
To
tal
Sh
are
ho
lde
r R
etu
rn %
Closing share price at half years ($) Total Shareholder Return for 5 years (%)Average TSR (ANZ, NAB, Westpac)

Presentation of Half Year ResultsPresentation of Half Year Results13 February 200113 February 2001
www.commbank.com.auwww.commbank.com.au
Presentation of Half Year ResultsPresentation of Half Year Results13 February 200113 February 2001
www.commbank.com.auwww.commbank.com.au