présentation powerpoint - kering.com · this presentation does not constitute an offer of...
TRANSCRIPT

2015 September 2015
I n v e s t o r
P r e s e n t a t i o n
2

Disclaimer
3
This presentation does not constitute an offer of securities for sale in the United States of America or any other jurisdiction.
Certain information contained in this document may include projections and forecasts. They express objectives based on current assessments and estimates of the Group’s executive management which are subject to numerous factors, risks and uncertainties. Consequently, reported figures and assessments may differ significantly from projected figures. The following factors among others set out in the Reference Document (Document de Référence) filed with the French Financial Markets Authority (Autorité des Marchés Financiers - AMF) on April 1st, 2015 which is available on Kering’s website at www.kering.com may cause actual figures to differ materially from projected figures: any unfavourable development affecting consumer spending in the activities of the Group in France and abroad, notably for products and services sold by the Luxury Goods and Sport & Lifestyle brands, the events, crises, fears, and resulting costs of complying with environmental, health and safety regulations and all other regulations with which Group companies are required to comply; the competitive situation on each of our markets; exchange rate and other risks related to international activities; risks arising from current or future litigation. Kering gives no commitment to updating and/or revising and/or commenting any projections and forecasts, or their impact on the results and perspectives of the Group, which may be contained in this presentation.
The information contained in this document has been selected by the Group’s executive management to present Kering’s First-Half 2015 results. This document has not been independently verified. Kering makes no representation or undertaking as to the accuracy or completeness of such information. None of the Kering or any of its affiliates representatives shall bear any liability (in negligence or otherwise) for any loss arising from any use of this presentation or its contents or otherwise arising in connection with this presentation.
IN NO WAY DOES KERING ASSUME ANY RESPONSIBILITY FOR ANY INVESTMENT OR OTHER DECISIONS MADE BASED UPON THE INFORMATION PROVIDED IN THIS PRESENTATION. READERS ARE ADVISED TO REVIEW THE COMPANY'S REFERENCE DOCUMENT AND THE COMPANY'S APPLICABLE AMF FILINGS BEFORE MAKING ANY INVESTMENT OR OTHER DECISION.

4
K e r i n g
E m p o w e r i n g P r e m i u m B r a n d s
Investor Presentation
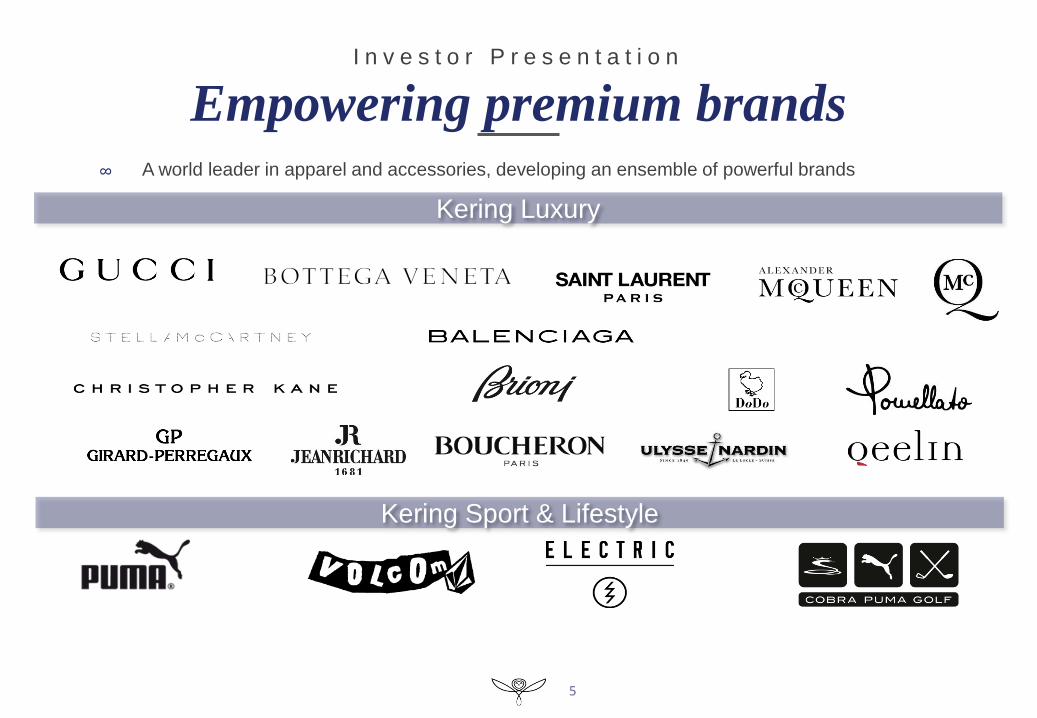
I n v e s t o r P r e s e n t a t i o n
Empowering premium brands ∞ A world leader in apparel and accessories, developing an ensemble of powerful brands
Kering Luxury
Kering Sport & Lifestyle
5

6
Analys is o f 2015 f i rs t -ha l f resu l ts
Investor Presentation

Key highlights
7
2 0 1 5 f i r s t - h a l f r e s u l t s
∞ H1 2015: Solid performances in an environment that remains volatile
– Group revenues up 17% as reported and up 3.5% comparable, with sharp contrasts between quarters
– Positive FX movements boosting reported sales but mixed impact on Group H1 results due to hedging
• Gross profit up 13%, gross profit margin unchanged at constant FX (-200bps reported)
• EBITDA stable at €972m
• Recurring operating income down 5%, at €773m
– Consolidated Net income, Group share, more than doubling
∞ Luxury: A resilient first half with marked rebound in revenue in Q2
– Gucci, Bottega Veneta, YSL and Other brands all posting growth in Q2, driven by mature markets, notably Western Europe
– Robust operating performance: Recurring operating income stable at €806m
– Further significant improvement in Luxury FCF from operations
∞ Sport & Lifestyle: Sustained top-line growth trajectory
– High single-digit growth at Puma in Q2
– Recurring operating income: Impact from ongoing investments in brand-building initiatives at Puma, adverse currency
situation a drag on profits

Operating performances
8
2 0 1 5 f i r s t - h a l f r e s u l t s
-0.6%
-2.6%
+3.7%
+7.7% +8.0% +7.1%
+3.5% +2.8%
+5.3%
Kering Group Luxury Sport & Lifestyle
Q1 2015 Q2 2015 H1 2015
Group H1 Revenue: +17% reported, + 3.5% comparable Group H1 Revenue by quarter (% in comparable growth)
In €m
Revenue
Change (%)
Reported Comparable (*)
Luxury 3,762 +17.8% +2.8%
Sport & Lifestyle 1,731 +15.5% +5.3%
Corporate & others 20 - -
Kering total 5,513 +17.0% +3.5%
In €m
Recurring
Operating Income
H1 2015
Reported change
(%)
Recurring
Operating margin
(%)
Luxury 806 +0.0% 21.4%
Sport & Lifestyle 38 -45.8% 2.2%
Corporate & others (71) +19.9% -
Kering total 773 -5.4% 14.0%
Group H1 Recurring operating income: €773m Group H1 Recurring operating income bridge (in €m)
(*) At constant perimeter and exchanges rates
(**) restated for Sergio Rossi classification under IFRS 5
773
H1 15 Corporate
(12)
S&L
(33)
Other
Brands
(10)
Saint
Laurent
+20
BV
+17
Gucci
(26)
H1 14
817 (**)
Stable Luxury EBIT
In €m H1 15
Reported
change (*)
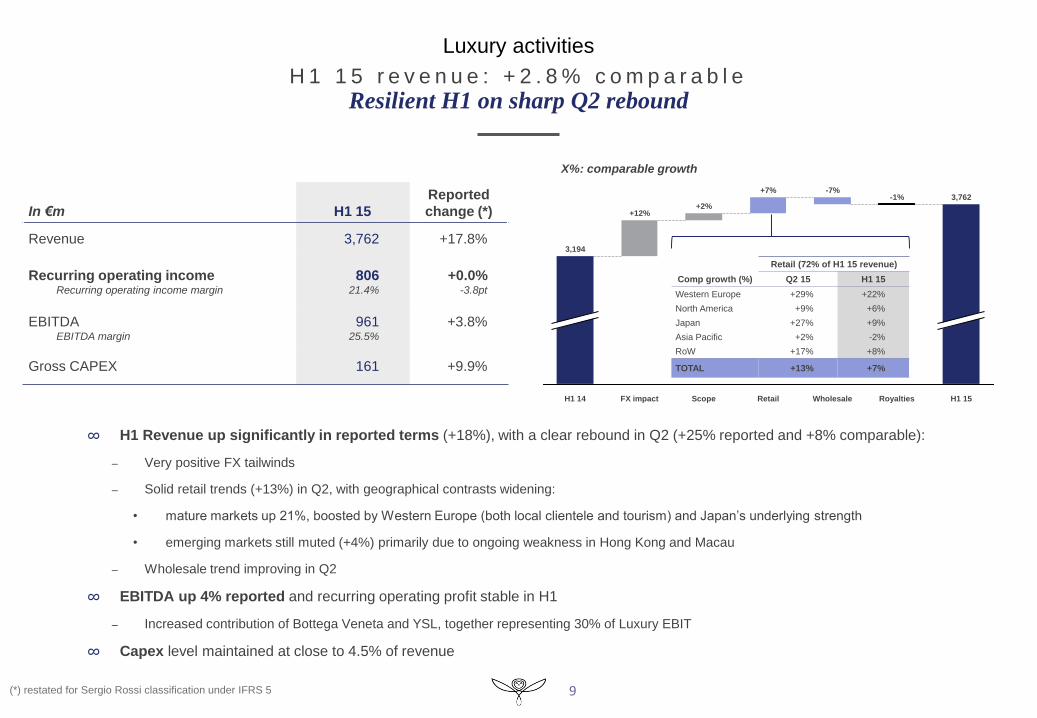
Revenue 3,762 +17.8%
Recurring operating income Recurring operating income margin
806 21.4%
+0.0% -3.8pt
EBITDA EBITDA margin
961 25.5%
+3.8%
Gross CAPEX 161 +9.9%
H 1 1 5 r e v e n u e : + 2 . 8 % c o m p a r a b l e
Resilient H1 on sharp Q2 rebound
∞ H1 Revenue up significantly in reported terms (+18%), with a clear rebound in Q2 (+25% reported and +8% comparable):
– Very positive FX tailwinds
– Solid retail trends (+13%) in Q2, with geographical contrasts widening:
• mature markets up 21%, boosted by Western Europe (both local clientele and tourism) and Japan’s underlying strength
• emerging markets still muted (+4%) primarily due to ongoing weakness in Hong Kong and Macau
– Wholesale trend improving in Q2
∞ EBITDA up 4% reported and recurring operating profit stable in H1
– Increased contribution of Bottega Veneta and YSL, together representing 30% of Luxury EBIT
∞ Capex level maintained at close to 4.5% of revenue
Luxury activities
9
X%: comparable growth
Royalties
3,762
H1 15
-1%
Wholesale
-7%
Retail
+7%
Scope
+2%
FX impact
+12%
H1 14
3,194
Comp growth (%)
Retail (72% of H1 15 revenue)
Q2 15 H1 15
Western Europe
North America
Japan
Asia Pacific
RoW
+29%
+9%
+27%
+2%
+17%
+22%
+6%
+9%
-2%
+8%
TOTAL +13% +7%
Retail (72% of revenue)
% comparable
Western Europe
North America
Japan
Asia Pacific
RoW
+22%
+6%
+9%
-2%
+8%
+13% -4% +2% Of which
Q2 15
Comp growth (%)
Retail (72% of H1 15 revenue)
Q2 15 H1 15
Western Europe
North America
Japan
Asia Pacific
RoW
+29%
+9%
+27%
+2%
+17%
+22%
+6%
+9%
-2%
+8%
TOTAL +13% +7%
(*) restated for Sergio Rossi classification under IFRS 5

10
H 1 1 5 r e v e n u e : - 1 . 6 % c o m p a r a b l e
Renewed brand momentum taking shape
In €m H1 15
Reported
change
Revenue 1,874 +11.8%
Recurring operating income Recurring operating income margin
502 26.8%
-4.9% -4.7pt
EBITDA EBITDA margin
587 31.3%
-1.6%
Gross CAPEX 77 +14.7%
H1 15
1,874
Royalties
-13%
Retail (84% of sales): +3%
Wholesale
-21%
Other
Countries
+10%
Asia Pacific
-4%
Japan
+2%
North
America
+6%
Western
Europe
+13%
H1 14
1,676
X%: comparable growth
∞ Improving revenue trends in second quarter as Gucci deploys new creative vision and executes action plans
– Solid progression in retail across all regions and key categories
– Wholesale streamlining carried on as expected
– Rejuvenation of Gucci brand image, new collections presented in H1 gathering enthusiastic reception
∞ Contained decline in recurring operating income:
– Positive FX impact but anticipated dilution in margin stemming from hedging
– Sustained underlying gross profit margin
∞ Capex up on phasing of investments and FX movements
+20% +11% +19% +3% +20% -19% -11% TOTAL
Q2: +5%
Of which
Q2 15
Q2 15 retail: +10%

Update on action plans and first achievements
11
Timing of
collections
Fir
st
ach
iev
em
en
ts
January / February Men & Women Fashion Show
F/W 15-16
June Cruise 2016
collection
presentation
End of Q3/ Early Q4 Cruise collection
progressively in stores
September Women Fashion
Show S/S 16
June Men Fashion
Show S/S 16
H1 2015 H2 2015
From end of June M&W Fashion Show
F/W 15-16 first
products in stores
Starting from December M&W S/S 16 Fashion Show
progressively in stores
Creation
Products &
Merchandising
Distribution &
Customers
Build a clear message, a more focused and relevant offer for the
customers
Introduce new products, discontinue selected lines
Reduce number of SKUs
Balance price offer range to exploit opportunities, upgrading of GG
Retail merchandising: be closer to market signals
Visual merchandising: a readable message
Store network refreshment
Achieve excellence in delivering retail experience to create uplift
in sales productivity
Seamless one-brand, one-store experience across all touchpoints
Refreshed website

12
H 1 1 5 r e v e n u e : + 6 . 4 % c o m p a r a b l e
Another strong first half, fueled by Western Europe
In €m H1 15
Reported
change
Revenue 629 +19.7%
Recurring operating income Recurring operating income margin
180 28.6%
+10.4% -2.4pt
EBITDA EBITDA margin
199 31.6%
+11.8%
Gross CAPEX 21 +11.3%
X%: comparable growth
Wholesale Royalties
+17%
H1 15
Retail (83% of sales): +7%
629 +2%
Other
Countries
+39%
Asia Pacific
-8%
Japan
+11%
North
America
-1%
Western
Europe
+44%
H1 14
525
∞ Q2 bounce, yielding solid revenue growth in H1
– Back to double-digit retail progression in Q2 (+12%), led by Western Europe and Japan, more than compensating for continued soft
conditions in Asia Pacific
– Great appeal of Leather Goods novelties
– Slight wholesale decline in Q2 vs. very high comps (Q2 14: +47%)
∞ Double-digit increase in Recurring operating income (+10%), consistent with the brand’s mid-term development plan
– Achieved despite adverse impact of hedging and less favorable geographic mix
∞ Ongoing brand building investments; strong FCF generation
+52% -2% +27% -8% +65% -3% +13% TOTAL
Q2: +9%
Of which
Q2 15
Q2 15 retail: +12%

13
H 1 1 5 r e v e n u e : + 2 4 . 3 % c o m p a r a b l e
Sustained growth across the board
In €m H1 15
Reported
change
Revenue 443 +38.2%
Recurring operating income Recurring operating income margin
61 13.7%
+47.9% +1.0pt
EBITDA EBITDA margin
80 18.0%
+52.2%
Gross CAPEX 28 +19.8%
X%: comparable growth
+22%
Other
Countries
H1 15 Royalties
Retail (64% of sales): +26%
443
Wholesale
+22% -12%
Asia Pacific
+15%
Japan
+45%
North
America
+32%
Western
Europe
+38%
H1 14
321
∞ Revenue growth accelerating in Q2, consistent across all distribution channels
– Retail channel consistently powering on quarter after quarter
– Solid increase in wholesale, in line with long-term strategy
– All categories contributing to revenue growth in H1: Leather goods up 23%, Women’s RTW up 30%, Men’s RTW up 23%, Shoes up
16%
∞ Recurring operating income up nearly 50%, with further 100 bp expansion in margin
– Operating leverage allowing to fully absorb hedging impact
∞ Continued investment in brand expansion
+45% +26% +82% +15% -14% +24% +24% TOTAL
Q2: +27%
Of which
Q2 15
Q2 15 retail: +29%
Other Luxury brands
14
H 1 1 5 r e v e n u e : + 1 . 0 % c o m p a r a b l e
Good operating performances in Soft Luxury, but tough first half in Watches
In €m H1 15
Reported
change (*)
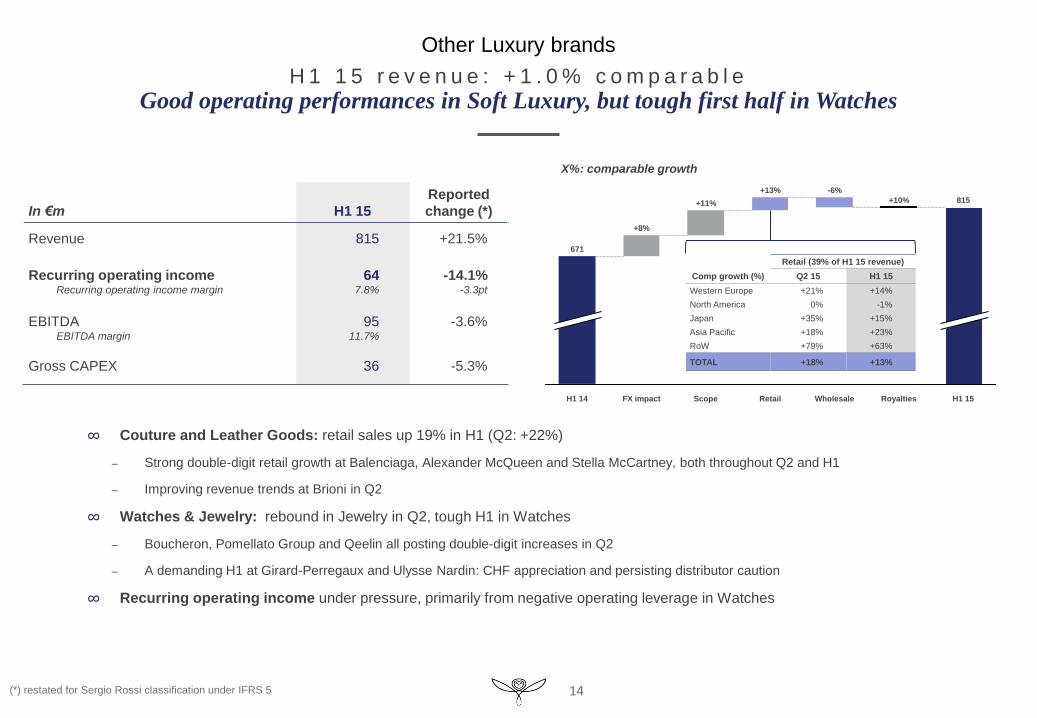
Revenue 815 +21.5%
Recurring operating income Recurring operating income margin
64 7.8%
-14.1% -3.3pt
EBITDA EBITDA margin
95 11.7%
-3.6%
Gross CAPEX 36 -5.3%
X%: comparable growth
∞ Couture and Leather Goods: retail sales up 19% in H1 (Q2: +22%)
– Strong double-digit retail growth at Balenciaga, Alexander McQueen and Stella McCartney, both throughout Q2 and H1
– Improving revenue trends at Brioni in Q2
∞ Watches & Jewelry: rebound in Jewelry in Q2, tough H1 in Watches
– Boucheron, Pomellato Group and Qeelin all posting double-digit increases in Q2
– A demanding H1 at Girard-Perregaux and Ulysse Nardin: CHF appreciation and persisting distributor caution
∞ Recurring operating income under pressure, primarily from negative operating leverage in Watches
815
H1 15 Royalties
+10%
Wholesale
-6%
Retail
+13%
Scope
+11%
FX impact
+8%
H1 14
671
Retail (39% of revenue)
% comparable
Western Europe
North America
Japan
Asia Pacific
RoW
+14%
-1%
+15%
+23%
+63%
Retail (72% of H1 15 revenue)
% comparable
Q2 15
% comparable
H1 15
Western Europe
North America
Japan
Asia Pacific
RoW
+21%
0%
+35%
+18%
+79%
+14%
-1%
+15%
+23%
+63%
Comp growth (%)
Retail (39% of H1 15 revenue)
Q2 15 H1 15
Western Europe
North America
Japan
Asia Pacific
RoW
+21%
0%
+35%
+18%
+79%
+14%
-1%
+15%
+23%
+63%
TOTAL +18% +13%
Comp growth (%)
Retail (39% of H1 15 revenue)
Q2 15 H1 15
Western Europe
North America
Japan
Asia Pacific
RoW
+21%
0%
+35%
+18%
+79%
+14%
-1%
+15%
+23%
+63%
TOTAL +18% +13%
(*) restated for Sergio Rossi classification under IFRS 5

Sport & Lifestyle
15
Puma €1,474m
Puma €1,386m
H 1 1 5 r e v e n u e : + 5 . 3 % c o m p a r a b l e
Sustained growth trajectory
In €m H1 15
Reported
change
Revenue 1,731 +15.5%
Recurring operating income Recurring operating income margin
o/w Puma
o/w Other Brands
38 2.2%
41
(3)
-45.8% -2.5pt
EBITDA EBITDA margin
70 4.0%
-27.6%
Gross CAPEX 45 +8.7%
1,499
1,731
RoW H1 15
+11%
Asia Pacific
+13%
Japan
+1%
North America
+4%
Western Europe
+0%
H1 14
X%: comparable growth
∞ Puma: convincing revenue performance in first half
– Revenue acceleration further confirmed in Q2, up 8% comparable, driven by Footwear (+16%) thanks to new product introductions
– All regions contributing to H1 performance (+6% comparable), with North America and Western Europe gaining traction in Q2
– Sustained Gross Margin in constant currency; Recurring operating income reflecting ongoing investment in brand building along with
currency headwinds
∞ Volcom and Electric:
– Trends improving in Q2 (+3% comparable), driven by strong e-commerce
% change
% comparable % reported
Puma
Other brands
+5.9%
-1.4%
+15.5%
+15.3%
+4% +8% +2% +8% +12% Of which
Q2 15 TOTAL
Q2: +7%
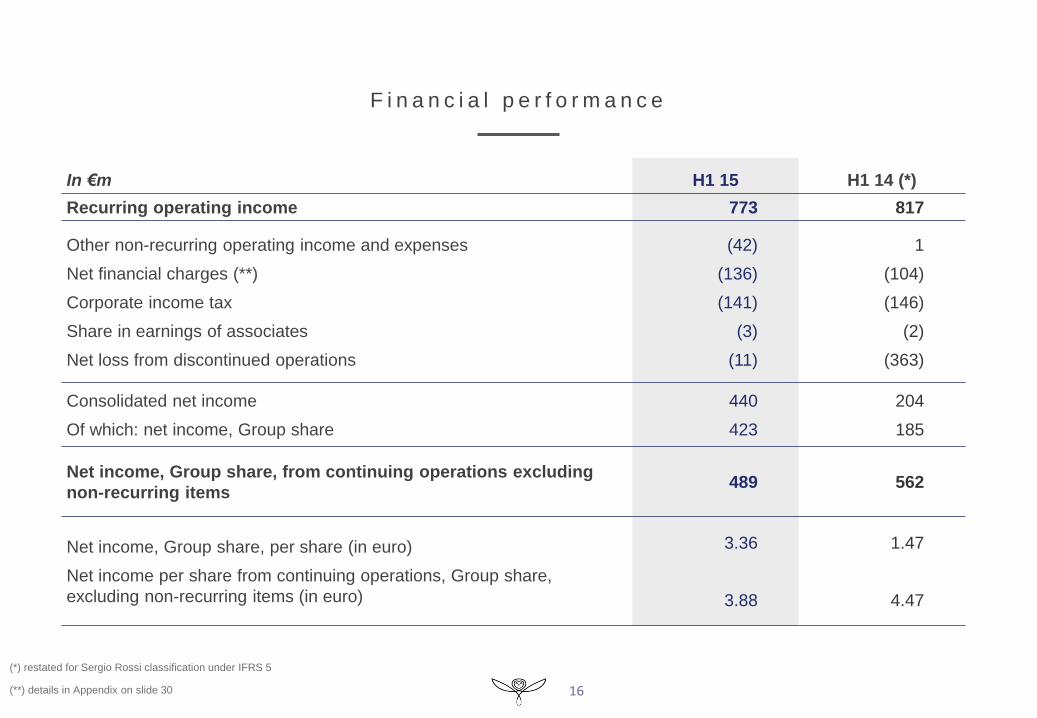
F i n a n c i a l p e r f o r m a n c e
In €m H1 15 H1 14 (*)
Recurring operating income 773 817
Other non-recurring operating income and expenses
Net financial charges (**)
Corporate income tax
Share in earnings of associates
Net loss from discontinued operations
(42)
(136)
(141)
(3)
(11)
1
(104)
(146)
(2)
(363)
Consolidated net income
Of which: net income, Group share
440
423
204
185
Net income, Group share, from continuing operations excluding
non-recurring items 489 562
Net income, Group share, per share (in euro)
Net income per share from continuing operations, Group share,
excluding non-recurring items (in euro)
3.36
3.88
1.47
4.47
16 (**) details in Appendix on slide 30
(*) restated for Sergio Rossi classification under IFRS 5

F r e e c a s h f l o w f r o m o p e r a t i o n s
17
58
299
160
309
635
Free cash flow
from operations
H1 15
Safilo early
termination
payment
-30
H1 15 hedge
impact
-211
FCF H1 15 before
hedge impact &
other changes
Other operations
and corporate
FCF change
-90
SLS FCF change
-80
Luxury FCF
change
FCF H1 14 excl.
real estate
disposal
H1 14 non-
recurring cash
inflow (real
estate disposal)
-326
Free cash flow
from operations
H1 14
H1 15 Free cash flow bridge (change in €m)

C h a n g e i n n e t f i n a n c i a l d e b t
18
209
8581
537
92
5,337
Dividends paid Net debt at
June 30, 2015
Other movements
(translation FX-
denominated debt)
Financing related
to discontinued
activities
5,043
Purchases of
Kering shares
and financial
investments
Net interest paid
and dividend
received
Free cash flow
from operations
-58
Net debt at
December
31, 2014
4,391
H1 15 net financial debt bridge (in €m)

19
Conclus ion and Out look
Investor Presentation

20
2 0 1 5 f i r s t - h a l f r e s u l t s
Conclusion & Outlook
∞ Commendable performance in H1 2015
– Sharp Q2 top-line rebound; solid operating profitability in Luxury
∞ Gucci on track to deploy new creative vision and execute action plans
– New dynamic and promising developments – Contemporary vision expressed across all customer touch points and enthusiastic reception from
industry and customers
– Active H2 schedule to anchor brand rejuvenation
∞ Additional milestones on steady profitable growth trajectory
– Kering Eyewear
– Digital platform
– Operating cost review
∞ Reiterated confidence in multi-brand strategy and prospects

21
Pr inc ip les for Susta inable Invest ing and
Corporate Governance overv iew
Investor Presentation

F r a n ç o i s - H e n r i P i n a u l t
Foreword
22

G o v e r n a n c e
Operation of the Board of Directors
5 Committees
Audit committee
– Jean-Pierre DENIS (Chairman)*
– Patricia BARBIZET
– Yseulys COSTES*
Board of Directors
Remuneration committee
- Philippe LAGAYETTE (Chairman)*
- Patricia BARBIZET
- Laurence BOONE*
- Yseulys COSTES*
- Jean-Pierre DENIS*
Nomination Committee
– Patricia BARBIZET (Chairwoman)
– Luca CORDERO DI MONTEZEMOLO*
– Baudouin PROT
Sustainability committee
– Jochen ZEITZ ( Chairman )
– Patricia BARBIZET
– Luca CORDERO DI MONTEZEMOLO*
– Jean-François PALUS
– François-Henri PINAULT
Strategy and development committee – Patricia BARBIZET (Chairwoman)
– Yseulys COSTES*
– Philippe LAGAYETTE*
– François-Henri PINAULT
* Independent director
11 Directors
5 Independent
4 Women
23
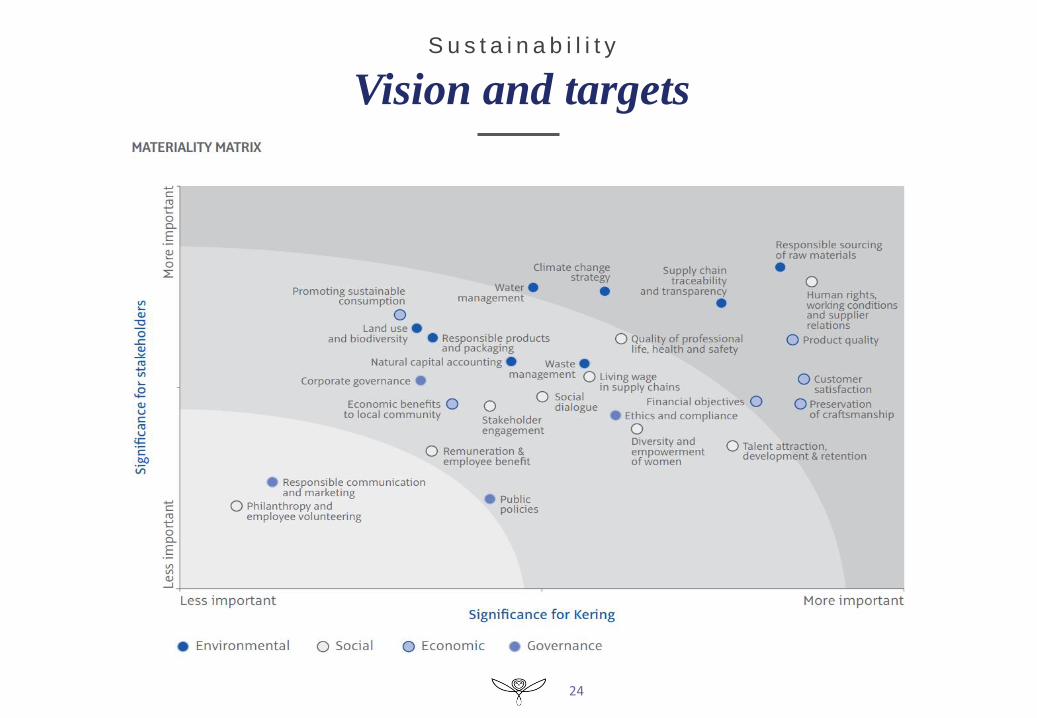
S u s t a i n a b i l i t y
Vision and targets
24
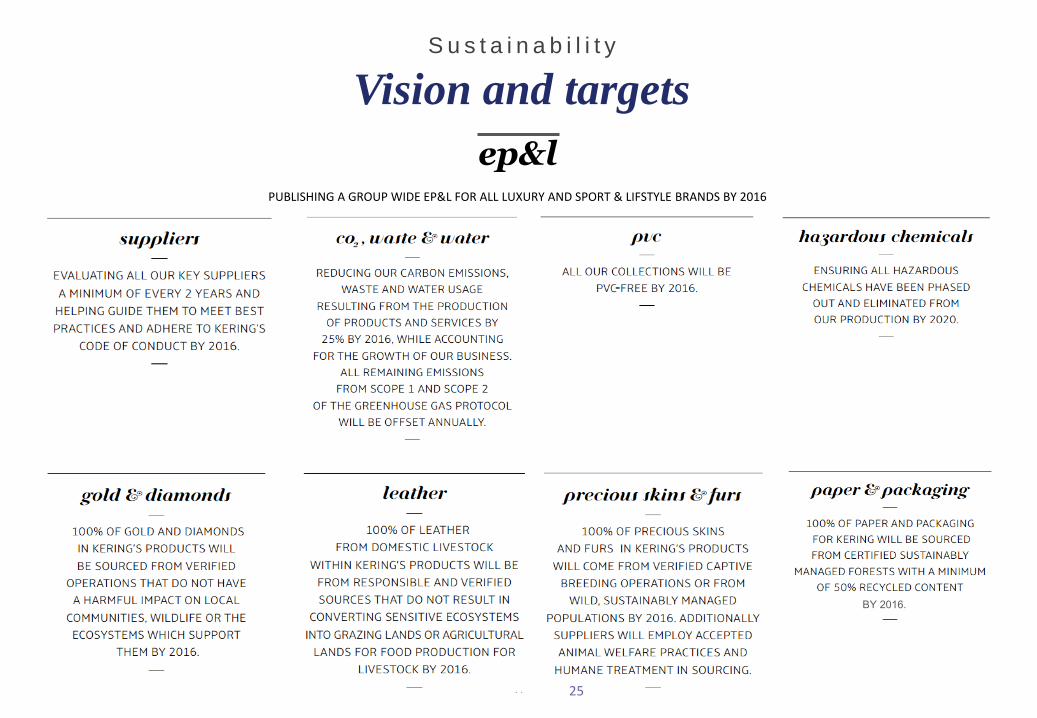
S u s t a i n a b i l i t y
Vision and targets
ep&l
PUBLISHING A GROUP WIDE EP&L FOR ALL LUXURY AND SPORT & LIFSTYLE BRANDS BY 2016
BY 2016.
25

S u s t a i n a b i l i t y
Targets: progress to date
26

S u s t a i n a b i l i t y
Environmental Profit & Loss account
€
27

28
KERING ENVIRONMENTAL PROFIT & LOSS
Group
EP&L
results
D I S C O V E R
M O R E
www.kering.com/en/sustai
nability/epl

29
Appendices
2015 first-half results

H 1 1 5 o p e r a t i n g p e r f o r m a n c e s
R e p o r t e d f i g u r e s
30
In €m
CONTINUING OPERATIONS
H1 15 H1 14 (*) Change
Revenue 5,513 4,710 +17.0%
Gross profit
Gross profit margin
3,399
61.7%
3,002
63.7%
+13.2%
Recurring operating income
Recurring operating income margin
773
14.0%
817
17.4%
-5.4%
EBITDA
EBITDA margin
972
17.6%
972
20.6%
-
(*) restated for Sergio Rossi classification under IFRS 5

H 1 1 5 r e v e n u e
Change
In €m, continuing operations H1 15 H1 14 (*) €m %
Gucci
Bottega Veneta
Saint Laurent
Other brands
1,874.2
629.2
443.1
815.5
1,676.3
525.5
320.6
671.2
197.9
103.7
122.5
144.3
+11.8%
+19.7%
+38.2%
+21.5%
Luxury 3,762.0 3,193.6 568.4 +17.8%
Puma
Other brands
1,601.2
129.8
1,386.1
112.6
215.1
17.2
+15.5%
+15.3%
Sport & Lifestyle 1,731.0 1,498.7 232.3 +15.5%
Corporate & Others 19.5 18.1 1.4 +7.7%
Kering 5,512.5 4,710.4 802.1 +17.0%
31 (*) restated for Sergio Rossi classification under IFRS 5
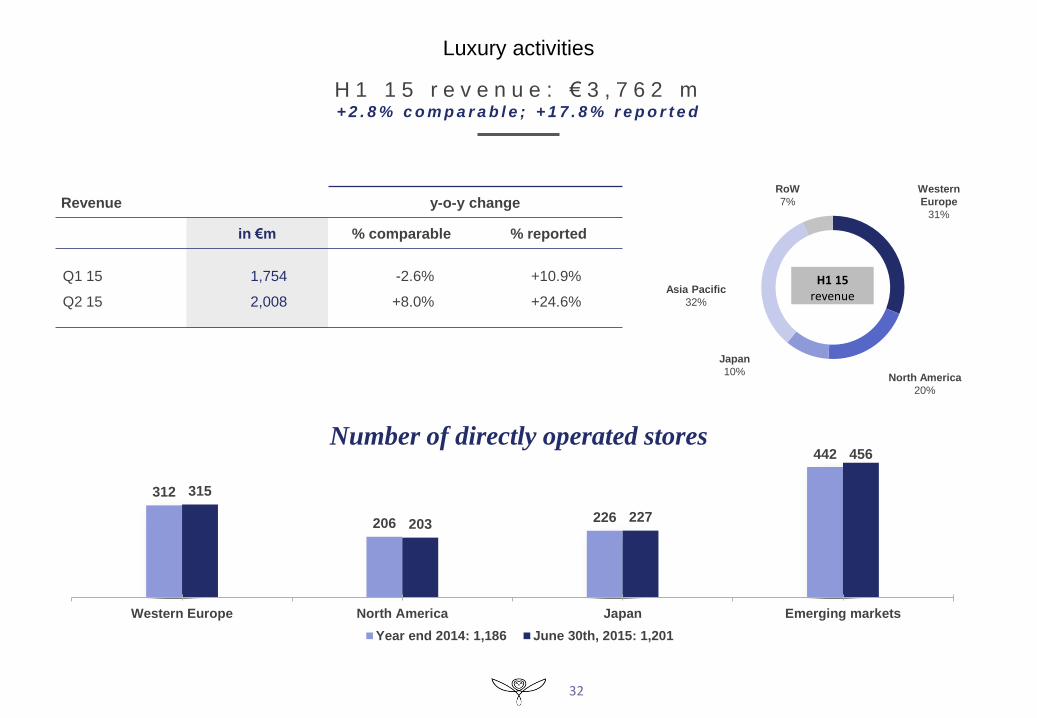
H 1 1 5 r e v e n u e : € 3 , 7 6 2 m + 2 . 8 % c o m p a r a b l e ; + 1 7 . 8 % r e p o r t e d
Western
Europe
31%
North America
20%
Japan
10%
Asia Pacific
32%
RoW
7%
Number of directly operated stores
312
206 226
442
315
203 227
456
Western Europe North America Japan Emerging markets
Year end 2014: 1,186 June 30th, 2015: 1,201
32
Luxury activities
Revenue y-o-y change
in €m % comparable % reported
Q1 15
Q2 15
1,754
2,008
-2.6%
+8.0%
+10.9%
+24.6%
H1 15 revenue
+14% € 838m
Western
Europe
24%
North America
21%
Japan
10%
Asia Pacific
38%
RoW
7%
Number of directly operated stores
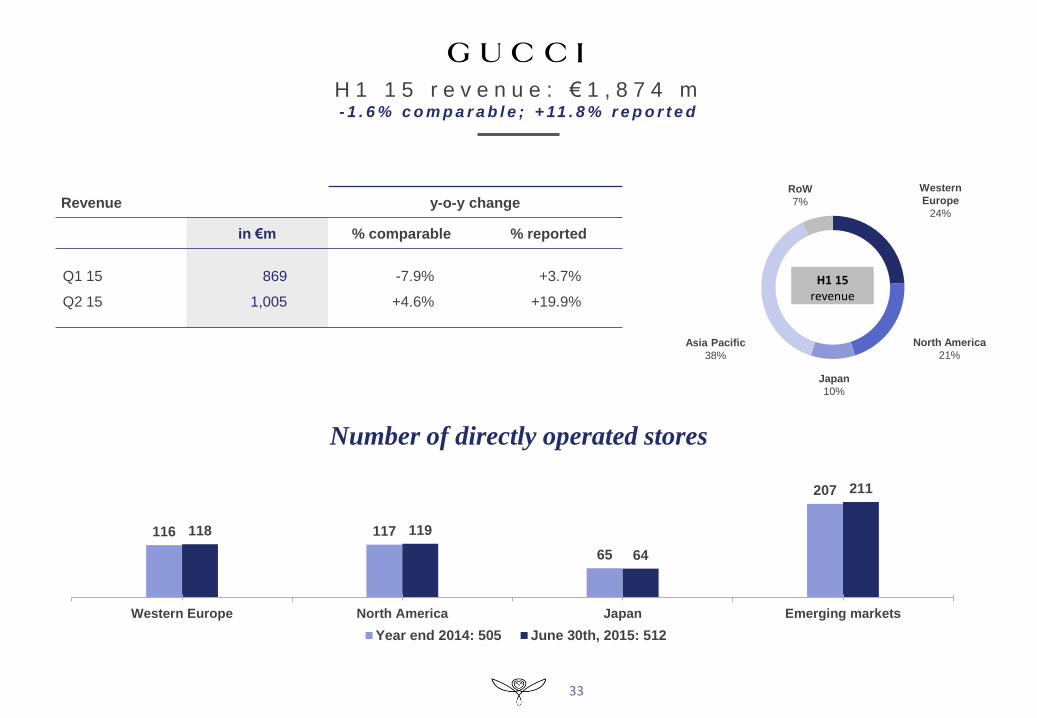
33
116 117
65
207
118 119
64
211
Western Europe North America Japan Emerging markets
Year end 2014: 505 June 30th, 2015: 512
H 1 1 5 r e v e n u e : € 1 , 8 7 4 m - 1 . 6 % c o m p a r a b l e ; + 11 . 8 % r e p o r t e d
Revenue y-o-y change
in €m % comparable % reported
Q1 15
Q2 15
869
1,005
-7.9%
+4.6%
+3.7%
+19.9%
H1 15 revenue

Western
Europe
29%
North America
13%
Japan
15%
Asia Pacific
40%
RoW
3%
Number of directly operated stores
34
52
29
58
97
53
28
59
100
Western Europe North America Japan Emerging markets
Year end 2014: 236 June 30th, 2015: 240
H 1 1 5 r e v e n u e : € 6 2 9 m + 6 . 4 % c o m p a r a b l e ; + 1 9 . 7 % r e p o r t e d
Revenue y-o-y change
in €m % comparable % reported
Q1 15
Q2 15
290
339
+3.1%
+9.3%
+15.6%
+23.5%
H1 15 revenue

Western
Europe
39%
North America
24%
Japan
7%
Asia Pacific
23%
RoW
7%
Number of directly operated stores
35
33
22 21
52
33
21 22
56
Western Europe North America Japan Emerging markets
Year end 2014: 128 June 30th, 2015: 132
H 1 1 5 r e v e n u e : € 4 4 3 m + 2 4 . 3 % c o m p a r a b l e ; + 3 8 . 2 % r e p o r t e d
Revenue y-o-y change
in €m % comparable % reported
Q1 15
Q2 15
211
232
+21.2%
+27.3%
+33.8%
+42.5%
H1 15 revenue
Other Luxury brands
Western
Europe
45%
North America
20%
Japan
8%
Asia Pacific
17%
RoW
10%
Number of directly operated stores
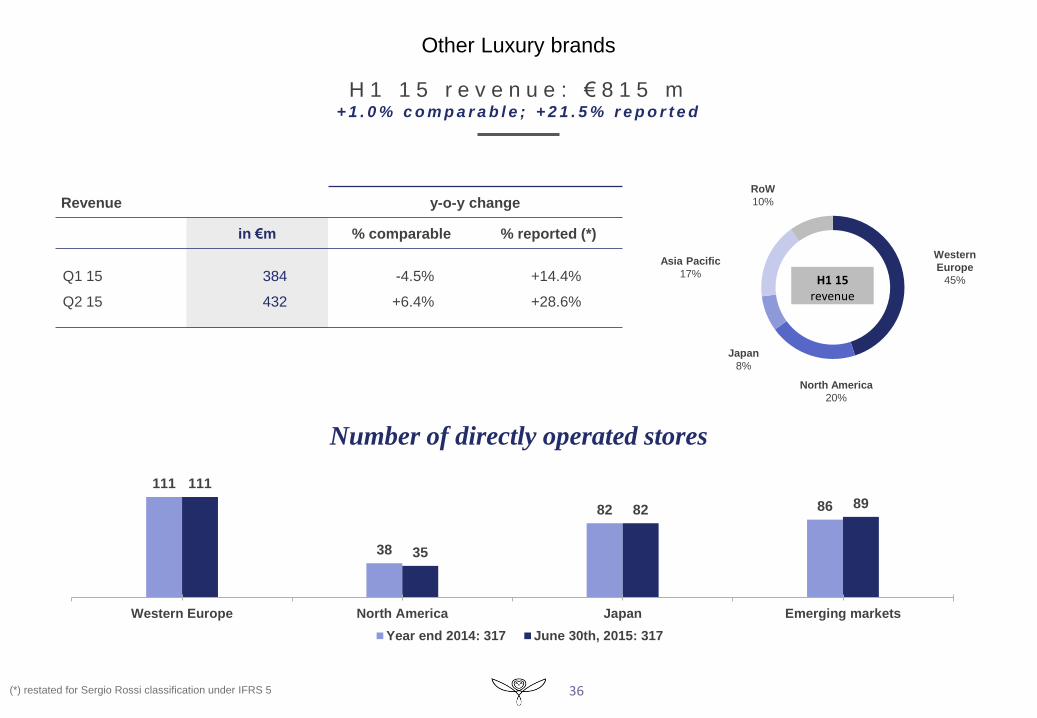
36
111
38
82 86
111
35
82 89
Western Europe North America Japan Emerging markets
Year end 2014: 317 June 30th, 2015: 317
H 1 1 5 r e v e n u e : € 8 1 5 m + 1 . 0 % c o m p a r a b l e ; + 2 1 . 5 % r e p o r t e d
Revenue y-o-y change
in €m % comparable % reported (*)
Q1 15
Q2 15
384
432
-4.5%
+6.4%
+14.4%
+28.6%
H1 15 revenue
(*) restated for Sergio Rossi classification under IFRS 5

Western
Europe
28%
North America
29%
Japan
7%
Asia Pacific
15%
RoW
21%
37
Revenue y-o-y change
in €m % comparable % reported
Q1 15
Q2 15
890
841
+3.7%
+7.1%
+12.7%
+18.6%
Sport & Lifestyle
H 1 1 5 r e v e n u e : € 1 , 7 3 1 m + 5 . 3 % c o m p a r a b l e ; + 1 5 . 5 % r e p o r t e d
H1 15 revenue

H 1 1 5 r e c u r r i n g o p e r a t i n g i n c o m e
Change
In €m, continuing operations H1 15 H1 14 (*) €m %
Gucci
Bottega Veneta
Saint Laurent
Other brands
501.6
180.1
60.5
63.8
527.6
163.1
40.9
74.3
(26.0)
17.0
19.6
(10.5)
-4.9%
+10.4%
+47.9%
-14.1%
Luxury 806.0 805.9 0.1 +0.0%
Puma
Other brands
40.7
(2.3)
70.8
0.1
(30.1)
(2.4)
-42.5%
-
Sport & Lifestyle 38.4 70.9 (32.5) -45.8%
Corporate & Others (71.2) (59.4) (11.8) -19.9%
Kering 773.2 817.4 (44.2) -5.4%
38 (*) restated for Sergio Rossi classification under IFRS 5
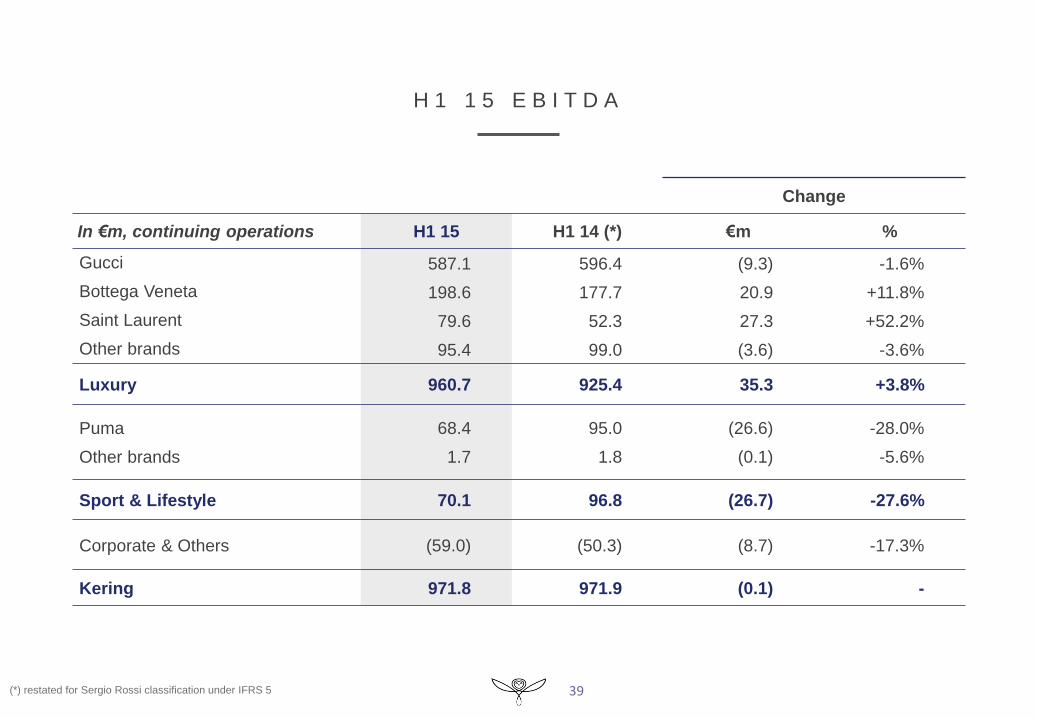
Change
In €m, continuing operations H1 15 H1 14 (*) €m %
Gucci
Bottega Veneta
Saint Laurent
Other brands
587.1
198.6
79.6
95.4
596.4
177.7
52.3
99.0
(9.3)
20.9
27.3
(3.6)
-1.6%
+11.8%
+52.2%
-3.6%
Luxury 960.7 925.4 35.3 +3.8%
Puma
Other brands
68.4
1.7
95.0
1.8
(26.6)
(0.1)
-28.0%
-5.6%
Sport & Lifestyle 70.1 96.8 (26.7) -27.6%
Corporate & Others (59.0) (50.3) (8.7) -17.3%
Kering 971.8 971.9 (0.1) -
39
H 1 1 5 E B I T D A
(*) restated for Sergio Rossi classification under IFRS 5

H 1 1 5 n e t f i n a n c i a l c o s t s
a n d i n c o m e t a x
In €m H1 15 H1 14 (*)
Cost of net debt
Other financial income and expenses
(64.2)
(72.0)
(86.0)
(18.3)
Financial costs (net) (136.2) (104.3)
In €m H1 15 H1 14 (*)
Tax on recurring income
Tax on non-recurring items
(126.3)
(15.1)
(129.9)
(16.1)
Total tax charge (141.4) (146.0)
Effective tax rate 23.8% 20.4%
Recurring tax rate 19.8% 18.2%
40 (*) restated for Sergio Rossi classification under IFRS 5

H 1 1 5 F r e e c a s h f l o w f r o m o p e r a t i o n s
In €m H1 15 H1 14 (*)
Cash flow before taxes, dividends and interest
Change in working capital requirement (excluding taxes)
Corporate income tax paid
895
(428)
(148)
944
(261)
(175)
Net cash flow from operating activities 319 508
Acquisition of fixed operating assets
Sale of fixed operating assets
(303)
42
(214)
341
Free cash flow from operations 58 635
41 (*) restated for Sergio Rossi classification under IFRS 5

H 1 1 5 c o n d e n s e d c o n s o l i d a t e d b a l a n c e s h e e t
In €m H1 15 H1 14 (*)
Goodwill, brands & other intangible assets – Net
Other net non-current assets
Net current assets
Provisions
15 100
503
1 555
(365)
14 361
4
1 039
(391)
CAPITAL EMPLOYED 16 793 15 013
Net assets held for sale 28 (66)
SHAREHOLDERS’ EQUITY 11 483 11 042
NET DEBT 5 337 3 905
42 (*) restated for Sergio Rossi classification under IFRS 5
