presentation slides in pdf - barclays
TRANSCRIPT

Barclays PLC Q3 2012 Interim Management Statement
31 October 2012

Antony Jenkins Group Chief Executive

Chris Lucas Group Finance Director

Adjusted financial highlights
Nine months ended – September 2012 (£m)
2011 (£m)
Change (%)
Income 22,347 22,300 -
Impairment charges (2,657) (2,851) (7)
Net operating income 19,690 19,449 1
Operating expenses (13,832) (14,441) (4)
Adjusted profit before tax* 5,954 5,062 18
Statutory profit before tax 712 5,066 (86)
* Comprises share of post-tax results of associates and joint ventures; profit or loss on disposal of subsidiaries, associates and joint ventures; and gains on acquisitions
4 | Barclays Q3 2012 Interim Management Statement | 31 October 2012

Adjusted items to PBT
Nine months ended – September 2012 (£m)
2011 (£m)
Change (%)
Profit before tax 712 5,066 (86)
Own credit charge/(gain) 4,019 (2,971)
Provision for PPI redress 1,000 1,000
Provision for interest rate hedging products redress
450 -
(Gain)/loss on sale of BlackRock investment
(227) 1,858
Goodwill impairment - 47
Losses on acquisitions and disposals - 62
Adjusted profit before tax 5,954 5,062 18
5 | Barclays Q3 2012 Interim Management Statement | 31 October 2012

Adjusted performance measures
Nine months ended – September 2012 (£m)
2011 (£m)
Return on average shareholders’ equity 8.8% 8.4%
Return on average tangible shareholders’ equity 10.3% 10.1%
Return on average risk weighted assets 1.4% 1.3%
Cost: income ratio 62% 65%
6 | Barclays Q3 2012 Interim Management Statement | 31 October 2012

UK Retail and Business Banking
Nine months ended – September 2012 (£m)
2011 (£m)
Change (%)
Income 3,335 3,527 (5)
Impairment charges (198) (380) (48)
Net operating income 3,137 3,147 -
Operating expenses (excludes provision for PPI redress) (1,991) (1,950) 2
Adjusted profit before tax 1,146 1,198 (4)
Adjusted return on average equity 16.9% 16.7%
Adjusted cost: income ratio 60% 55%
* Comprises share of post-tax results of associates and joint ventures; profit or loss on disposal of subsidiaries, associates and joint ventures; and gains on acquisitions
7 | Barclays Q3 2012 Interim Management Statement | 31 October 2012

Europe Retail and Business Banking
Nine months ended – September 2012 (£m)
2011 (£m)
Change (%)
Income 705 979 (28)
Impairment charges (233) (178) (31)
Net operating income 472 801 (41)
Operating expenses (632) (920) (31)
Loss before tax* (151) (109) 39
Return on average equity (7.6%) (3.9%)
Cost: income ratio 90% 94%
* Comprises share of post-tax results of associates and joint ventures; profit or loss on disposal of subsidiaries, associates and joint ventures; and gains on acquisitions
8 | Barclays Q3 2012 Interim Management Statement | 31 October 2012

Africa Retail and Business Banking
Nine months ended – September 2012 (£m)
2011 (£m)
Change (%)
Income 2,390 2,710 (12)
Impairment charges (501) (378) 33
Net operating income 1,889 2,332 (19)
Operating expenses (1,564) (1,774) (12)
Profit before tax* 330 561 (41)
Adjusted return on average equity 4.9% 9.6%
Cost: income ratio 65% 65%
* Comprises share of post-tax results of associates and joint ventures; profit or loss on disposal of subsidiaries, associates and joint ventures; and gains on acquisitions
9 | Barclays Q3 2012 Interim Management Statement | 31 October 2012

Barclaycard
Nine months ended – September 2012 (£m)
2011 (£m)
Change (%)
Income 3,072 3,112 (1)
Impairment charges (714) (988) (28)
Net operating income 2,358 2,124 11
Operating expenses (excludes provision for PPI redress and goodwill impairment) (1,232) (1,201) 3
Adjusted profit before tax* 1,150 949 21
Adjusted return on average equity 22.7% 18.4%
Adjusted cost: income ratio 40% 39%
* Comprises share of post-tax results of associates and joint ventures; profit or loss on disposal of subsidiaries, associates and joint ventures; and gains on acquisitions
10 | Barclays Q3 2012 Interim Management Statement | 31 October 2012
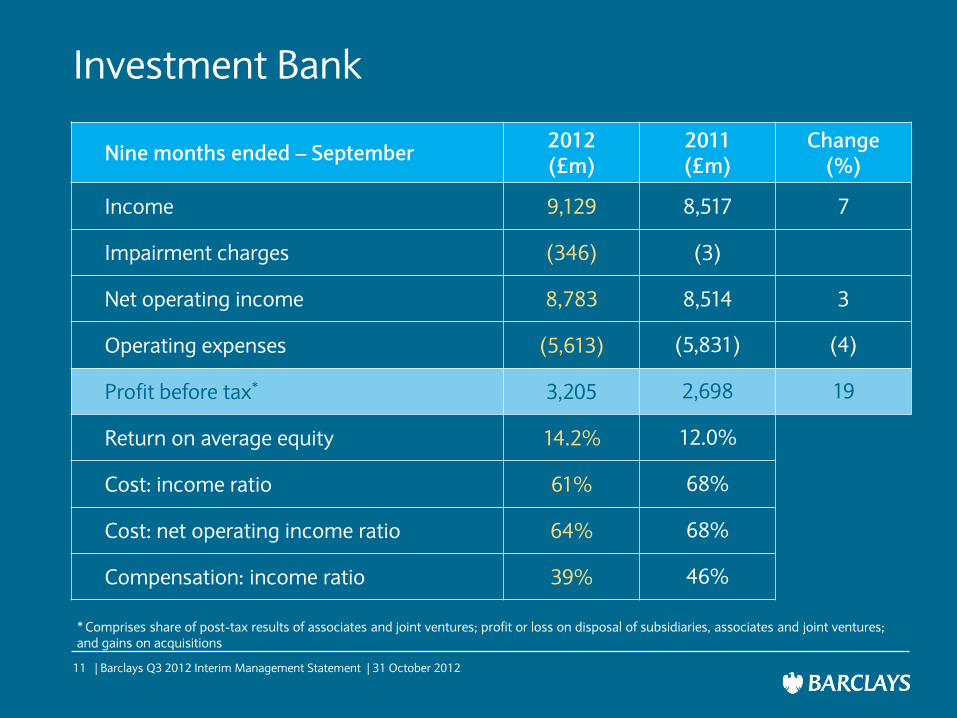
Investment Bank
Nine months ended – September 2012 (£m)
2011 (£m)
Change (%)
Income 9,129 8,517 7
Impairment charges (346) (3)
Net operating income 8,783 8,514 3
Operating expenses (5,613) (5,831) (4)
Profit before tax* 3,205 2,698 19
Return on average equity 14.2% 12.0%
Cost: income ratio 61% 68%
Cost: net operating income ratio 64% 68%
Compensation: income ratio 39% 46%
* Comprises share of post-tax results of associates and joint ventures; profit or loss on disposal of subsidiaries, associates and joint ventures; and gains on acquisitions
11 | Barclays Q3 2012 Interim Management Statement | 31 October 2012

2,897
1,715
563 520
2,254
1,438
338 389
1,818
971
305
506
3,464
2,396
550 509
3,032
1,968
423 501
2,633
1,581
534 487
Total income FICC Equities and Prime
Services
Investment Banking
£m Q3 2011
Q4 2011
Q1 2012
Q2 2012
Total income
• Q3 2012 vs Q3 2011 up 17%
• Q3 2012 vs Q2 2012 down 13%
Q2 2011
Q3 2012
Investment Bank quarterly income
12 | Barclays Q3 2012 Interim Management Statement | 31 October 2012

Corporate Banking
Nine months ended – September 2012 (£m)
2011 (£m)
Change (%)
Income 2,205 2,398 (8)
Impairment charges (635) (895) (29)
Net operating income 1,570 1,503 4
Operating expenses (excludes provision for interest rate hedging products redress) (1,130) (1,337) (15)
Adjusted profit before tax* 444 167 166
Adjusted profit /(loss) before tax by geographic segment
UK 681 592 15
Europe (290) (434) (33)
Rest of the World 53 9
* Comprises share of post-tax results of associates and joint ventures; profit or loss on disposal of subsidiaries, associates and joint ventures; and gains on acquisitions
13 | Barclays Q3 2012 Interim Management Statement | 31 October 2012

Wealth and Investment Management
Nine months ended – September 2012 (£m)
2011 (£m)
Change (%)
Income 1,334 1,295 3
Impairment charges (25) (31) (19)
Net operating income 1,309 1,264 4
Operating expenses (1,109) (1,109) -
Profit before tax* 200 153 31
Return on average equity 11.2% 10.7%
Cost: income ratio 83% 86%
* Comprises share of post-tax results of associates and joint ventures; profit or loss on disposal of subsidiaries, associates and joint ventures; and gains on acquisitions
14 | Barclays Q3 2012 Interim Management Statement | 31 October 2012

Solid capital, liquidity and funding
As at 30 Sep 2012 30 Jun 2012
Core Tier 1 ratio 11.2% 10.9%
Risk weighted assets £379bn £390bn
Adjusted gross leverage 20x 20x
Adjusted gross leverage excluding the liquidity pool
17x 17x
Group liquidity pool £160bn £170bn
Nine months ended 30 September 2012
Term issuance completed £22bn
15 | Barclays Q3 2012 Interim Management Statement | 31 October 2012

Pro forma Core Tier 1 ratios
* For details and basis of calculation, see slides 28 and 29
%
11.2 10.9
30 Sep 12 (Basel 2.5) 31 Dec 12 (Basel 2.5)
Reported CT1 ratio
9.1
10.4
8.2
9.5
01 Jan 13 (Basel 3) 31 Dec 13 (Basel 3)
Pro forma reported CT1 ratio* Fully loaded Basel 3 CT1 ratio*
16 | Barclays Q3 2012 Interim Management Statement | 31 October 2012

Adjusted cost: income ratio improved to 62%
12,257 11,837
2,184 1,995
Q3 YTD 2011 Q3 YTD 2012 Q3 YTD 2011 Q3 YTD 2012
14,441 13,832
22,300
Total income Costs
Performance costs
Non-performance costs
22,347
(3%)
(9%)
(4%)
£m
17 | Barclays Q3 2012 Interim Management Statement | 31 October 2012
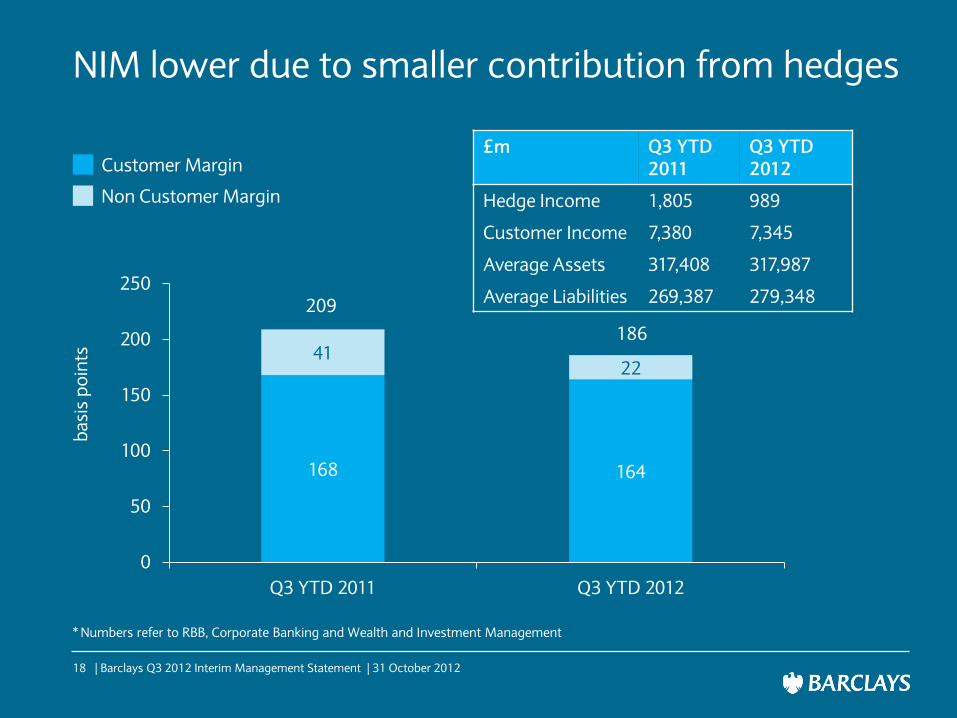
NIM lower due to smaller contribution from hedges
168 164
41 22
0
50
100
150
200
250
Q3 YTD 2011 Q3 YTD 2012
209
186
£m Q3 YTD 2011
Q3 YTD 2012
Hedge Income 1,805 989
Customer Income 7,380 7,345
Average Assets 317,408 317,987
Average Liabilities 269,387 279,348
ba
sis
po
ints
* Numbers refer to RBB, Corporate Banking and Wealth and Investment Management
Customer Margin
Non Customer Margin
18 | Barclays Q3 2012 Interim Management Statement | 31 October 2012

Reduced exposure to the Eurozone periphery
• Over the quarter net funding mismatches in Spain reduced from £2.5bn to £0.1bn and from £3.7bn to £3.3bn in Portugal
• Peripheral sovereign exposures* down 15% to £4.8bn
• Corporate assets in Spain, Italy and Portugal down 19% to £8.2bn
• Retail lending in Spain, Italy and Portugal down 3% to under £38.5bn
• Peripheral financial institutions exposure of £7.0bn
─ £68m of reported Irish exposures to Irish banks; remainder focussed on financial institutions with investment grade credit ratings and/or based in Dublin with main business outside Ireland
* Peripheral sovereign exposure encompasses Spain, Italy, Portugal, Ireland, Greece and Cyprus
19 | Barclays Q3 2012 Interim Management Statement | 31 October 2012

Summary
Adjusted profit before tax up 18%
Income stable with operating expenses down 4% on an adjusted basis
Capital, liquidity and funding remain strong
Reduced exposures to Eurozone periphery countries
20 | Barclays Q3 2012 Interim Management Statement | 31 October 2012

Appendix Q3 2012 Interim Management Statement
21 | Barclays Q3 2012 Interim Management Statement | 31 October 2012

11.2%
5.6%
14.2%
22.7%
4.9%
16.9%
8.8%
Q3 YTD 2011 RoE Q3 YTD 2012 RoE
10.7%
2.1%
12.0%
18.4%
9.6%
(3.9%)
16.7%
8.4%
UK RBB
Europe RBB
Africa RBB
Barclaycard
Investment Bank
Corporate Banking
Wealth and Investment Mgmt
Adjusted return on equity (RoE) increased to 8.8%
Group
(7.6%)
22 | Barclays Q3 2012 Interim Management Statement | 31 October 2012

Analysis of net interest margin
As at 30 September 2012 UK RBB Europe
RBB Africa RBB Barclaycard
Corporate Banking
Wealth and IM
Total RBB, Corporate
and Wealth
RBB, Corporate
and Wealth interest income
Customer asset margin (%) 1.09 0.82 3.25 9.34 1.18 0.64 2.11 5,025
Customer liability margin (%) 0.97 0.45 2.38 nm 1.07 1.12 1.11 2,320
Non-customer generated margin (%)
0.36 0.35 0.22 (0.66) 0.14 0.25 0.22 989
Net interest margin 1.39 1.07 3.13 8.68 1.26 1.23 1.86 8,334
Average customer assets (£m) 123,217 41,241 34,084 32,072 68,048 19,325 317,987 n/a
Average customer liabilities (£m) 111,044 15,034 22,255 nm 81,833 49,182 279,348 n/a
As at 30 September 2011
Customer asset margin (%) 1.25 0.91 2.93 9.59 1.53 0.78 2.23 5,303
Customer liability margin (%) 0.85 0.59 2.67 nm 0.91 0.97 1.03 2,077
Non-customer generated margin (%)
0.48 0.51 0.38 0.13 0.35 0.38 0.41 1,806
Net interest margin 1.54 1.33 3.21 9.72 1.56 1.30 2.09 9,185
Average customer assets (£m) 117,540 43,693 39,178 29,973 69,881 17,143 317,408 n/a
Average customer liabilities (£m) 107,276 18,021 23,884 nm 76,249 43,957 269,387 n/a
23 | Barclays Q3 2012 Interim Management Statement | 31 October 2012
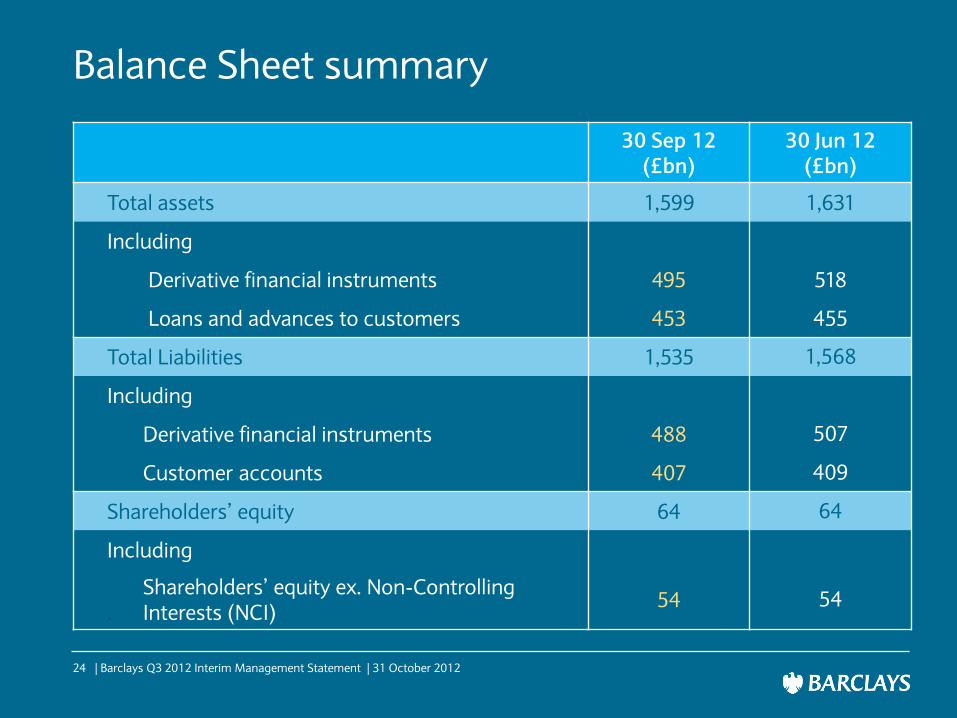
Balance Sheet summary
30 Sep 12 (£bn)
30 Jun 12 (£bn)
Total assets 1,599 1,631
Including
Derivative financial instruments 495 518
Loans and advances to customers 453 455
Total Liabilities 1,535 1,568
Including
Derivative financial instruments 488 507
Customer accounts 407 409
Shareholders’ equity 64 64
Including
Shareholders’ equity ex. Non-Controlling . Interests (NCI)
54 54
24 | Barclays Q3 2012 Interim Management Statement | 31 October 2012

As at 30 Sep 12
(£bn) 30 Jun 12
(£bn)
Total assets 1,599 1,631
Counterparty netting (411) (426)
Collateral on derivatives (48) (51)
Net settlement balances and cash collateral (100) (97)
Goodwill and intangible assets (8) (8)
Customer assets held under investment contracts (2) (2)
Adjusted total tangible assets 1,030 1048
Total qualifying Tier 1 capital 52 52
Adjusted gross leverage 20x 20x
Adjusted gross leverage (excl. liquidity pool) 17x 17x
Ratio of total assets to shareholders’ equity 25x 26x
Ratio of total assets to shareholders’ equity (excl. liquidity pool) 23x 23x
Calculation of adjusted gross leverage
25 | Barclays Q3 2012 Interim Management Statement | 31 October 2012

As at 30 Sep 12
(£m) 30 Jun 12
(£m)
UK RBB 37,305 36,038
Europe RBB 16,055 16,563
Africa RBB 26,846 27,909
Barclaycard 33,573 33,149
Investment Bank 180,415 190,553
Corporate Banking 64,349 69,328
Wealth and Investment Management 14,095 13,998
Head Office and Other Operations 6,004 2,685
Total RWAs 378,642 390,223
RWAs by business
26 | Barclays Q3 2012 Interim Management Statement | 31 October 2012

Capital resources
As at 30 Sep 12
(£m) 30 Jun 12
(£m)
Shareholders’ equity (ex. NCIs) 54,295 54,205
Net NCIs 2,409 2,525
Regulatory adjustments and deductions:
Goodwill and intangible assets (7,564) (7,574)
Own credit cumulative gain (net of tax) 323 (492)
Defined benefit pension adjustment* (2,297) (2,260)
Unrealised losses on AFS debt securities (433) 83
Unrealised gains on AFS equity (recognised as Tier 2 capital) (88) (95)
Cash flow hedging reserve (2,049) (1,676)
50% excess of expected losses over impairment (net of tax) (519) (500)
50% of securitisation positions (1,550) (1,663)
Other regulatory adjustments (20) 23
Core Tier 1 capital 42,507 42,576
Risk Weighted Assets (RWAs) 378,642 390,223
Core Tier 1 ratio 11.2% 10.9%
* £1bn increase in the deduction for defined benefit pensions, driven by an additional contribution made to the UK Retirement Fund in April 2012 and deducting expected future deficit contributions over the next five years in addition to the pension asset recognised on the Group’s balance sheet
27 | Barclays Q3 2012 Interim Management Statement | 31 October 2012

Pro forma CRD IV capital and RWAs
Reported
Pro forma
Pro forma
Pro forma
Sep-12 Dec-12 Jan-13 Dec-13
CT1 Capital 42.5 42.9 42.9 47.2
CRDIV impact to CT1 Capital 1.3 1.3
CT1 Capital (under CRDIV) 44.2 48.5
Sep-12 RWAs 379 379 379 379
Operational Risk and Slotting (Q4-12) 15 15 15
RWAs (post Operational Risk & Slotting) 394 394 394
CRDIV impact to RWAs:
CVA 46 46
Securitisation 39 39
Other 23 23
Gross impact 108 108
Planned Management actions (17) (38)
Net Impact of CRDIV 91 70
RWAs (post CRD IV) 485 464
Transitional CT1 Ratio 11.2% 10.9% 9.1% 10.4%
Other 2014 - 2018 transitional deductions (4.6) (4.6)
Fully loaded CT1 Capital 39.6 43.9
Fully loaded CT1 Ratio 8.2% 9.5%
28 | Barclays Q3 2012 Interim Management Statement | 31 October 2012

CRD IV impact on capital and RWAs Notes on Proforma CRD IV Capital Ratios
1. Proforma uses consensus estimates for retained earnings from 23 sell-side analysts, including consensus dividend payout. Barclays neither endorses nor verifies the estimates used
2. Proforma assumes exercise of outstanding warrants (£0.8bn) by October 2013. There is a risk that these warrants will not be exercised (strike price is £1.977)
3. No growth in RWAs is assumed for new business activity. However September 2012 RWAs are assumed to increase in Q4 12 for increases to our assessment of Operational Risk and regulatory change relating to Commercial Real Estate (“Slotting”)
4. The pro forma RWA increase from Basel 3 includes 1250% risk weighting of securitisation positions while pro forma capital includes the add back of Basel 2 50/50 securitisation deductions
5. Planned management actions relate principally to CVA effects and run down of legacy assets
6. Proforma ratios remain subject to final CRD IV rules and market conditions notably due to CVA’s sensitivity to credit spreads
7. Other CRDIV impact to RWAs include adjustments for Central Clearing, Asset Valuation Correlation, withdrawal of national discretion of definition of default, Deferred Tax Assets, Material Holdings and other Counterparty Credit Risk
8. Transitional Core Tier 1 (CT1) ratios post December 2012 do not include Basel 3 2014-2018 phased deductions. Fully loaded CT1 ratios reflect these deductions in full as if applied on an accelerated basis. These deductions comprise excess Minority Interests, Deferred Tax Assets, Available for Sale (AFS) debt and equity reserve, EL>Impairment and Material Holdings, and also Debit Valuation Adjustments (DVA) and Prudential Valuation Adjustments (PVA)
9. In absence of clear guidance in CRD IV draft, PVA is assumed to transition in. There is a risk that this deduction will have no transitional provisions. If this scenario materialises, January 2013 Transitional CT1 ratio will be c. 30bps lower with no impact of Fully Loaded CT1 ratio
FSA Guidance on Publication of Ratios (issued 29/10/2012)
1. Post implementation of CRD IV, the FSA has asked that banks publish Common Equity Tier 1 (CET1) as prescribed by CRD IV Transitional Rules. In addition, the FSA will require certain UK banks to continue to disclose ratios using their 2009 definition of CT1 capital
2. The key difference between the calculation of CET1 and CT1 is the treatment of intangible assets, which are already fully deducted from CT1, but will not be deducted from CET1 at the inception of CRD IV and instead will be phased-in between 2014-2018 at 20% per year
29 | Barclays Q3 2012 Interim Management Statement | 31 October 2012

Investment Bank credit market exposures
Nine months ended 30 Sep 12
As at 30 Sep 12
(£m) 31 Dec 11
(£m)
FV (losses) / gains (£m)
Imp. (charge) / release
(£m)
Total (losses) /
gains (£m)
ABS CDO Super Senior 1,536 1,842 (24) (129) (153)
US sub-prime and Alt-A 803 1,381 68 (12) 56
Commercial real estate loans and properties
2,821 5,329 78 - 78
Commercial Mortgage Backed Securities 303 1,022 135 - 135
Monoline protection on CMBS 3 9 - - -
Leveraged Finance 3,739 4,066 (42) 7 (35)
SIVs, SIV-Lites and CDPCs - 6 (1) - (1)
Monoline protection on CMBS 668 1,120 (30) - (30)
CLO and Other assets 130 386 52 - 52
Total 10,003 15,161 236 (134) 102
30 | Barclays Q3 2012 Interim Management Statement | 31 October 2012

As at 30 September 2012 Spain (£m)
Italy (£m)
Portugal (£m)
Ireland (£m)
Sovereign 2,165 1,946 627 10
Corporate 4,175 1,790 2,190 1,023
Residential mortgages 13,261 15,238 3,436 78
Financial institutions 2,866 298 67 3,790
Other retail lending 2,815 1,991 1,752 105
Total 25,282 21,263 8,072 5,006
Total as at 30 June 2012 25,039 22,902 8,437 5,738
Reduced exposure to the Eurozone periphery
Total net on-balance sheet exposure as at 30 September 2012 for Greece and Cyprus was £83m and £210m respectively
31 | Barclays Q3 2012 Interim Management Statement | 31 October 2012

Madrid c.30%
Barcelona c.13%
Spanish exposures
Retail
Average indexed LTV of 64%
Average retail customer age 48; less than 1% of mortgage balances with customers aged under 25
0.7% of home loans greater than 90 days in arrears*
Corporate
£4.6bn gross lending to corporates with £1.1bn impairment providing 59% coverage on £1.9bn CRLs
This includes £2.1bn gross lending to property and construction with £0.9bn impairment providing CRL coverage of 58%
Sovereign
Largely AFS government bonds. No impairment and £69m loss held in AFS reserve
Gross mortgage exposure by location of outstanding balances
* Greater than 90 days in arrears exclude recovery balances
32 | Barclays Q3 2012 Interim Management Statement | 31 October 2012

Lisbon c.40%
Porto c.15%
Portuguese exposures
Retail
Average indexed LTV of 73%
Average retail customer age 40; less than 1% of mortgage balances with customers aged under 25
0.6% of home loans greater than 90 days in arrears*
Corporate
£1.7bn gross lending to corporates with £0.3bn impairment providing 57% coverage on £0.4bn CRLs
This includes £0.4bn net lending to property and construction
Sovereign
Largely AFS government bonds. No impairment and £15m loss held in AFS reserve
* Greater than 90 days in arrears exclude recovery balances
Gross mortgage exposure by location of outstanding balances
33 | Barclays Q3 2012 Interim Management Statement | 31 October 2012

Rome c.19%
Milan c.10%
Italian exposures
Retail
Average indexed LTV of 47%
Average retail customer age 46; less than 3% of mortgage balances with customers aged under 25
1.0% of home loans greater than 90 days in arrears*
Corporate
Focused on large corporate clients with very limited exposure to property sector
Balances in early warning lists broadly stable since December 2011
Sovereign
Largely AFS government bonds. No impairment or loss in the AFS reserve
* Greater than 90 days in arrears exclude recovery balances
Gross mortgage exposure by location of outstanding balances
34 | Barclays Q3 2012 Interim Management Statement | 31 October 2012

Legal disclaimers
Important Notice
The information, statements and opinions contained in this document do not constitute a public offer under any applicable legislation or an offer to sell or solicitation of any offer to buy any securities or financial instruments or any advice or recommendation with respect to such securities or other financial instruments.
Forward-looking Statements
This document contains certain forward-looking statements within the meaning of Section 21E of the US Securities Exchange Act of 1934, as amended, and Section 27A of the US Securities Act of 1933, as amended, with respect to certain of the Group’s plans and its current goals and expectations relating to its future financial condition and performance. Barclays cautions readers that no forward-looking statement is a guarantee of future performance and that actual results could differ materially from those contained in the forward-looking statements. These forward-looking statements can be identified by the fact that they do not relate only to historical or current facts. Forward-looking statements sometimes use words such as “may”, “will”, “seek”, “continue”, “aim”, “anticipate”, “target”, “expect”, “estimate”, “intend”, “plan”, “goal”, “believe” or other words of similar meaning. Examples of forward-looking statements include, among others, statements regarding the Group’s future financial position, income growth, assets, impairment charges, business strategy, capital ratios, leverage, payment of dividends, projected levels of growth in the banking and financial markets, projected costs, estimates of capital expenditures and plans and objectives for future operations and other statements that are not historical fact. By their nature, forward-looking statements involve risk and uncertainty because they relate to future events and circumstances, including, but not limited to, UK domestic, Eurozone and global economic and business conditions, the effects of continued volatility in credit markets, market related risks such as changes in interest rates and exchange rates, effects of changes in valuation of credit market exposures, changes in valuation of issued notes, the policies and actions of governmental and regulatory authorities (including requirements regarding capital and Group structures and the potential for one or more countries exiting the Euro), changes in legislation, the further development of standards and interpretations under IFRS applicable to past, current and future periods, evolving practices with regard to the interpretation and application of standards under IFRS, the outcome of current and future legal proceedings, the success of future acquisitions and other strategic transactions and the impact of competition – a number of such factors being beyond the Group’s control. As a result, the Group’s actual future results may differ materially from the plans, goals, and expectations set forth in the Group’s forward-looking statements.
35 | Barclays Q3 2012 Interim Management Statement | 31 October 2012