presentation title set in arial italic, 46pt, black
TRANSCRIPT
© 2011 Sprint © 2011 Sprint
Sprint Nextel
3Q11 Earnings Conference Call
October 26, 2011

© 2011 Sprint
This presentation includes “forward-looking statements” within the meaning of the securities laws. The statements in this presentation regarding the business outlook, expected performance and forward-looking
guidance, as well as other statements that are not historical facts, are forward-looking statements. The words "estimate," "project," "forecast," "intend," "expect," "believe," "target," "providing guidance" and
similar expressions are intended to identify forward-looking statements. Forward-looking statements are estimates and projections reflecting management's judgment based on currently available information
and involve a number of risks and uncertainties that could cause actual results to differ materially from those suggested by the forward-looking statements. With respect to these forward-looking statements,
management has made assumptions regarding, among other things, customer and network usage, customer growth and retention, pricing, operating costs, the timing of various events and the economic and
regulatory environment.
Future performance cannot be assured. Actual results may differ materially from those in the forward-looking statements. Some factors that could cause actual results to differ include:
• our ability to attract and retain subscribers;
• the ability of our competitors to offer products and services at lower prices due to lower cost structures;
• the effects of vigorous competition on a highly penetrated market, including the impact of competition on the price we are able to charge subscribers for services and equipment we provide and our
ability to attract new subscribers and retain existing subscribers; the impact of subsidy costs; the impact of increased purchase commitments, the overall demand for our service offerings, including the
impact of decisions of new or existing subscribers between our postpaid and prepaid services offerings and between our two network platforms; and the impact of new, emerging and competing
technologies on our business;
• the ability to generate sufficient cash flow to fully implement our network modernization plan, Network Vision, to improve and enhance our networks and service offerings, implement our business
strategies and provide competitive new technologies;
• the effective implementation of Network Vision, including timing, execution, technologies, and costs;
• the ability to consummate the LightSquared transaction and obtain the associated financial benefits;
• changes in available technology and the effects of such changes, including product substitutions and deployment costs;
• our ability to obtain additional financing on terms acceptable to us, or at all;
• volatility in the trading price of our common stock, current economic conditions and our ability to access capital;
• the impact of unrelated parties not meeting our business requirements, including a significant adverse change in the ability or willingness of such parties to provide devices or infrastructure equipment
for our CDMA network, or Motorola Mobility, Inc.'s or Motorola Solutions Inc.'s ability or willingness to provide related devices, infrastructure equipment and software applications for our iDEN network;
• the costs and business risks associated with providing new services and entering new geographic markets;
• the financial performance of Clearwire and its ability to operate and maintain its 4G network;
• the effects of mergers and consolidations and new entrants in the communications industry and unexpected announcements or developments from others in the communications industry;
• unexpected results of litigation filed against us or our suppliers or vendors;
• the impact of adverse network performance;
• the costs or potential customer impacts of compliance with regulatory mandates including, but not limited to, compliance with the FCC's Report and Order to reconfigure the 800 MHz band;
• equipment failure, natural disasters, terrorist acts or other breaches of network or information technology security;
• one or more of the markets in which we compete being impacted by changes in political, economic or other factors such as monetary policy, legal and regulatory changes or other external factors over
which we have no control; and .other risks referenced from time to time in our filings with the Securities and Exchange Commission, including in Part I, Item IA “Risk Factors” of our annual report on
Form 10-K for the year ended December 31, 2010 and our subsequent quarterly reports on Form 10-Q.
Sprint Nextel believes these forward-looking statements are reasonable; however, you should not place undue reliance on forward-looking statements, which are based on current expectations and speak only as of the
date of this presentation. Sprint Nextel is not obligated to publicly release any revisions to forward-looking statements to reflect events after the date of this presentation.
Clearwire’s third quarter 2011 results from operations have not yet been finalized. As a result, the amount reflected for Sprint’s share of Clearwire’s results of operations for the quarter ended September 30, 2011, is an
estimate and, based upon the finalization of Clearwire’s results, may need to be revised if our estimate materially differs from Clearwire’s actual results. Changes in our estimate, if any, would affect the carrying
value of our investment in Clearwire, net loss and basic and diluted loss per common share but would have no effect on Sprint’s operating income, OIBDA*, Adjusted OIBDA* or consolidated statement of cash
flows.
Cautionary Statement
2
© 2011 Sprint
*Non-GAAP Financial Measures
3
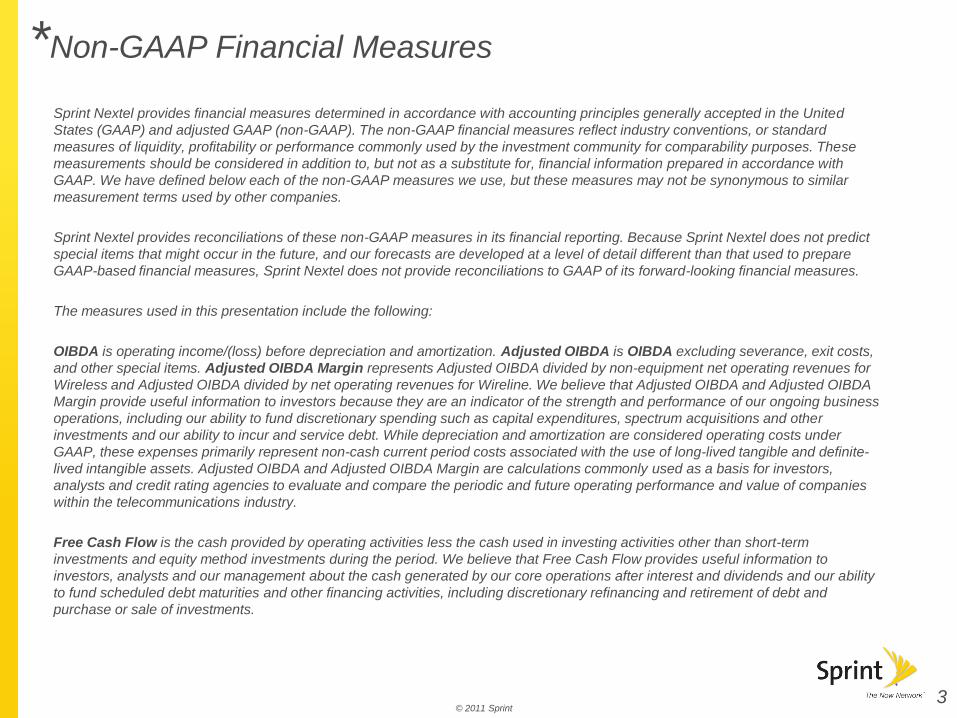
Sprint Nextel provides financial measures determined in accordance with accounting principles generally accepted in the United
States (GAAP) and adjusted GAAP (non-GAAP). The non-GAAP financial measures reflect industry conventions, or standard
measures of liquidity, profitability or performance commonly used by the investment community for comparability purposes. These
measurements should be considered in addition to, but not as a substitute for, financial information prepared in accordance with
GAAP. We have defined below each of the non-GAAP measures we use, but these measures may not be synonymous to similar
measurement terms used by other companies.
Sprint Nextel provides reconciliations of these non-GAAP measures in its financial reporting. Because Sprint Nextel does not predict
special items that might occur in the future, and our forecasts are developed at a level of detail different than that used to prepare
GAAP-based financial measures, Sprint Nextel does not provide reconciliations to GAAP of its forward-looking financial measures.
The measures used in this presentation include the following:
OIBDA is operating income/(loss) before depreciation and amortization. Adjusted OIBDA is OIBDA excluding severance, exit costs,
and other special items. Adjusted OIBDA Margin represents Adjusted OIBDA divided by non-equipment net operating revenues for
Wireless and Adjusted OIBDA divided by net operating revenues for Wireline. We believe that Adjusted OIBDA and Adjusted OIBDA
Margin provide useful information to investors because they are an indicator of the strength and performance of our ongoing business
operations, including our ability to fund discretionary spending such as capital expenditures, spectrum acquisitions and other
investments and our ability to incur and service debt. While depreciation and amortization are considered operating costs under
GAAP, these expenses primarily represent non-cash current period costs associated with the use of long-lived tangible and definite-
lived intangible assets. Adjusted OIBDA and Adjusted OIBDA Margin are calculations commonly used as a basis for investors,
analysts and credit rating agencies to evaluate and compare the periodic and future operating performance and value of companies
within the telecommunications industry.
Free Cash Flow is the cash provided by operating activities less the cash used in investing activities other than short-term
investments and equity method investments during the period. We believe that Free Cash Flow provides useful information to
investors, analysts and our management about the cash generated by our core operations after interest and dividends and our ability
to fund scheduled debt maturities and other financing activities, including discretionary refinancing and retirement of debt and
purchase or sale of investments.

© 2011 Sprint
Consolidated Earnings per Share
4
Sprint Nextel CorporationIncome Statement on a per Share basis (Unaudited)
Quarter To Date
September 30, June 30, September 30,
2011 2011 2010
Operating Income (Loss) per share 0.07$ 0.03$ (0.07)$
Interest expense per share (0.08) (0.08) (0.12)
Equity in losses of unconsolidated
investments and other, net per share(0.09) (0.20) (0.09)
Loss before Income Taxes per share (1) (0.10)$ (0.25)$ (0.29)$
Income tax expense per share (0.00) (0.03) (0.01)
Net Loss per share (0.10)$ (0.28)$ (0.30)$
(1) Loss before Incomes Tax per share is presented gross excluding the effect of income taxes.

© 2011 Sprint 5
© 2011 Sprint
6
• Best Ever Postpaid Brand Health measures
(Ipsos)
- Most Want to Investigate
- Purchase Consideration
- Positive Brand Momentum
- First Brand Preference
Brand
6
© 2011 Sprint
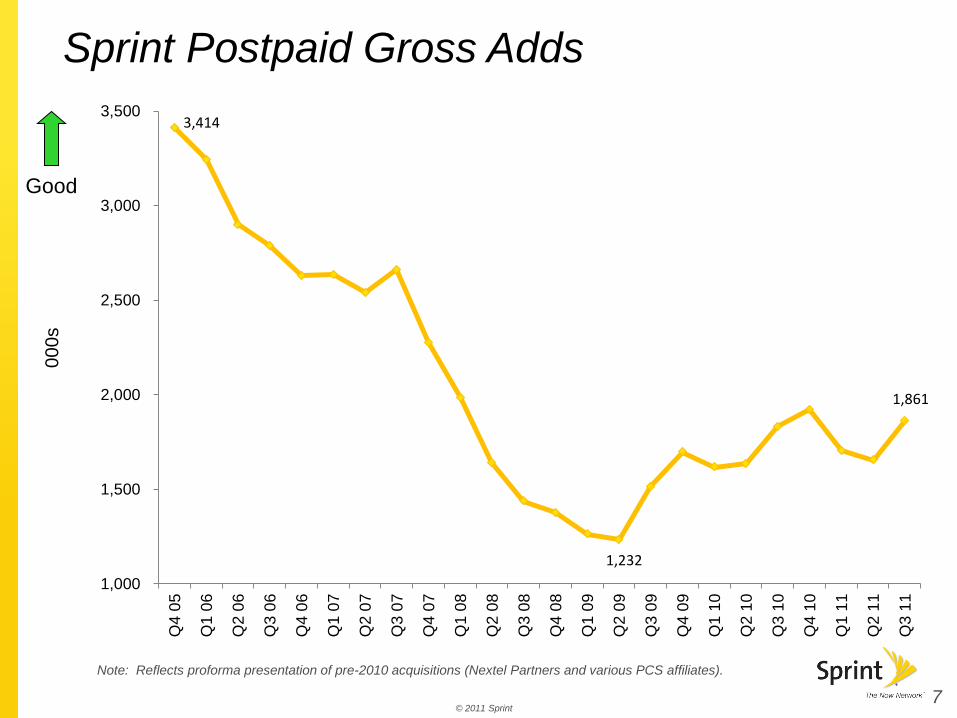
3,414
1,232
1,861
1,000
1,500
2,000
2,500
3,000
3,500
Q4 0
5
Q1 0
6
Q2 0
6
Q3 0
6
Q4 0
6
Q1 0
7
Q2 0
7
Q3 0
7
Q4 0
7
Q1 0
8
Q2 0
8
Q3 0
8
Q4 0
8
Q1 0
9
Q2 0
9
Q3 0
9
Q4 0
9
Q1 1
0
Q2 1
0
Q3 1
0
Q4 1
0
Q1 1
1
Q2 1
1
Q3 1
1
000s
Good
Sprint Postpaid Gross Adds
7
Note: Reflects proforma presentation of pre-2010 acquisitions (Nextel Partners and various PCS affiliates).
© 2011 Sprint
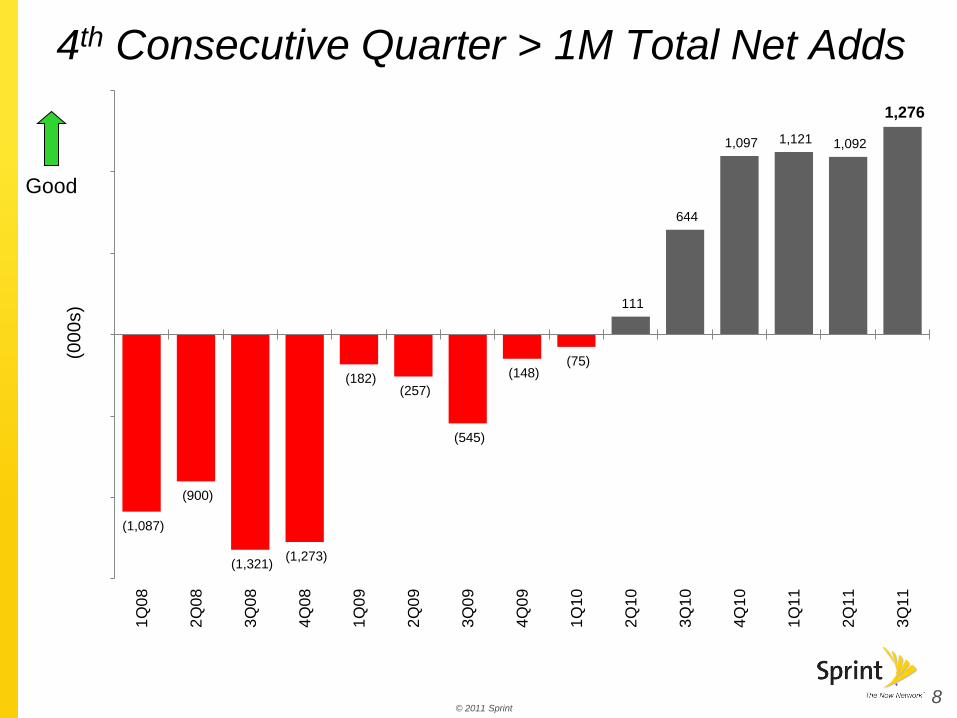
4th Consecutive Quarter > 1M Total Net Adds
(1,087)
(900)
(1,321) (1,273)
(182) (257)
(545)
(148) (75)
111
644
1,097 1,121 1,092
1,276
(1,500)
(1,000)
(500)
-
500
1,000
1,500
1Q
08
2Q
08
3Q
08
4Q
08
1Q
09
2Q
09
3Q
09
4Q
09
1Q
10
2Q
10
3Q
10
4Q
10
1Q
11
2Q
11
3Q
11
(00
0s)
Good
8
© 2011 Sprint
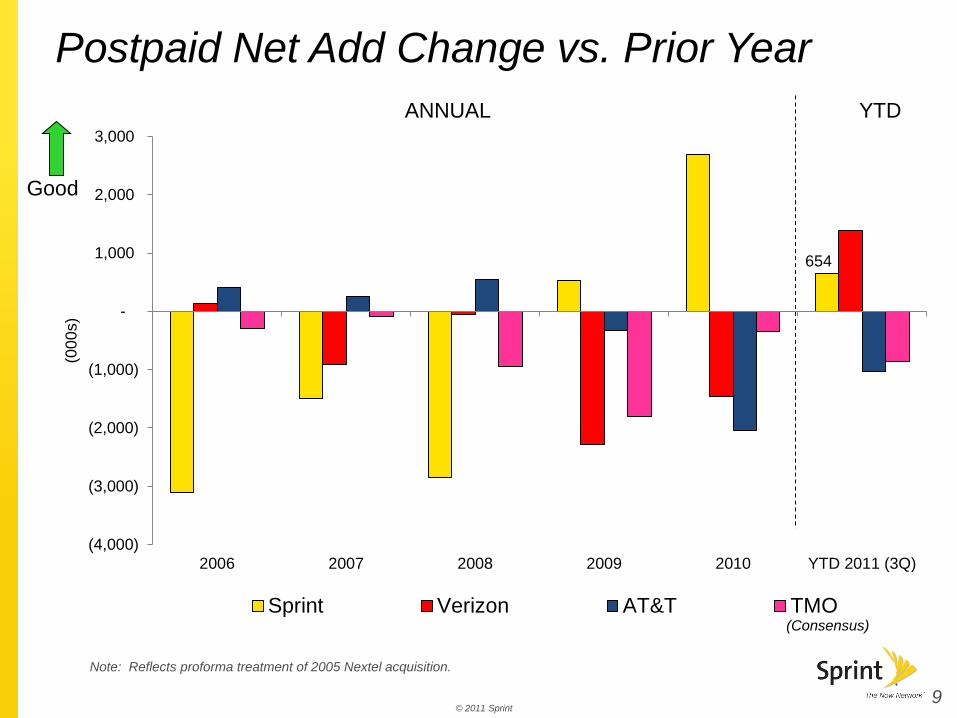
654
(4,000)
(3,000)
(2,000)
(1,000)
-
1,000
2,000
3,000
2006 2007 2008 2009 2010 YTD 2011 (3Q)
(00
0s)
Sprint Verizon AT&T TMO
ANNUAL YTD
Postpaid Net Add Change vs. Prior Year
Good
(Consensus)
9
Note: Reflects proforma treatment of 2005 Nextel acquisition.
© 2011 Sprint
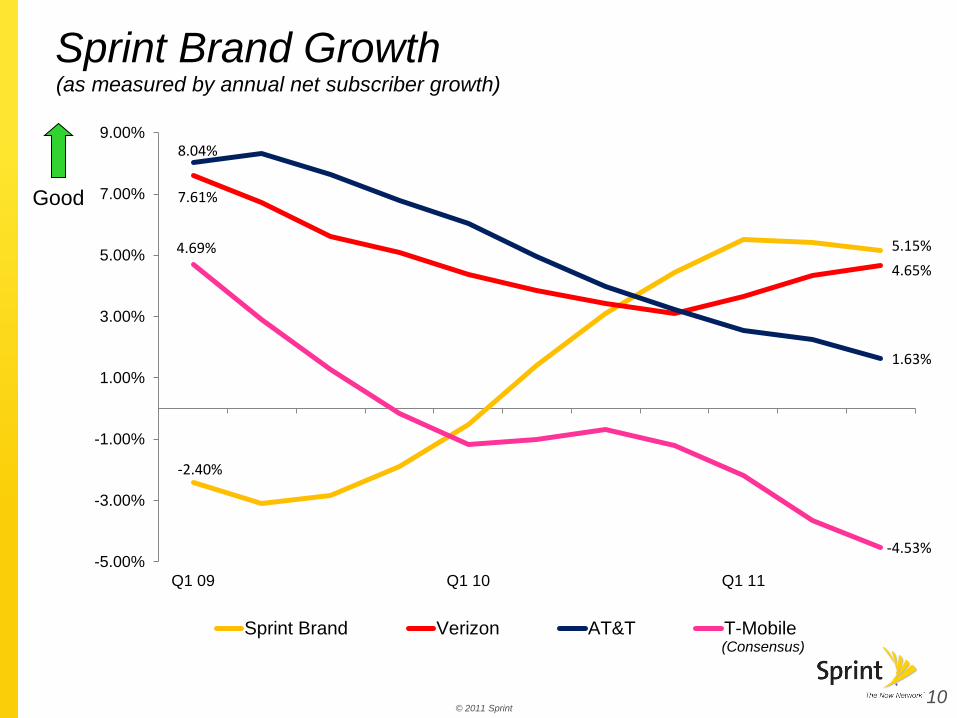
-2.40%
5.15%
7.61%
4.65%
8.04%
1.63%
4.69%
-4.53% -5.00%
-3.00%
-1.00%
1.00%
3.00%
5.00%
7.00%
9.00%
Q1 09 Q1 10 Q1 11
Sprint Brand Verizon AT&T T-Mobile
(as measured by annual net subscriber growth)
Good
Sprint Brand Growth
10
(Consensus)
© 2011 Sprint
11
11
© 2011 Sprint
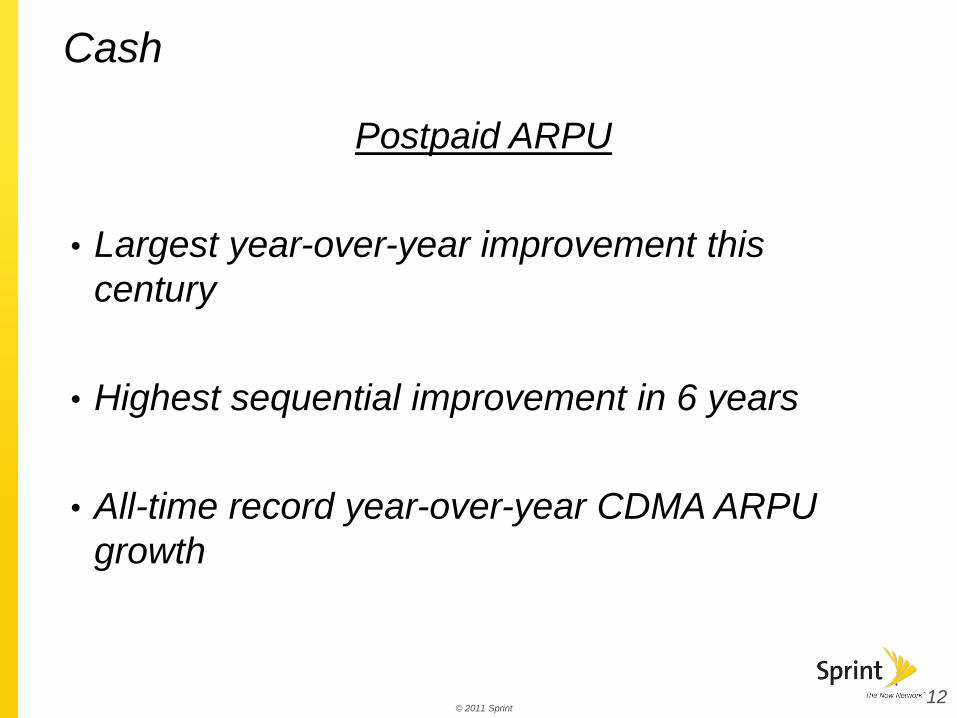
Postpaid ARPU
• Largest year-over-year improvement this
century
• Highest sequential improvement in 6 years
• All-time record year-over-year CDMA ARPU
growth
Cash
12

© 2011 Sprint
• Total Operating Revenues up year-over-year for
fifth consecutive quarter
• Total Service Revenues and Wireless Service
Revenues saw largest year-over-year
percentage increases since 2006
• Drove best Q3 OIBDA sequential improvement
percentage in 6 years
Cash (cont’d)
13
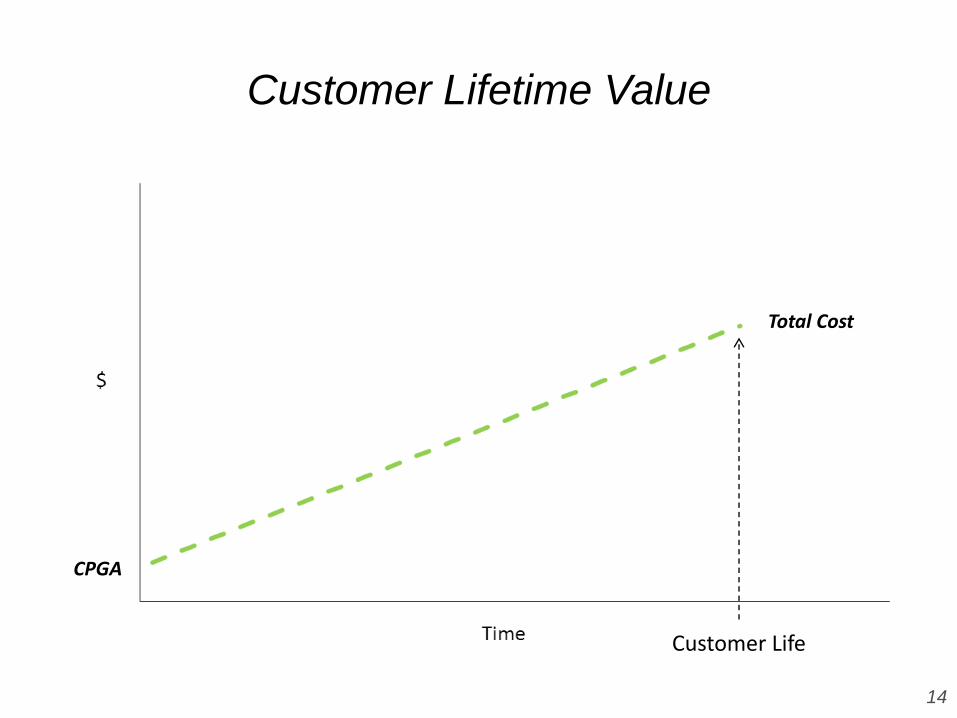
Customer Lifetime Value
Total Cost
Customer Life
CPGA
14

CLV
Breakeven
Total Revenue
Total Cost
CPGA
Customer Life
Customer Lifetime Value
15

Customer Lifetime Value Expected iPhone CLV is more than 50% Greater
CLV
Total Revenue
Total Cost
CPGA
Breakeven Customer Life
16
© 2011 Sprint
$5,500
$6,000
$6,500
$7,000
$7,500
$ M
illio
ns
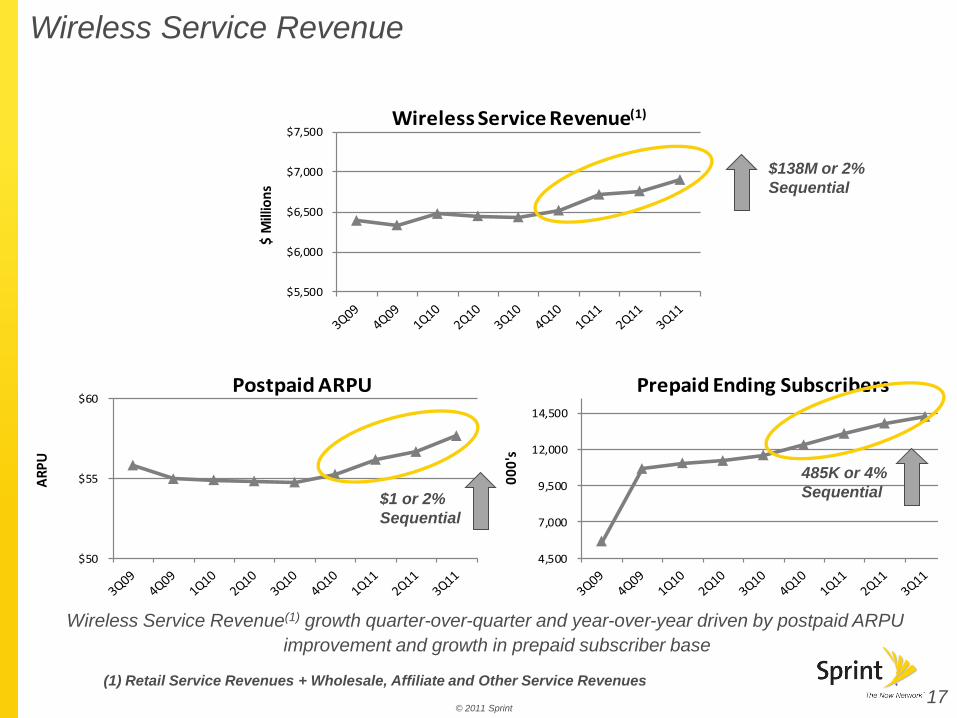
Wireless Service Revenue(1)
$50
$55
$60
AR
PU
Postpaid ARPU
4,500
7,000
9,500
12,000
14,500
00
0's
Prepaid Ending Subscribers
Wireless Service Revenue(1) growth quarter-over-quarter and year-over-year driven by postpaid ARPU
improvement and growth in prepaid subscriber base
Wireless Service Revenue
(1) Retail Service Revenues + Wholesale, Affiliate and Other Service Revenues
$138M or 2%
Sequential
17
$1 or 2%
Sequential
485K or 4%
Sequential
© 2011 Sprint
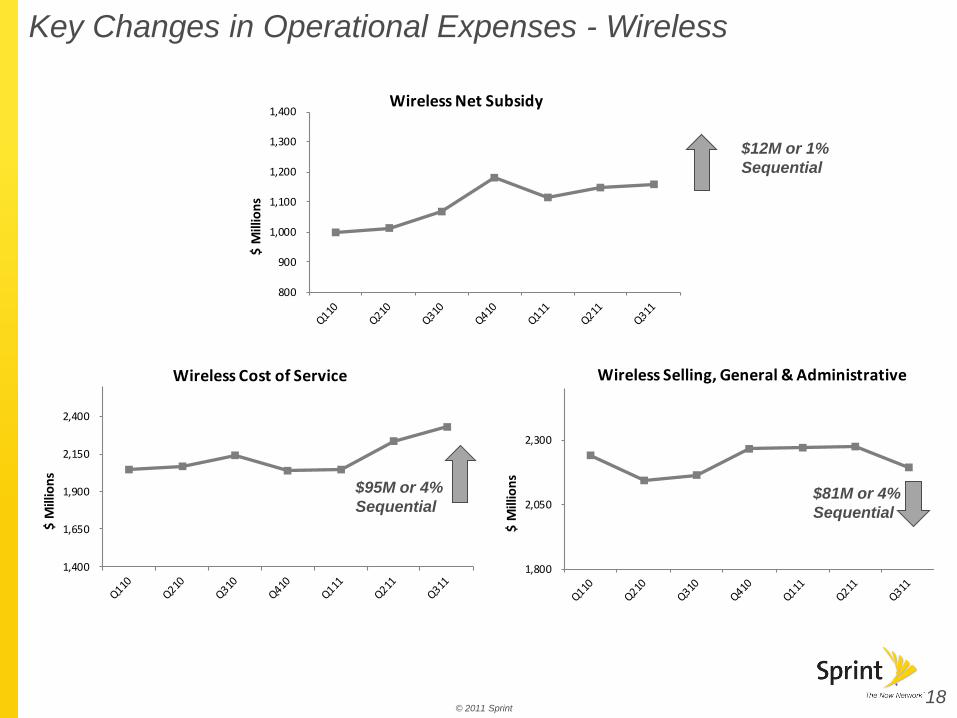
Key Changes in Operational Expenses - Wireless
18
800
900
1,000
1,100
1,200
1,300
1,400
$ M
illio
ns
Wireless Net Subsidy
1,400
1,650
1,900
2,150
2,400
$ M
illio
ns
Wireless Cost of Service
1,800
2,050
2,300
$ M
illio
ns
Wireless Selling, General & Administrative
$12M or 1%
Sequential
$95M or 4%
Sequential $81M or 4%
Sequential
© 2011 Sprint
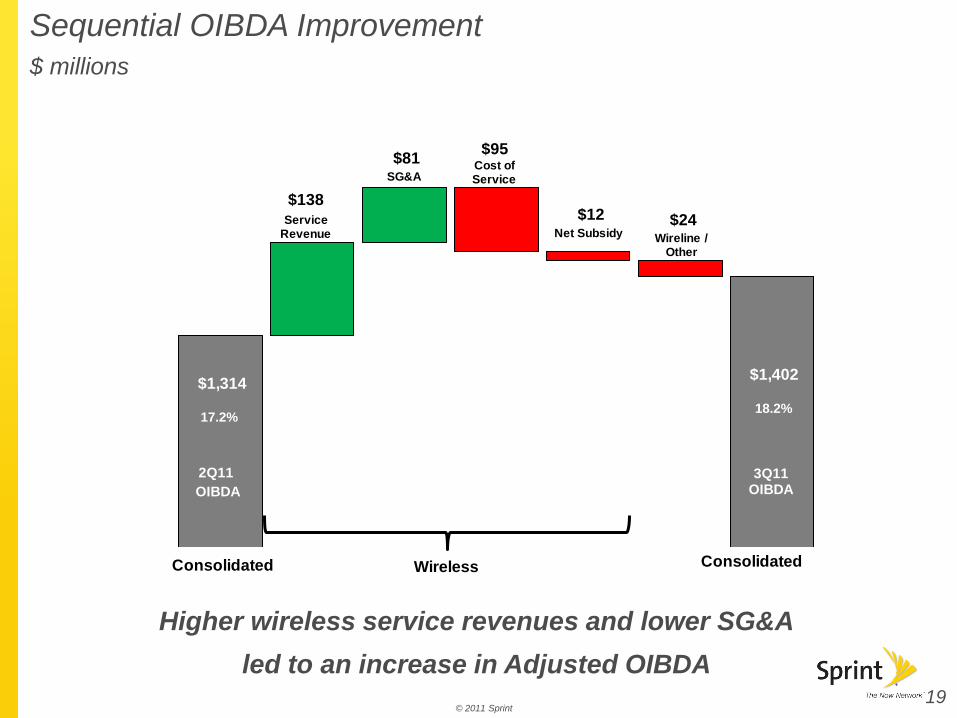
$1,314
$138
$81 $95
$12 $24
$1,402
Servic
2Q11
OIBDA
3Q11 OIBDA
SG&ACost of Service
Wireless
Wireline / Other
2Q11
Adjusted OIBDA*
Service Revenue Net Subsidy
Consolidated Consolidated
Sequential OIBDA Improvement
$ millions
Higher wireless service revenues and lower SG&A
led to an increase in Adjusted OIBDA 19
17.2%
18.2%

© 2011 Sprint
• $4.0B cash, cash equivalents and short-term investments
and $5.0B of liquidity exiting 3Q11
• Next note and loan maturities of $2.25B are due March 2012
Liquidity Position $ billions
20
$0.7
$0.7
$0.8 $0.9
$1.0
$4.7 $5.5
$4.0 $4.3 $4.0
3Q10 4Q10 1Q11 2Q11 3Q11
AvailableRevolver
Cash

© 2011 Sprint
Free Cash Flow
21
(Millions)
See accompanying Notes to the Financial Information (Unaudited) in the Press Release
September 30, 2011 June 30, 2011 September 30, 2010 3Q11 vs 2Q11 3Q11 vs 3Q10
Adjusted OIBDA 1,402$ 1,314$ 1,339$ 88$ 63$
Net Cash Provided by Operating Activities 608$ 1,075$ 971$ (467)$ (363)$
Capital Expenditures (818) (759) (490) (59) (328)
Expenditures Related to FCC Licenses (71) (54) (108) (17) 37
Other investing activities, net 8 5 11 3 (3)
Free Cash Flow* (273)$ 267$ 384$ (540)$ (657)$
September 30, 2011 June 30, 2011 September 30, 2010 3Q11 vs 2Q11 3Q11 vs 3Q10
Accounts Receivable, Net 3,054$ 3,082$ 3,042$ 28$ (12)$
Inventory 923 1,160 562 237 (361)
Prepaid & Other Current Assets 516 504 770 (12) 254
Accounts Payable (2,188) (3,035) (2,423) (847) (235)
Accrued Expenses & Other (3,237) (3,340) (3,366) (103) (129)
Working Capital (932)$ (1,629)$ (1,415)$ (697)$ (483)$
Quarter Ended
Quarter Ended
Key Working Capital Elements

© 2011 Sprint
OIBDA Estimate
$7 to $8 billion NPV
over expected
customer life
iPhone Estimates
$1.0B to
$1.2B
$6.0B to
$6.8B
Higher Subscriber Profitability
Metrics
• Churn Improvement (> 10%)
• Network Efficiency (> 50%)
Incremental Gross Adds
22
FY 11 FY 12 FY 13 FY 14 FY 15
Contribution margin from iPhone $(0.0) $0.8 $1.7 $2.6 $3.4
Cost of upgrades and handset sales,including commissions
$(0.6) $(1.9) $(2.8) $(3.3) $(2.9)
OIBDA Impact $(0.6) $(1.1) $(1.1) $(0.7) $0.5
OIBDA Margin Impact (2.1%) (3.7%) (3.9%) (2.8%) 0.3%
$(3.7)
$(2.7)
$(1.7)
$(0.7)
$0.3
$1.3
$2.3
$3.3
$ B
illio
ns
Contribution margin from iPhone
Cost of upgrades and handset
sales, including commissions
OIBDA Impact

© 2011 Sprint
Network Vision Estimated OIBDA Impacts
Gross Operating Costs and Gross Benefits
23
• Project NPV of ~ $6 billion
2011 2012 2013 2014 2015 2016 2017
Network Vision Operating Expenses ($0.1) ($1.4) ($1.4) ($0.6) ($0.4) ($0.2) ($0.2)
Network Vision Benefits ($0.0) $0.3 $1.3 $2.5 $3.0 $3.7 $4.4
Network Vision Net OIBDA Benefits ($0.1) ($1.1) ($0.1) $1.9 $2.7 $3.4 $4.3
OIBDA Margin Impact 0.0% (3.5%) (0.2%) 5.2% 6.6% 8.0% 9.2%
($2.0)
($1.0)
$0.0
$1.0
$2.0
$3.0
$4.0
$5.0
$B
Network Vision Benefits
Network Vision Operating Expenses
Network Vision Net OIBDA Benefits

© 2011 Sprint
Illustrative Funding Needs
24
($9,000)
($3,000)
$3,000
$9,000
2011 2012 2013 2014 2015
$ M
illio
ns
Network Vision Benefits Network Vision Costs
iPhone Benefits iPhone Costs
Illustrative Ending Cash without Financing
Projected funding needs of $5 - $7 billion
(assuming $2 billion target cash balance)
- $4B Refinancing
- $1 - $3B Vendor Financing
Target Cash Balance
$5B $7B

© 2011 Sprint
Q&A
25

© 2011 Sprint
Non-GAAP Reconciliations – Consolidated
(Unaudited)
26
(Millions, except Margin Data)
See accompanying Notes to the Financial Information (Unaudited) in the Press Release
Quarter To Date Year To Date
September 30, June 30, September 30, September 30, September 30,
2011 2011 2010 2011 2010
Net Loss (301)$ (847)$ (911)$ (1,587)$ (2,536)$
Income tax expense (12) (99) (53) (148) (171)
Loss before Income Taxes (289) (748) (858) (1,439) (2,365)
Depreciation 1,114 1,121 1,304 3,357 3,840
Amortization 80 114 248 327 1,022
Interest expense 236 239 361 724 1,114
Equity in losses of unconsolidated investments and other, net 261 588 284 1,261 795
OIBDA* 1,402 1,314 1,339 4,230 4,406
Severance and exit costs (3)
- - - - (4)
Access costs (4)
- - - - (84)
Adjusted OIBDA* 1,402 1,314 1,339 4,230 4,318
Capital expenditures (1)
760 640 462 1,955 1,318
Adjusted OIBDA* less Capex 642$ 674$ 877$ 2,275$ 3,000$
Adjusted OIBDA Margin* 18.2% 17.2% 18.1% 18.4% 19.3%
Selected item:
Deferred tax asset valuation allowance 121 337 365 654 1,032

© 2011 Sprint
Non-GAAP Reconciliations – Wireless
(Unaudited)
27
(Millions, except Margin Data)
See accompanying Notes to the Financial Information (Unaudited) in the Press Release
Quarter To Date
September 30, June 30, September 30, September 30, September 30,
2011 2011 2010 2011 2010
Operating Income (Loss) 131$ (27)$ (345)$ 244$ (962)$
Severance and exit costs (3)
- - - - (1)
Depreciation 1,006 1,018 1,164 3,036 3,433
Amortization 77 111 246 319 1,015
Adjusted OIBDA* 1,214 1,102 1,065 3,599 3,485
Capital expenditures (1)
647 546 341 1,642 971
Adjusted OIBDA* less Capex 567$ 556$ 724$ 1,957$ 2,514$
Adjusted OIBDA Margin* 17.6% 16.3% 16.6% 17.7% 18.0%
Year To Date

© 2011 Sprint
Non-GAAP Reconciliations – Wireline
(Unaudited)
28
(Millions, except Margin Data)
See accompanying Notes to the Financial Information (Unaudited) in the Press Release
Quarter To Date
September 30, June 30, September 30, September 30, September 30,
2011 2011 2010 2011 2010
Operating Income 76$ 105$ 131$ 300$ 502$
Severance and exit costs (3)
- - - - (3)
Access costs (4)
- - - - (84)
Depreciation 108 105 140 322 408
Adjusted OIBDA* 184 210 271 622 823
Capital expenditures (1)
36 35 59 124 164
Adjusted OIBDA* less Capex 148$ 175$ 212$ 498$ 659$
Adjusted OIBDA Margin* 17.3% 19.3% 21.8% 19.0% 21.6%
Year To Date