presentation to disaster & hurricane preparedness workshop history of disasters in new york...
TRANSCRIPT

Presentation to Disaster & Hurricane Preparedness WorkshopHistory of Disasters in New York
Korea Village Open Center AuditoriumTuesday, November 27, 2007
Flushing, New York
Presented by:
Jeanne M. SalvatoreSenior Vice President, Public Affairs & Consumer
Spokesperson, Insurance Information Institute

2
Presentation Outline
I. History of Disasters in New York
- National Perspective
- Local History
- Cost of Insured Property
I. Level of Preparedness
II. Key Disaster Preparedness Actions
III. I.I.I. Resources

3
Most of US Population & Property Has Major CAT Exposure
Is Anyplace Safe?

History of Disasters
National Perspective
5
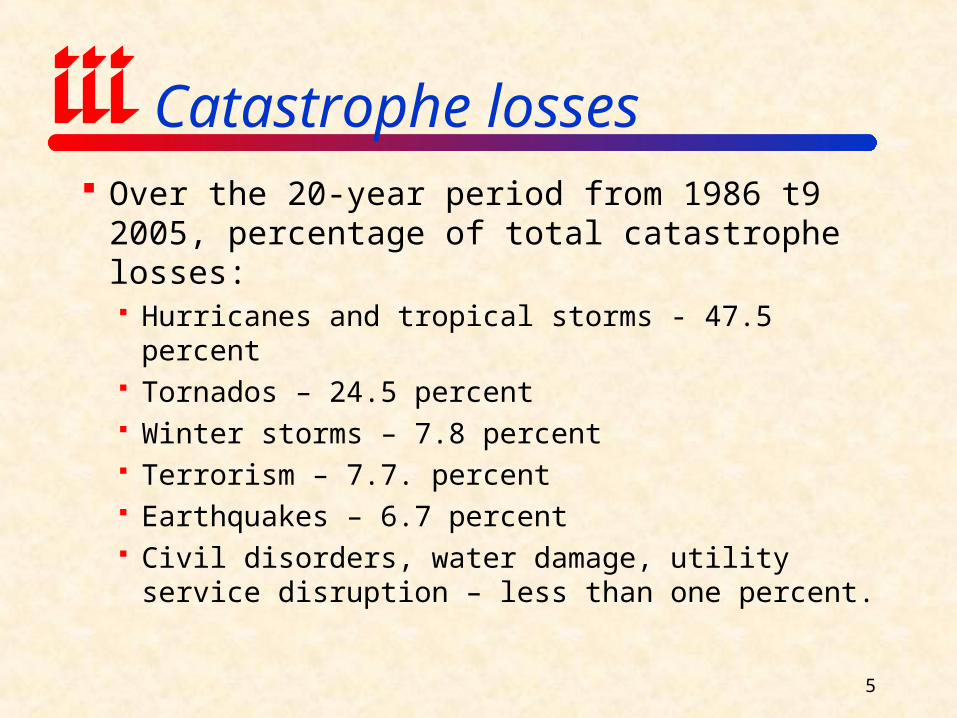
Catastrophe losses
Over the 20-year period from 1986 t9 2005, percentage of total catastrophe losses: Hurricanes and tropical storms - 47.5 percent Tornados – 24.5 percent Winter storms – 7.8 percent Terrorism – 7.7. percent Earthquakes – 6.7 percent Civil disorders, water damage, utility service
disruption – less than one percent.
6
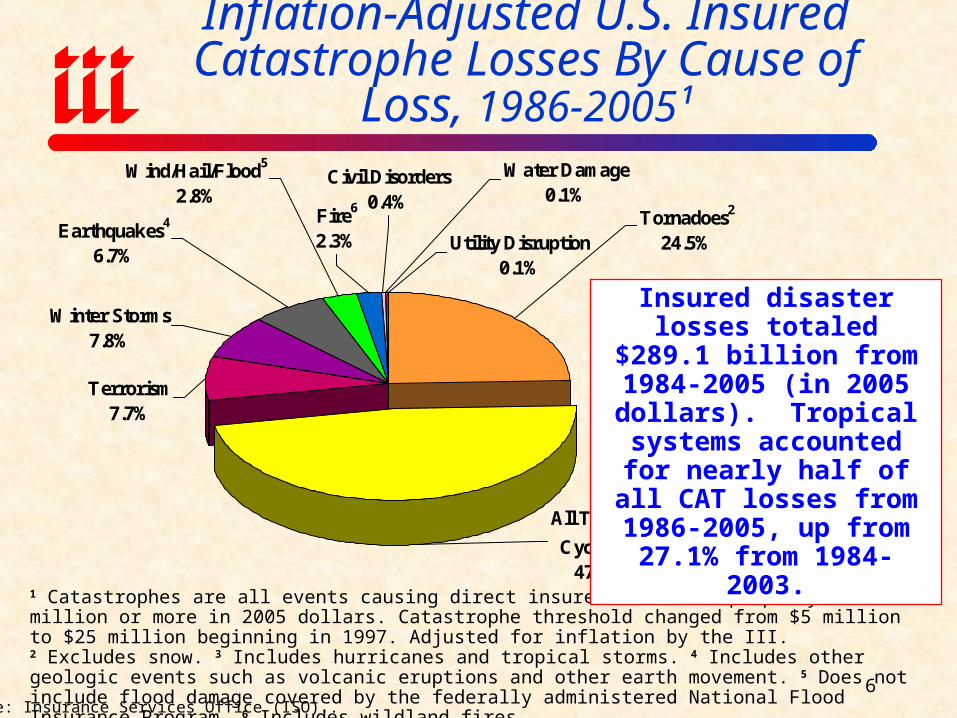
Inflation-Adjusted U.S. Insured Catastrophe Losses By Cause of Loss,
1986-2005¹
Utility Disruption0.1%
Terrorism7.7%
All Tropical
Cyclones3
47.5%
Tornadoes2
24.5%
Water Damage0.1%
Civil Disorders0.4%
Fire6
2.3%
Wind/Hail/Flood5
2.8%
Earthquakes4
6.7%
Winter Storms7.8%
Source: Insurance Services Office (ISO)..
1 Catastrophes are all events causing direct insured losses to property of $25 million or more in 2005 dollars. Catastrophe threshold changed from $5 million to $25 million beginning in 1997. Adjusted for inflation by the III.2 Excludes snow. 3 Includes hurricanes and tropical storms. 4 Includes other geologic events such as volcanic eruptions and other earth movement. 5 Does not include flood damage covered by the federally administered National Flood Insurance Program. 6 Includes wildland fires.
Insured disaster losses totaled $289.1 billion from
1984-2005 (in 2005 dollars). Tropical systems accounted for nearly half of all CAT losses from 1986-2005, up
from 27.1% from 1984-2003.
7
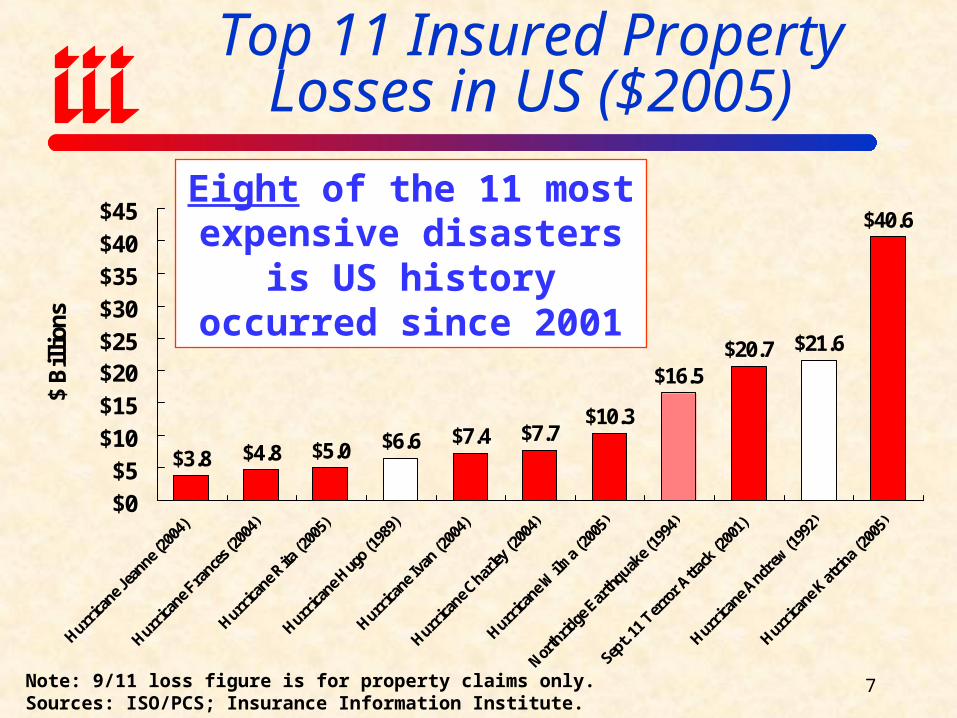
Top 11 Insured PropertyLosses in US ($2005)
$3.8 $4.8 $5.0 $6.6 $7.4 $7.7$10.3
$16.5$20.7 $21.6
$40.6
$0$5
$10$15$20$25$30$35$40$45
Hurrica
ne Jea
nne (20
04)
Hurrica
ne Fra
nces (
2004
)
Hurrica
ne Rita
(200
5)
Hurrica
ne Hug
o (19
89)
Hurrica
ne Iva
n (200
4)
Hurrica
ne Char
ley (2
004)
Hurrica
ne Wilm
a (20
05)
North
ridge
Ear
thquak
e (19
94)
Sept.
11 T
erro
r Atta
ck (2
001)
Hurrica
ne Andr
ew (1
992)
Hurrica
ne Kat
rina (
2005
)
$ B
illi
ons
Note: 9/11 loss figure is for property claims only. Sources: ISO/PCS; Insurance Information Institute.
Eight of the 11 most expensive disasters is US
history occurred since 2001
8
One of the Four Largest Catastrophes Occurred in NY
There have been four megacatastrophes in the U.S.
1. Hurricane Andrew (1992)
2. Northridge Earthquake (1994)
3. 9/11(2001)
4. Hurricane Katrina (2005)
History of Disasters
A Short History of Catastrophes in New York
10
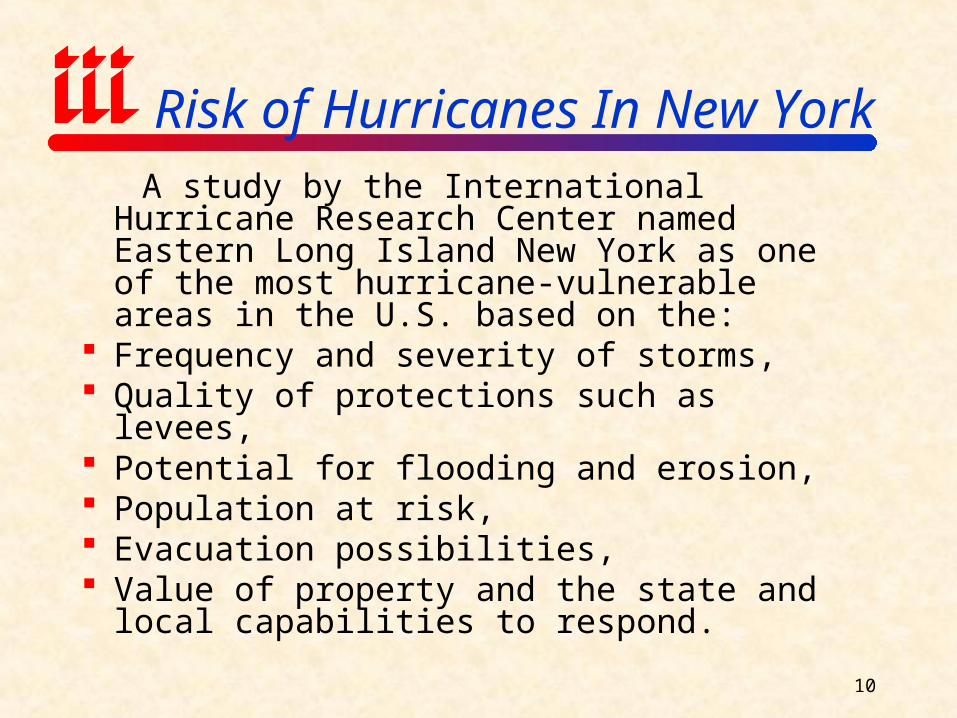
Risk of Hurricanes In New York A study by the International Hurricane Research
Center named Eastern Long Island New York as one of the most hurricane-vulnerable areas in the U.S. based on the:
Frequency and severity of storms, Quality of protections such as levees, Potential for flooding and erosion, Population at risk, Evacuation possibilities, Value of property and the state and local
capabilities to respond.

11
History of Disasters
The worst catastrophe to affect NY was the September 11 World Trade Center bombing, which caused $18.8 billion in insured damages in 2001 or 21.3 billion in 2006 dollars.
12
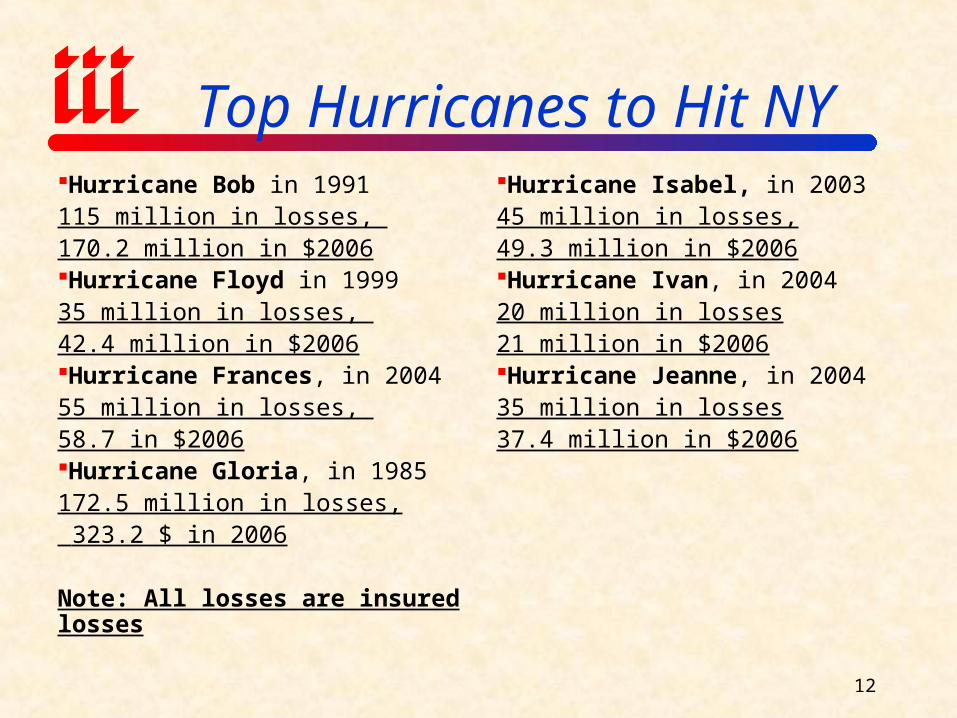
Top Hurricanes to Hit NYHurricane Bob in 1991115 million in losses, 170.2 million in $2006Hurricane Floyd in 199935 million in losses, 42.4 million in $2006Hurricane Frances, in 200455 million in losses, 58.7 in $2006Hurricane Gloria, in 1985172.5 million in losses, 323.2 $ in 2006
Note: All losses are insured losses
Hurricane Isabel, in 200345 million in losses,49.3 million in $2006Hurricane Ivan, in 200420 million in losses21 million in $2006Hurricane Jeanne, in 200435 million in losses37.4 million in $2006
13
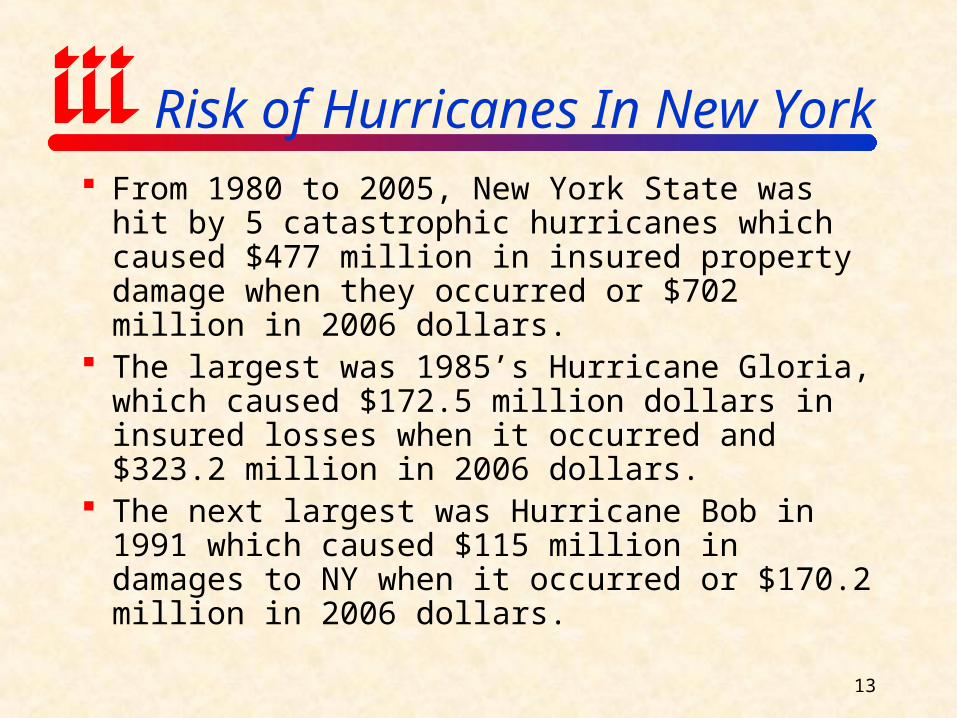
Risk of Hurricanes In New York From 1980 to 2005, New York State was hit by 5
catastrophic hurricanes which caused $477 million in insured property damage when they occurred or $702 million in 2006 dollars.
The largest was 1985’s Hurricane Gloria, which caused $172.5 million dollars in insured losses when it occurred and $323.2 million in 2006 dollars.
The next largest was Hurricane Bob in 1991 which caused $115 million in damages to NY when it occurred or $170.2 million in 2006 dollars.

14
Track of “Great New England Hurricane” of 1938
Source: WeatherUnderground.com, accessed February 4, 2006.
“Great New England Hurricane” of 1938 a.k.a.“Long Island
Express” caused severe damage through much of
the Northeast.
600+ Deaths
$308 million

15
Track of “Great New England Hurricane” of 1938
Source: WeatherUnderground.com, accessed February 4, 2006.
“Great New England Hurricane” of 1938 a.k.a.“Long Island
Express” caused severe damage through much of
the Northeast.
600+ Deaths
$308 million
16
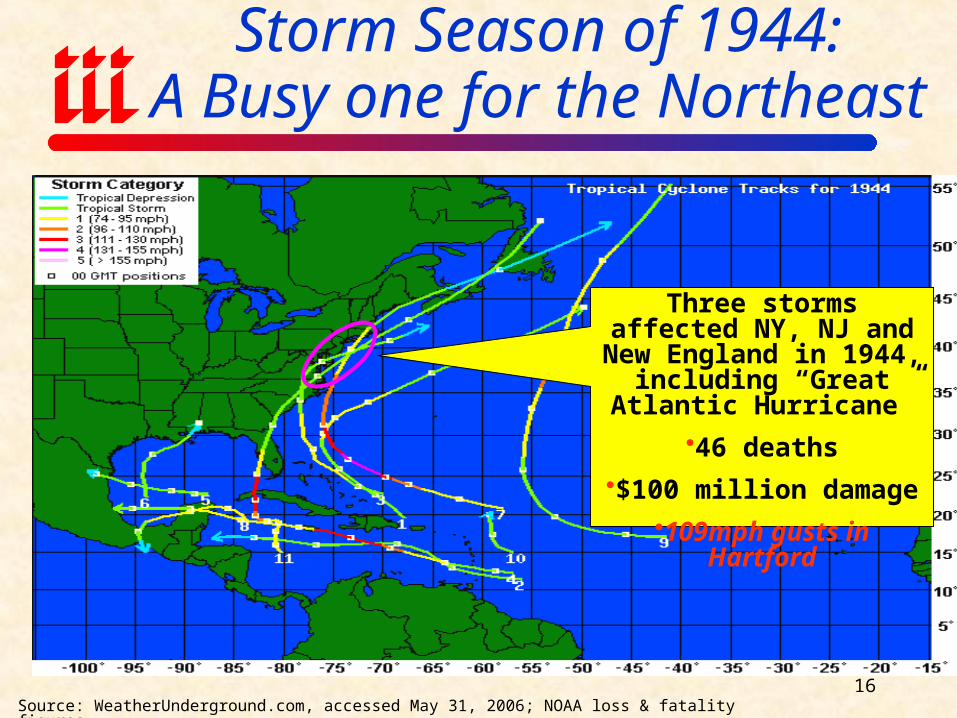
Storm Season of 1944:A Busy one for the Northeast
Three storms affected NY, NJ and New England in 1944, including “Great
Atlantic Hurricane”
46 deaths
$100 million damage
109mph gusts in Hartford
Source: WeatherUnderground.com, accessed May 31, 2006; NOAA loss & fatality figures.
17
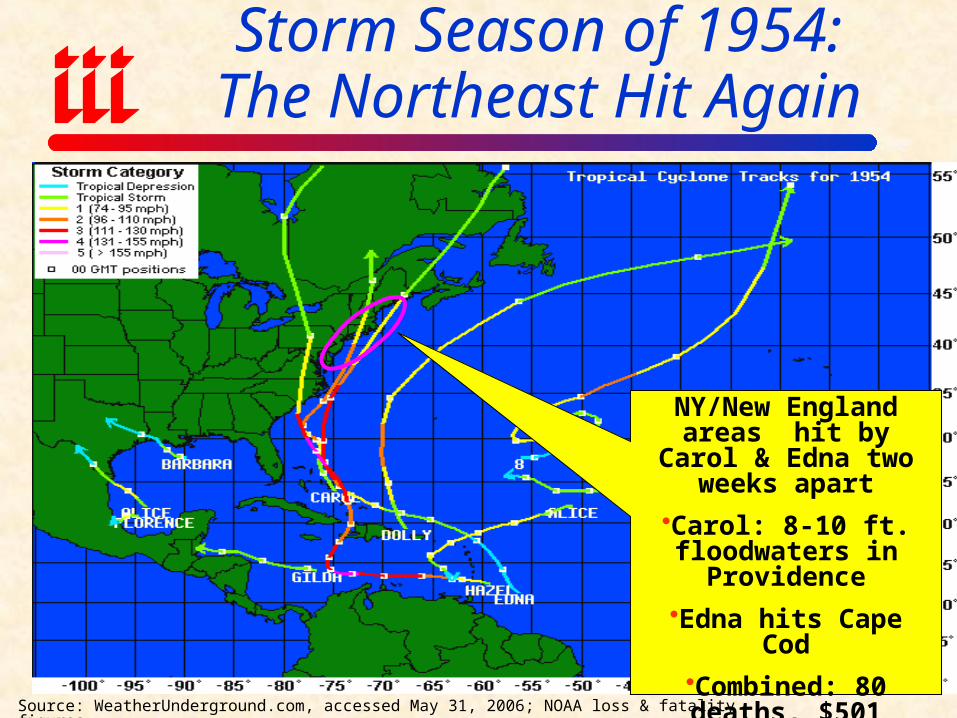
Storm Season of 1954:The Northeast Hit Again
NY/New England areas hit by Carol & Edna two
weeks apart
Carol: 8-10 ft. floodwaters in
Providence
Edna hits Cape Cod
Combined: 80 deaths, $501 million losses
Source: WeatherUnderground.com, accessed May 31, 2006; NOAA loss & fatality figures.

18
Storm Season of 1960:Brenda & Donna Came to Visit
NY/New England areas were hit twice in 1960.
Donna killed 50, $387 million damage along East Coast
Source: WeatherUnderground.com, accessed May 31, 2006; NOAA loss & fatality figures.
19
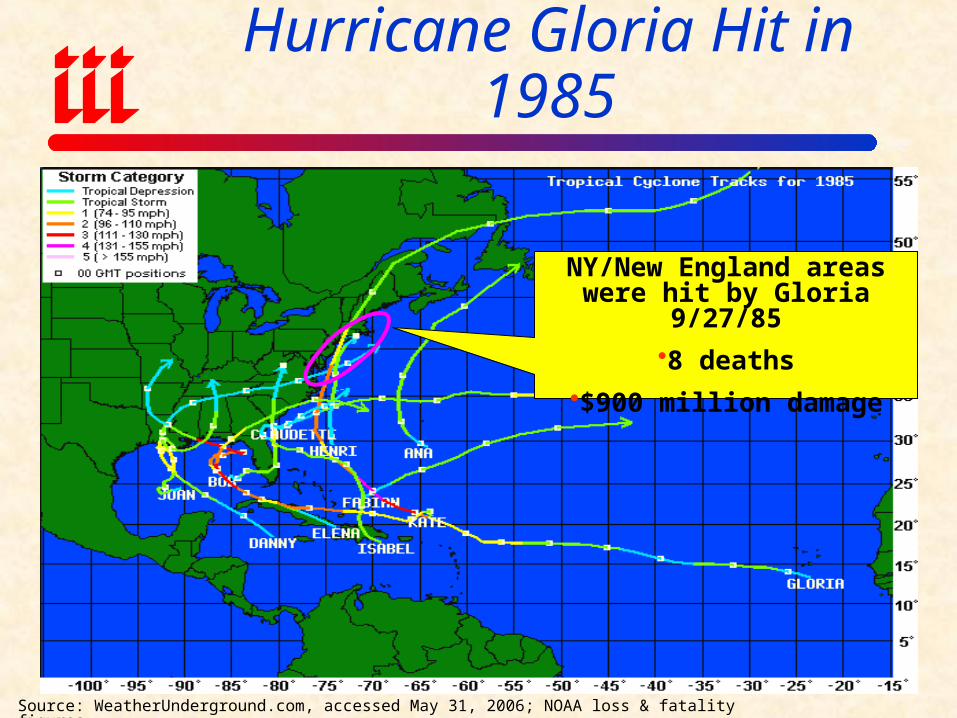
After a 25 Year Hiatus, Hurricane Gloria Hit in 1985
Source: WeatherUnderground.com, accessed May 31, 2006; NOAA loss & fatality figures.
NY/New England areas were hit by Gloria 9/27/85
8 deaths
$900 million damage
History of Disasters
Cost of insured Property in New York
21
Coastal Development
Between 1980 and 2003, the populations of coastal counties grew by 33 million people or 28 percent.
Exposure to windstorms and high property values combine to make Florida the state with the highest potential for losses and New York’s Long Island the second highest.

22
Value of Insured Residential Coastal Exposure (2004, $ Billions)
$512.1$306.6$302.2
$247.4$205.5
$88.0$65.1$64.5$60.0$60.0
$36.5$29.7$26.6$25.9$24.8$20.9
$5.4
$942.5
$0 $200 $400 $600 $800 $1,000
FloridaNew York
MassachusettsTexas
New JerseyConnecticut
LouisianaS. Carolina
MaineVirginia
North CarolinaAlabamaGeorgia
DelawareRhode Island
New HampshireMississippiMaryland
Source: AIR

23
Value of Insured Commercial Coastal Exposure (2004, $ Billions)
$994.8$437.8
$355.8$258.4
$199.4$121.3
$83.7$69.7
$52.6$45.3$43.3$39.4
$23.8$20.9$19.9$17.9$6.7
$1,389.6
$0 $200 $400 $600 $800 $1,000 $1,200 $1,400 $1,600
New YorkFlorida
TexasMassachusetts
New JerseyConnecticut
LouisianaS. Carolina
VirginiaMaine
North CarolinaGeorgia
AlabamaMississippi
New HampshireDelaware
Rhode IslandMaryland
Source: AIR

24
Total Value of Insured Coastal Exposure (2004, $ Billions)
$1,901.6$740.0
$662.4$505.8
$404.9$209.3
$148.8$129.7$117.2$105.3
$75.9$73.0
$46.4$45.6$44.7$43.8
$12.1
$1,937.3
$0 $500 $1,000 $1,500 $2,000 $2,500
FloridaNew York
TexasMassachusetts
New JerseyConnecticut
LouisianaS. Carolina
VirginiaMaine
North CarolinaAlabamaGeorgia
DelawareNew Hampshire
MississippiRhode Island
Maryland
Source: AIR Worldwide
Northeast states insured coastal exposure totals $3.73 trillion.
With $1,901.6 billion in exposure NY ranks 2th in US, 1nd in the
Northeast and in New England
25
Level of Preparedness In 2006, following a light hurricane season, the
I.I.I. commissioned a survey from Opinion Research Corporation and found that 25 percent of residents in the Northeast felt that their home was likely to be damaged by a hurricane.
In terms of preparedness, coastal residents from Maine to Texas on NOT prepared. Only 20 percent have taken measures to protect their homes from a natural disaster and only 14 percent reported that they had flood insurance.

26
27
Education: Key to Surviving a Hurricane
Key messages: It is not if a hurricane hits the Northeast, it
is when. Coastal residents and business owners who
prepare for a hurricane will be more likely to survive a disaster. This will result in less injuries, deaths and property damage.
28
Five Major Hurricane Preparedness Tips for Residents
1. Buy enough insurance
2. Get the right type of policy
3. Create a home inventory
4. Hurricane-Proof your home
5. Have a disaster recovery plan (that includes pets!)
**Plan ahead for a Catastrophe Deductible**
29
Hurricane Preparedness Tips for Businesses
1. Develop a Disaster Recovery Plan
2. Review your insurance plan before there is a disaster.
I.I.I. offers detailed steps for small business owners.

30

31

32

33
Version 3.0 just released
Handles larger files and images
Third-party secure online storage
Streamlined set-up process
34
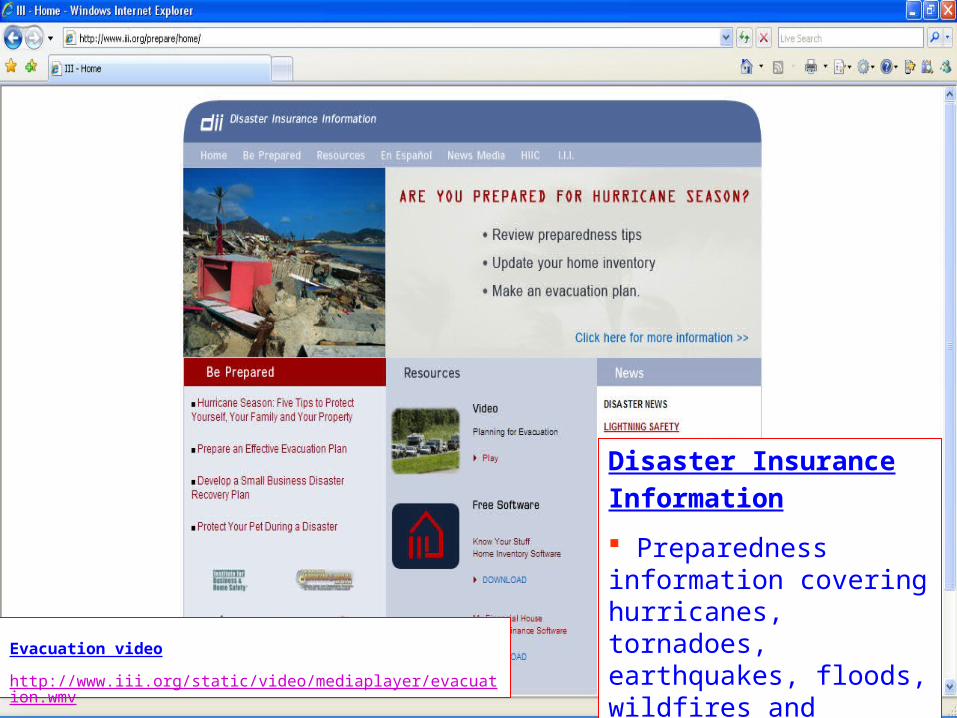
Disaster Insurance Information Preparedness information covering hurricanes, tornadoes, earthquakes, floods, wildfires and terrorism
Evacuation video http://www.iii.org/static/video/mediaplayer/evacuation.wmv