presentation to investors november ... - the navigator …
TRANSCRIPT

P r e s e n t a t i o n t o I n v e s t o r s
N o v e m b e r 2 0 2 0

This presentation is intended to provide a general overview of The Navigator Company S.A.’s business and does not purport to deal with all aspects and details regarding The Navigator Company S.A.. Accordingly, no representation, undertaking or warranty, expressed or implied, is given by The Navigator Company S.A. or any of its subsidiaries’ undertakings, affiliates, directors, officers, employees or advisors or any other person as to the fairness, accuracy, completeness or correctness of the information or opinions contained in this presentation or of the views given or implied or any other material discussion in connection with this presentation.
This presentation has been prepared by The Navigator Company S.A. for information purposes only. The Navigator Company S.A. or any of its affiliates, directors, officers, employees or advisers or any other person shall not have any liability whatsoever (including in case of omission, negligence or otherwise) for any losses, errors or omissions howsoever arising, directly or indirectly, from any use of this presentation or its contents or otherwise arising in connection therewith or with respect to their reliance upon the completeness and accuracy of any such information, as well as any damages resulting hereof.
DISCLAIMER
1

T A B L E O F C O N T E N T S
2
Solid & Resilient Business Model
Expansion & Diversification
01 02 03 04Sustainability at
the Core
Performance, Market Update
& Outlook
<<

3
NAVIGATOR IN BRIEF
A solid business model, with significant resilience in adverse market conditions
Expansion and diversification of business portfolio into the growing tissue segment, with other growth options available
Focused on efficiency and committed to additional cost reduction programs
Sustainability at the core – investing in people, aiming to be a leader in sustainability and delivering sustainable returns
Performance, Market update & Outlook
<<

THE NAVIGATOR COMPANY an integrated producer
R & D
F O R E S T
P U L PE N E R G Y
P A P E R
T I S S U E
130,000 ton Reels;120,000 ton Converting*
1.6 M tonof UWF paper
2.5 TWhof electricity
Leader in Eucalyptus globulus cloning
108,000 ha of forest(under management)
1.6 M ton of BEKP pulp(0.350 M market pulp)
4
(*total nominal capacity)
<<

NAVIGATOR IS THE LEADING MANUFACTURER of UWF paper in Europe
19%
16%
12%12%
10%
31%
Nº1 in European UWF fine paper by capacity, with the largest and most modern mills
European uncoated fine paper* Main players
Uncoated woodfree (UWF)European mills
Velsen-Noord
Stockstadt
Alizay
Hernani
Fabriano
Munkedal
Etival
Theresienthal
Nymolla
Figueira da Foz
Kymi
Others
Others
Kostrzyn**
Ruzomberok **
Veitsiluoto
Setúbal
Nordland
Kwidzyn**
Syktyvkar*
0 200 400 600 800 1000 1200 1400 1600
SAPPI
Crown Van Gelder
Zicuñaga
Clairefontaine
Fedrigoni
Double A
Arctic Paper
UPM
International Paper
Stora Enso
Mondi
Capacity, 1000 ton/year
Saillat Svetogorsk *
The Navigator Company
Mondi
IP
Stora Enso
UPM
Other
*Excluding value-added products (ex.: carbonless papers, termal papers,colorful papers, engineering papers, specialty papers, etc)
Integrated
Non Integrated
5
Kematen
5* Mill located in Russia; ** mill located in Poland and Slovakia
<<

BASED ON LARGE SCALE PRODUCTION MILLS with state-of-the-art technology
FIGUEIRA DA FOZ
• Pulp (Integrated) – 650,000 tAD
• Paper – 790,000 ton
The Navigator Company operates world class state-of-the-art-assets with a global capacity of:
1.6 Mtons of UWF - 1.6 Mtons of BEKP – 130 ktons of Tissue Reels
VILA VELHA DE RÓDÃO
• Tissue – 60,000 ton reels;65,000 ton converting
SETÚBAL
• Pulp (Integrated) – 550,000 tAD
• Paper – 775,000 ton
CACIA
• Pulp (Market) – 350,000 tAD
• Tissue – 70,000 ton reels; 55,000 ton converting*
6(*total nominal capacity)
<<

*Other includes forest **Revenues by geography of pulp, paper and tissue ***Includes all energy sales in Portugal
The Group exports around 83% of pulp, paper and tissue products
WITH A MORE DIVERSIFIED BUSINESS AND GLOBAL SALES TO 130 DIFFERENT COUNTRIES
Revenue diversification over the last 5 years with the entry into the tissue business and pulp debottlenecking, with a diversified customer base selling across 130 different countries
7
76% 71%
7% 10%
15%10%8%
2% 2%
2014 2019
Other
Tissue
Energy
Pulp
Paper
15% 19%
62% 50%
12%11%
11% 20%
2014 2019
Other
America
Rest ofEurope
Portugal***
Revenue by Geography**Revenue by business area
<<

78%Total Sales
1,2 MReams/day
WITH A DIFFERENTIATION STRATEGY based on the highest quality paper products and own brands
Product and brand differentiation strategy have skewed the Group’s product mix to the high end market, allowing up to 7% price premium advantage (in Europe)
2019 The Navigator Company
Europe industry average*
Premium products 52% 14%
Mill Brands 70% 20%
Sheets 75% 69%
Operating rates 100% 90%
* Estimated industry average including Navigator
Source: Euro-Graph; EMGE
8
Mill Brand Sales equivalent to:
930M€
<<

9
A STRONG POSITIONING IN UWF MARKET
The use of an excellent raw material such as the Eucaliptus Globulus fiber, modern and efficient plants and an experienced workforce – allows the production of high quality paper and the emphasis on premium
products
50-60%
30-45%
0-10%
10-15%
20-30%
60-70%
Premium
Standard
Economy
World Market (e) Navigator NVG market share in Western Europe
20%
22%
21%
13%
~50%
Total
Cut-size
Folio
Reels
Premium
<<

9%
50%
LEADING MARKET PLAYER IN UWF SEGMENT
10
For every 3 office paper reams exported from Europe
2 are made by Navigator
2%
52%
2% 4%2%
57%
14%
55%
3%
5%
North America
17%
Europe
Wes
tern Eastern
Middle East
Latin America
Africa World
UWFOffice Paper
Market Share
*) Market Share - indicates the Share of Navigator’s Sales per Consumption (Risi); Share of European Exports – indicates the share of Navigator’s Deliveries per European Deliveries (Euro-Graph).
NVG Market Share* Share of European Exports* (exc.RU)
60%16%
11%
8%5%
Paper Sales Distribution
Europe
Africa
Middle East
North America
Latin America
<<

ATF FIG
SET
300
350
400
450
500
550
600
650
700
750
800
850
900
0% 20% 40% 60% 80% 100%
€/ton
Capacity
AND WITH A VERY EFFICIENT CASH COST STRUCTURE
4Q 2019 UWF Cash costs, Europe, €/t
Navigator’s mills are very well positioned in the cash cost curve
Partial/Non Integrated
Changes in demand might accelerate closures from less efficient (and smaller) players and conversions to other types of products
NVG estimates that roughly:
• 2.5 M tons with cash costs above 550 €/ton (38% of European capacity*)
• During Q2 many paper machines reduced production and YTD August operating rates in the European industry stand at 75% (NVG OR- 80%)
*excluding Russia, UWF specialties papers and recycled grades
Source: Fast Markets RISI
11
Mills located in Russia and
Eastern Europe
<<

Source: Euro-Graph; EMGE; RISI 12
Evolution of UWF Europeanapparent consumption
8.7 8.7 8.7 8.1 8.2 8.2 8.1 7.7 7.5 7.5 7.5
7.2 7.6 7.3 7.0 7.0 7.0 6.9 6.7 6.6 6.4 6.1
2009 2010 2011 2012 2013 2014 2015 2016 2017 2018 2019
Capacity Apparent consumption
Mill
ion
of t
ons
Evolution of UWF USAapparent consumption
10.8 10.0 9.8 9.4 9.1 8.1 8.0 7.9 7.8 7.4 6.89.2 9.1 8.7 8.2 8.2 7.8 7.8 7.5 7.0 7.0 6.5
2009 2010 2011 2012 2013 2014 2015 2016 2017 2018 2019
Capacity Apparent consumption
Mill
ion
of t
ons
PRODUCING ONE OF THE BEST PERFORMING GRADES IN PRINTING AND WRITING: UWF
2009-2019:Change in capacity of -1.2 MtonsChange in demand of -1.1 MtonsAverage operating rate of 90%
2009-2019:Change in capacity of -4 Mtons
Change in demand of -2.7 MtonsAverage operating rate of 90%
In the last 10 years, UWF capacity has been adjusting to the reduction in consumption

UWF resilience comes from its:
Universality: available for purchase by many
different customer segments, from both B2B
and B2C
Versatility: end use options are wide
13
Uncoated
Woodfree Mechanical
CoatedHigh-end magazines &
Communication materials(flyers, brochures, posters…)
UncoatedTrade books, directories
CoatedMagazines &
communication materials
Printing & Writing
Graphic Papers
UWF IS LESS EXPOSED TO DIGITALIZATIONThere are different grades to different uses and UWF is less dependent on media and advertising
<<

ECONOMICAL SOCIAL / CULTURAL
PAPER ROLES PAPER APPLICATIONS
Demand Drivers
Emp. in Services (esp. Knowledge sector)
Population growthEducation attainmentAgeingPublicity spending
EducationScience ProductionIndustrial ActivityReading habitsInformation SocietyContent CreationPlastic PhobiaDigital Fatigue
To Think
To Present
External CommunicationsLetter & AgreementsDirect MailBooksPackagingPaper to writeDraw & create
GDP, ExRate, Public Finances, (Un)Employment, Inflation, Credit Coverage, Political Stability,Social Tensions
ECONOMICAL/POLITICAL
To Protect - Storage /
Archival
+ Packaging/ Envelope for Direct Marketing/Tags /Bags /Cards + etc.
Source: NVG
UWF is Universal (everywhere to everybody) and Versatile (addressing multiple applications)
14
UWF MARKET DEMAND DRIVERS <<

0
5
10
15
20
25
30
2000 2001 2002 2003 2004 2005 2006 2007 2008 2009 2010 2011 2012 2013 2014 2015 2016 2017 2018 2019
M tAD
China BEKP (% of World)4%
12%
20%
30%
41%
China SW (% of World)
7%
35%
Source: PPPC; NVG *Other include Hardwood other than BEKP, UKP and Sulphite.
13% 21%30%
PULP DEMANDMarket Pulp by main grade
15
ChinaM tAD 2000 2019 L5Y (Mt/y)SW 1.4 9.1 0.5
BEK 0.3 10.3 0.9
Other 0.7 4.5 0.3
Total 2.4 24.0 1.6
WorldM tAD 2000 2019SW 18.9 26.4
BEK 6.6 25.5
Other 13.1 12.5
Total 38.6 64.3
<<

16
Pulp Sales300 - 400
ktons
Market ShareWorld Europe
1.2% 2.7%
BEKP
Focus on Value Added Segments in Europe
Decor & Specialities allows for a 5-6% price premium over other segments:
32% 73%Of total demand in Europe* In NVG mix**
6.1% MS in Europe
Decor & Specialities
6%
21%
73%
0%
Fine Papers
Decor & Spec
32%23%
41%
4%
Tissue Fine Papers
Decor & Spec
Others Tissue Others
Indu
stry
Navigator
European leader in BEKP production
Source: NVG; PPPC; RISI * Euca Demand by End-Use in Europe in 2019 (PPPC) ** NVG sales 2019 in Europe
PULP NAVIGATOR POSITIONING <<

UWF PAPER VS PULP: REDUCED VOLATILITY & MORE STABLE RETURNS
Index FOEX PIX (Europe) – Gross Prices
A4 – B Copy: index for uncoated woodfree paper (80 g/m2)
BHKP: index for bleached hardwood kraft pulp (eucalyptus or birch)17
EUROPEAN MARKET PAPER PRICE – A4 B-COPY AND BHKP (IN €)
500
550
600
650
700
750
800
850
900
950
1000
1 9 17 25 33 41 49 4 12 20 28 36 44 52 8 16 24 32 40 48 4 12 20 28 36 44 52 8 16 24 32 40 48 4 12 20 28 36 44 52
Eur
/Ton
Week
A4 B-copy BHKP
2015 2019 20202016 2017 2018

18
Navigator has been permanently focus on optimizing its production processes and its cost reduction initiatives
Cost optimization and operational efficiency plan implemented at the start of 2020:
Bringing together the existing M2 and Corporate ZBB programs Launching a Digital Transformation project in the corporate sector
Covid-19 pandemic compelled a reassessment and extension of the scope and depth of the cost reduction initiatives originally envisaged
Target for 2020 to reduce fixed costs by € 46 million
€ 30 million achieved already in 9M 2020
FOCUS ON COST EFFICIENCY <<

T A B L E O F C O N T E N T S
19
Solid & Resilient Business Model
Expansion & Diversification
01 02 03 04Sustainability at
the Core
Performance, Market Update
& Outlook
<<

20
€131 M
ORGANIC DEVELOPMENT AND DIVERSIFICATION IN THE LAST GROWTH CYCLE
25 36 4387
143127 93 72
129 15
2015 2016 2017 2018 2019
Capex (M€)
GrowthCycle
CurrentBusiness
€158 M€152 M
€129 M
€115 M
€216 M
Tissue: 190 M€
Pellets: 115 M€
Pulp expansion:
125 M€
Heavyweights: 12 M€
Growth cycle included:
• From 2015 until 2018, Capex included essentially growth projects that have allowed NVG to diversify its business
• In 2019, capex included mainly maintenance /efficiency, regulatory/environment (~33 M€ for environment) and completion of expansion projects
• In light of the Covid-19 the capex plan for 2020 was significantly revised downward from 158 M€ to circa 90 M€; 2020 plan will include mainly maintenance /efficiency and regulatory/environment (80% of investment spending in 2020 is related to maintenance and projects that started in previous years)
<<

Diversification of The Navigator Company’s
portfolio(Representing currently 10% of
Navigator’s sales, tissue business is an important
growth platform option for the future)
Synergies with our core business
(raw material Eucalyptus globulus)
Ability to develop a competitive advantage with pulp integration
(cost and quality advantage)
State-of-the-art technological
solution
(The Navigator Company’s DNA)
After entering the tissue business in 2015, Navigator doubled its capacity in 2018, with the construction of a new 70 Ktons integrated machine in Aveiro.The growth in the tissue business has a strong strategic rational:
21
GROWTH IN THE TISSUE BUSINESS <<
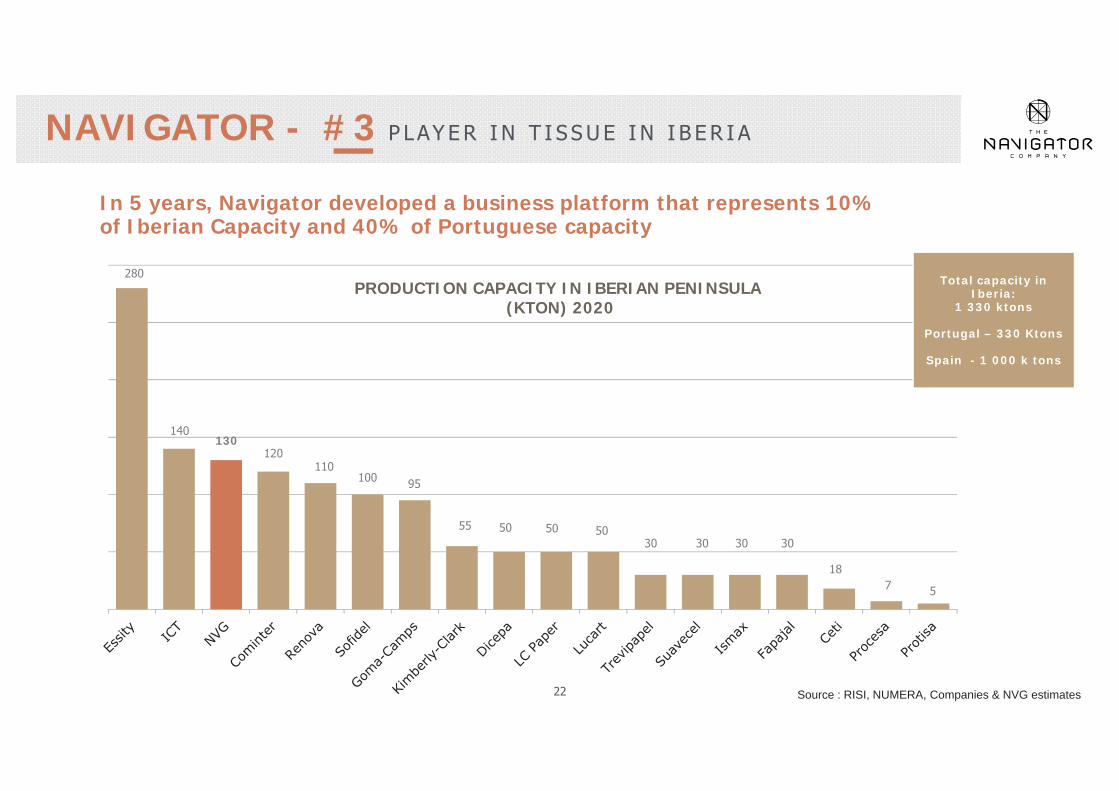
NAVIGATOR - #3 P LAY E R I N T I S S U E I N I B E R I A
PRODUCTION CAPACITY IN IBERIAN PENINSULA (KTON) 2020
22
280
140130
120110
100 95
55
718
30303030505050
5
Source : RISI, NUMERA, Companies & NVG estimates
Total capacity in Iberia:
1 330 ktons
Portugal – 330 Ktons
Spain - 1 000 k tons
In 5 years, Navigator developed a business platform that represents 10% of Iberian Capacity and 40% of Portuguese capacity
<<

Growth opportunity driven by increased demand in Asia and worldwide supply limitations
Attractive fundamentals of Mozambique:• High Forest productivity • Proximity to Asia• Land available at competitive costs
Geographic diversification within the core business of The Navigator Company
23
MOZAMBIQUE PROJECT
P h a s e 1 :W o o d c h i p M i l l
Project Phases Strategic Rationale
P h a s e 2 :P u l p M i l l
Investment: USD 260 M(USD 100 M already invested)
40 000 ha planted area
Investment: USD 2.5 B
8000 jobs opportunities
<<

MOZAMBIQUE PROJECT UPDATE
• Navigator has been working with the Mozambique Government under the terms of the MoU signed in 2018, in particular on infrastructures and logistics and land and development issues.
• This has included the first Outgrower Support program in Mozambique, a government initiative funded by the World Bank, with the aim to promote small and medium scale sustainable commercial private forestry plantations, and restoration of degraded areas. In the first 2019-2020 season, plantations were established over an area of approximately 550 hectares and 1200 hectares are estimated for the next season 2020-2021.
• Portucel Moçambique (PM) played an active role providing wide-range support by designing the silviculture model, supplying clonal plants and offering access to fertilizers. When the plantations are ready for harvest, PM will have first option on purchase of the wood.
• The Government of Mozambique referred the strategic importance to the country and to the Zambéziaprovince of building the port of Macuse, in order to develop commercial farming and forestry.
24
<<

FOCUSED ON BUILDING THE FUTURE BIO-ECONOMY
RAIZ & Inpactusproject
Plantation trees Forestry residues
Biorefinery
Biomass deconstruction & separation
processes
1 ton wood Pulp
Fibers
Chemicals & energy recovery
(combustion)Pulping By-products
Biomass components
Paper
Tissue
Market pulp
Heat and electricity
BiochemicalsBioproductsBiomaterials
Examples of possible bioproducts from biorefinery
Essential oils
Sugars for bioethanol and bioplastics
Thermoplastic bio composites
Lignin-based foams for thermo insulation
Bacterial cellulose for biomedical applications
Nanocellulose for paper coating and food additives
25

CREATING INNOVATIVE PRODUCTS & TECHNOLOGIES
A co-promotion R&D project between industry and academia.A step forward to a green, global, sustainable and competitive bioeconomic environment in Portugal, based on eucalyptus pulp and paper industry!
RAIZ & Inpactus project
180Researchers/Technicians
50Research grants
2Invited chairs
15.3M€Total budget
26

T A B L E O F C O N T E N T S
27
Solid & Resilient Business Model
Expansion & Diversification
01 02 03 04Sustainability at
the Core
Performance, Market Update
& Outlook
<<

SUSTAINABILITY AGENDA
Navigator’s sustainability goals for 2020-25 (based on materiality assessment):
• Sustainable forest management
• Energy and climate
• Industrial environmental management
• Talent Management and development of
human capital
• Occupational health and safety
• Sustainable supplier Management
• Customer satisfaction
• Community engagement
• Innovation, Research & Development
28
“It´s thinking about people, their quality of life and the future of the planet that inspires and motivates us. We want to share the wealth we create, but also our knowledge, our experience and our resources, all in the name of a better future.
That is why we are committed to creating sustainable value for our shareholders, and for society as a whole, leaving a better planet for future generations, through natural products that are sustainable, recyclable and biodegradable, that help to capture carbon and produce oxygen, that protect biodiversity, improve the soil and
combat climate change.”
<<

Forest
• ≥ 75% national certified wood by 2025
• ≤ 1% of burned area
Industrial Operations
• 87% of waste recovery by 2025
• 15% reduction in specific water consumption
Community engagement (Mozambique
Project)
• Inclusive business model with the local communities
• Investment in infrastructures
Talent• Develop H.Resources
with skills needed to pursue Company Strategy: 75% of critical areas covered by internal trainees
• Internal succession: target to achieve 75% of succession places filled by 2025
Climate
• Carbon Neutral Mills by 2035
• 85% of Renewable energy by 2035
• over 10% reduction of specific energy consumption
29
MAIN SUSTAINABILITY GOALS FOR 2020-25 <<

AT THE HEART OF WHAT WE DO IS THE FOREST, a natural and renewable resource
5.3 Million t CO2 eq
12 MillionPlants produced at Portuguese
Nurseries
108.269ha
Forest under management in Portugal
Million3.3 Investment in protection
against forest fires
RAIZForest and Paper Research Institute
Improve foresty management
Increase eucalyptus Yields
30
234Species of Fauna
740Species of Flora

ADDRESSING CLIMATE CHANGE BY BECOMING ACARBON NEUTRAL COMPANY
The Navigator Company is committed to achieve Carbon Neutrality at its industrial sites by 2035,15 years ahead of schedule, by investing € 154 million in the implementation of changes in its production processes in order to minimize the use of fossil fuels
GOAL 1100% of electrical energy production from renewable sources
GOAL 2Reduce fossil fuelCO2 emissions with implementation of cleaner technologies
GOAL 3Reduction of 10% of the specific energy consumption from 2015 until 2025
GOAL 4Carbon offsettingfor unavoidablecarbon emissions
31

ROADMAP TO CARBON NEUTRALITY BY 2035
86% reduction of CO2 emissions, approximately 667 ktCO2/ from 2018 until 2035, with an investment of 154 million €
CO2 Expected Emissions
774 744 730
512 512 488 460 455378 350 350 308
107
2018 2019 2020 2021 2022 2023 2024 2025 2026 2027 2028 2029 2035
CAPEXIn Million €
8
1928
1220 17
4 5 813
19
1
2018 2019 2020 2021 2022 2023 2024 2025 2026 2027 2028 2029 2035
Reduction of
667kton CO2
CAPEX
154M€
Ktons86%
32
<<

33
Navigator is already the biggest national producer of renewable energy through biomass and subproducts of wood, representing up to 60% of the Group´s total energy capacity
The new biomass boiler will increase significantly the capacity production based on renewable resources (from 60% to 70%)
Installed capacity
2,5 TWh/Year(enough to supply the entire region of the
Algarve for a year ).
3 Biomass cogeneration
plants
+2 Natural Gas cogeneration
plants
+2 Biomass plants
~5%Of the National electricity
production
(produce exclusively electricity to the
portuguese network)
=
NEW BIOMASS BOILER AT F.FOZ
Biomass Boiler – Capex of € 55 million
Steam generation capacity of 128 MWth, to supply paper machines 1 and 2
Project is being finalized and testing began at the end of Q3; ramp-up will last from Q4 2020 and Q2 2021
Reduction of CO2 emissions by 20% for Navigator as a whole (reduction of 155 ktons of CO2/year). F.Foz mill steam an electricity generation will be 100% from renewable
Expected significant savings in costs (reduction in purchase of natural gas and maintenance costs)*
Total Capex of € 55 million
* 2018 Feasability study estimated €14 million savings / year; depends on natural gas prices
<<

ENERGY – SOLAR PHOTOVOLTAIC
RAIZ Institute (2019)342 solar panels
94 kW of installed capacity(satisfies 30-35% of the institute’s
consumption).
The energy generation through renewable energy sources constitutes one of the company’s strategic axis, this is shown through relevant investments in solar plants in self consumption regime.
Navigator Paper Setúbal (2016)8 800 solar panels
2.2 MW of installed capacity(the biggest solar photovoltaic plant installed in
industrial environment in Portugal, enough to supply 850 households for a year).
1 140 t CO2 emissions/year avoided
Herdade de Espirra (2018)352 solar panels
112.6 kW installed capacity(supplies ~30% of the consumption
of the Herdade de Espirra).
U P C O M I N G P R O J E C T S ( 2 0 2 2 )• Navigator Pulp Setúbal: 4 680 solar panels
(installed capacity 1.8 MW);
• PM2 Figueira da Foz: 7 700 solar panels (installed capacity 2.7 MW).
34
<<

80%Waste
Recovery Rate
90%Renewable
raw materials
Solar power plant 3,1 GWh/year
Saving1.140 t CO2 /year
80% of water intake is returned to
the environment
64%of paper is sold with FSC*, PEFC or Ecobel
seals of approval
More than
67%Primary energy used
from renewable sources (biomass)
I N D U S T R I A L O P E R A T I O N S
Fiber optimization
Bioproducts and biofuels research
*pulp and paper
35
<<

Mozambique project
36
$6 Million invested
In the Community Development
Program
250 employees90% Mozambicans
30% women
Increasing household
income And decreasing the poverty rate in the
provinces of Zambezia& Manica
5300 km of new roads and
rural pathsAllowing better access to public transportation, to healthcare & to markets
Securing families welfare
Delivering food security and
generating income to 7.000 families
24 new water boreholes
Making potable water available to communities
2300 families received solar lamps
Can also be used to charge devices and allows children to study after sunset
I M P A C T O F S O C I A L P R O G R A M *
* Reference to the end of 2019
<<

INVESTING IN PEOPLE & TALENT MANAGEMENT
37
G E N D E R D I V E R S I TY
G E N D E R D I V E R S I TY 3280
Employees in 2019
W O R K F O R C E R E J U V E N AT I O N
( 2 0 1 3 - 2 0 1 9 )
W O R K F O R C E R E J U V E N AT I O N
( 2 0 1 3 - 2 0 1 9 )
T R A I N I N G&
L E A R N I N G C E N T E R
T R A I N I N G&
L E A R N I N G C E N T E R
Middle and Senior management
70% - Male 30% - Female
Training Hours: 182,740h59h/ Employee
Management Courses: 117 courses/300 hours
Internal Training: 200 courses/165 hours
Average reduction of 6.5 years
Distribution by age:11% < 30 years
56% between 30 – 50 years33% > 50 years
Headcount 3280*
Setúbal1,157
Figueira da Foz1,008
Aveiro503
Vila Velha de Ródão226Portucel
Mozambique157Others
locations in Portugal
146
International sales offices
83
* Dec.2019
<<

ENGAGING WITH STAKEHOLDERS
Main forest certification schemes
Currently Vice-President of PEFC Portugal
38
WWF lead initiative to share knowledge about well-managed plantations and learn from others' good examples with top P&P companies and Governments
SteerCo member of this Yale University based initiative focusing on forests and their role in promoting improving the livelihoods of local communities
Members and part of the WBCSD’s ExCoForest Solutions Group – core members
C o r p o r a t e i n i t i a t i v e s t o d r i v e S u s t a i n a b l e D e v e l o p m e n t
M u l t i s t a k e h o l d e r i n i t i a t i v e s
Engaging in projects to debate SDG implementation, the Future ofWork, Human Rights, Circular Bio-Economy and a Vision for 2050
Presidency of BCSD Portugal, anaffiliate of WBCSD
<<

T A B L E O F C O N T E N T S
39
Solid & Resilient Business Model
Expansion & Diversification
01 02 03 04Sustainability at
the Core
Performance, Market Update
& Outlook
<<

40
FINANCIAL INDICATORS
2 0 1 5 2 0 1 6 2 0 1 7 2 0 1 8 2 0 1 9Million euros
Turnover 1,628 1,577 1,637 1,692 1,688
EBITDA 390 397 404 455 372
EBITDA/Sales (%) 24% 25% 25% 27% 22%
CAPEX 148 139 115 216 158
Free Cash Flow 81 184 198 211 186
Net Debt 655 640 692 683 715
Net debt/EBITDA 1.68 1.61 1.72 1.50 1.92
ROCE 16% 12% 14% 16% 13%
ROE 15% 18% 17% 19% 15%
<<

41
MAIN FINANCIAL AND OPERATIONAL HIGHLIGHTS
1,542
1,628
1,577
1,637
1,692 1,688
2014 2015 2016 2017 2018 2019
Turnover (M €)
328390 397 404
455
372
2014 2015 2016 2017 2018 2019
EBITDA (M €)
292 304
385 357 377307
2014 2015 2016 2017 2018 2019
Operational Cash Flow (M €)
1,564 1,555 1,587 1,5781,513
1,447
2014 2015 2016 2017 2018 2019
Paper sales (ktons)
257 253291 311
253314
2014 2015 2016 2017 2018 2019
Pulp sales (ktons)
37 3951 55 63
96
2014 2015 2016 2017 2018 2019
Tissue sales (ktons)
<<

24%
14% 18
%
13%
13% 16
%
25%
12%
15%
16%
14% 15
%
24,7
%
11%
17%
16%
16%
16%
27%
13%
18%
17,4
%
18% 20
%22%
10%
17%
18%
15%
15%
The NavigatorCompany
Competitor 1 Competitor 2 Competitor 3 Competitor 4 Competitor 5
2015 2016 2017 2018 2019
VERY FAVOURABLE COMPARISON WITH PEERS
Source:Euro-Graph; EMGE* Average does not include Navigator
EBITDA Margin - Paper Peers (2015-2019) Average for 2015-2019*: 15%
42
<<
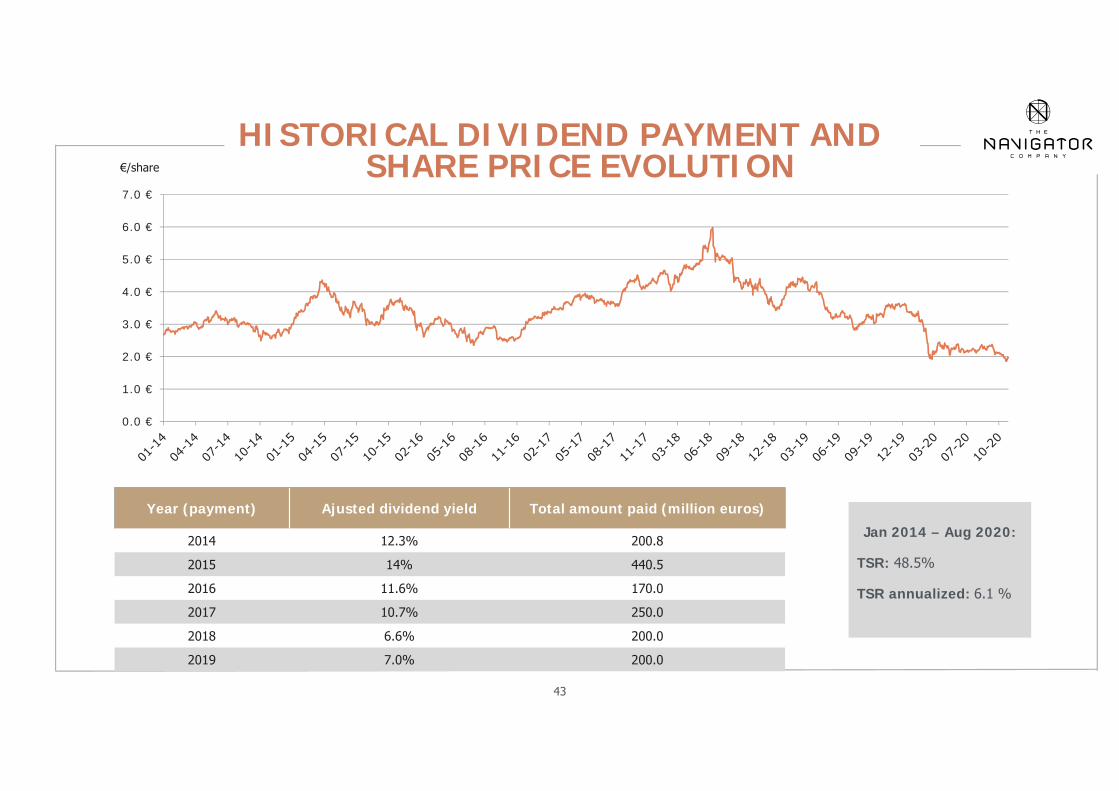
HISTORICAL DIVIDEND PAYMENT AND SHARE PRICE EVOLUTION
Year (payment) Ajusted dividend yield Total amount paid (million euros)
2014 12.3% 200.8
2015 14% 440.5
2016 11.6% 170.0
2017 10.7% 250.0
2018 6.6% 200.0
2019 7.0% 200.0
43
Jan 2014 – Aug 2020:
TSR: 48.5%
TSR annualized: 6.1 %
€/share
0.0 €
1.0 €
2.0 €
3.0 €
4.0 €
5.0 €
6.0 €
7.0 €
<<

1Protect the
core business
2 Consolidate and clarify the options of organic
growth
3Reinforce the
focus on efficiency and
cost management
4 Continue to
invest on our people as a
key asset for the future
5 Align the
company’s external
positioning with the core
priorities
Financial Goal: Preserve company’s value, operating under the norms of shareholder’s remuneration.
MANAGEMENT PRIORITIES
44
<<

45
• Gradual reopening of economies and progressive recovery of paper demand during Q3
• Navigator registered significant improvement in paper volumes, with all its paper machines working at full capacity since July
• Strong operating performance in pulp and tissue continued during Q3, even though pulp prices remained under pressure
• Continuous focus on cost reduction and efficiency improvements allowed a 36% growth in EBITDA vs Q2 2020, to € 70 million and a margin of EBITDA / Sales above 20%
• Navigator maintains a strong ability to generate cash flow: € 56 million FCF achieved in the Quarter, totaling € 170 million YTD September
• Continuous reduction in Net Debt, with Net Debt / EBITDA at comfortable levels; successful renegotiation of debt maturing in 2021
• Q3 performance reflects the resilience of Navigator´s business model
Q3 2020 PERFORMANCE OVERVIEW
<<

46
Performance in 2020 was negatively impacted by a severe decline in consumption of UWF across the world due to the Covid-19 pandemic and the general lockdowns of economies
Turnover in the first 9 months declined 18% YoY on the back of decreased paper volumes and lower pulp and paper prices
Increase in pulp and tissue volume and significant improvement in production costs (variable & fixed) mitigated sales and price drops
EBITDA reached € 210 million with a margin EBITDA / Sales above 20%
Significant free cash flow generation of €170 million sustained by efficient working capital management and reduced capex disbursements
Strong balance sheet, with Net Debt reducing by € 132 million YoY to € 644 million; 100 M€in reserves paid to shareholders in January
9M 2020 Financial Highl ights
In millions € 9M2020
9M2019
ChangeQ1-Q319/20
Q32020
Q22020
Change QoQ
Turnover 1.044 1.274 -18% 348 290 +20%
EBITDA 210 300 -30% 70 52 +36%
EBITDA /Sales 20.2% 23.6% -3.4pp 20.2% 17.8% + 2.4pp
CAPEX* 70 119 -49 21 26 -5
Free Cash Flow 170 125 +50 56 99 -43
Net Debt 644 776 -132 644 700 -56
Net Debt/EBITDA 2.28 1.87 0.41 2.28 2.29 - 0.01
* Capex cash out was 43M€
<<

Source: FOEX
EUROPEAN MARKET PAPER PRICE – A4 B-COPY AND BHKP (IN €)
47
PULP & PAPER PRICES IN 9M 2020 <<
Average A4 B-Copy price
2014-18 2019 Q1-Q3 2020
EUR 832 903 846
500
550
600
650
700
750
800
850
900
950
1000
1 9 17 25 33 41 49 4 12 20 28 36 44 52 8 16 24 32 40 48 4 12 20 28 36 44 52 8 16 24 32 40 48 4 12 20 28 36 44 52
Eur
/Ton
Week
A4 B-copy BHKP
2015 2019 20202016 2017 2018
With market discounts increasing, net pulp prices are currently at the lowest level since the begining of 2000 (and 2009); the recent devaluation of the USD vs the Euro impacted significantly European pulp producers margins.
Paper prices reflect current market conditions and declined 7% YoY
Average Pulp prices
2014-18 2019 Q1-Q3 2020
USD 817 855 680
EUR 701 762 606

48
NAVIGATOR PAPER & PULP PERFORMANCE9M 2020
PAPER PERFORMANCE
• UWF sales volume increased 45% QoQ to 366 ktons, with strong performance in Europe; YTD Sep. volumesdeclined 13.8% YoY to 933 ktons;
• Average selling price in Europe for Cut-Size evolved in line with the PIX Index, but average selling price wasnegatively impacted by lower prices in overseas markets, product mix and exchange rate;
• Paper turnover stood at € 238 million in Q3 (+36% vs Q2) and at € 706 million in the first 9M (-22% YoY);
• Order book recovered in September to 26 days, close to normal levels for this period, and 19% higher thancompetitors;
• Increase in market share among European producers of 2 p.p. vs 2019 both in European and export markets;
• NVG inventories reduced significantly at the end of September and were in line with 2019 level, representing almosthalf of European competitors inventories. Stocks in the pipeline are believed to be below normal.
PULP PERFORMANCE
• Sales volume totaled 297 Ktons in 9M 2020, recording the highest volume sold since 2010, increasing 39% vs 9M2019; Sales turnover was € 117.5 million in 9M2020, falling 3.2% YoY, negatively impacted by decline in pulp price;
• Increase in volume was sustained by higher availability of pulp (in Q2) and by sales diversification into othergeographies, taking advantage of market opportunities in tissue and packaging, as well as inventory optimizaton.
<<

49
• Sales turnover increased to € 106.7 million, representing a growth of 5% YoY and 6% in Q3 2020 vs Q2 2020, (+1% vs Q3 2019)
• Global volume of tissue sold increased to 79 kton (+7% YoY), sustained by strong sales in finished products, whichled to an improvement in product mix: 77% of finished products in 2020 vs 75% in 2019
• Good industrial performance of both Aveiro and Vila Velha Rodão mills and improvement in fixed costs
44% Consumer (At-Home)(vs 35% 9M2019)
40% Away-from-Home +C&C(vs.40% 9M2019)
16% Parent Reels(vs.25% 9M2019)
42% Portugal (vs. 37%)
34% Spain(vs.28%)
24% Extra-Iberia(vs.35%)
Revenue by segment
(9M 2020)
Revenue by geography
(9M 2020)
<<RECORD PERFORMANCE IN TISSUEIncreased weight of Consumer Products

50
CONTINUING TO GENERATE STRONG FREE CASH FLOW
Strong generation of Free Cash Flow was maintained throughout Q3 (+56 M€) totaling € 170 million YTD September, comparing favorably with FCF of € 125.4 million in 9M2019; efficient management of working capital, with both strong cash conversion of clients receivables and
careful management of suppliers, with recourse to financial solutions to support their liquidity
M €
<<
186.1170.4
6.57.7
16.7
23.7
Operating Cash Flow
CAPEX Inventories SuppliersClients State & Public
Entities
Other Free Cash Flow R20
-69,7
-0,6
-15,7(-8%)

Current Average Cost of Debt
51
Debt Rate Profile
Fixed Variable
71% 29%
Short term liquidity increased to 345 M€ at the end of SeptemberDuring Q3, NVG has already refinanced 80% of its long-term financial debt
maturing in 2021
Debt maturity profileTotal debt: € 1,225 million
Average maturity: 2.9 years
27
292
54
430
107 83
254
2020 2021 2022 2023 2024 2025 2026-2028
<<Conservative Debt Profile

52
SuppliersBalance mill’s needs while securing suppliers’ activities
Improve working capital while supporting suppliers through financial instruments
LiquidityIncrease immediate cash liquidity and preserve Company´s financial strength:
Short term liquidity increased to € 345 million + € 95 million of unused available lines
Successful renegotiation of 80% of debt maturing in 2021
Capex Significant capital expenditure revision:
Capex for 2020 revised downwards to € 55 million (cash outflow perspective)
Total capex YTD Sept. €70 million; total capex forecasted for FY of € 90 million
Efficiency and cost reduction programmesStrong commitment to reduce costs:
€ 30 million reduction achieved in fixed costs YTD September
Improvement in variable production costs of € 44 million, related to price renegotiations and reduction in specific consumption
Responsive measures taken to secure business well being
Positive results from measures undertaken in response to Covid-19
<<

PULP PAPER• Supply may be impacted by
production and maintenance stoppages planned for Q4 in total estimated at 420 ktons (NVG will also have pulp maintenance in Q4)
• Prices remain at historical low levels and recent price increases were announced in Harwood for beginning of November in China and Europe by several Latin American producers
TISSUE• Navigator expects to maintain
a healthy level of industrial performance and to continue to deliver volumes in line with previous quarters
• Annual maintenance stoppage planned for Q4 in Aveiro
53
• Stocks among European distributors are estimated to be balanced or even low, and order book in Europe in the first weeks of October showed positive signs;
• Navigator ended Q3 with low stocks and healthy order book, well positioned to take advantage of improvement in demand expected for Q4
• Maintenance stoppage expected for Q4 in Setúbal Paper mill
OUTLOOK FOR Q4 2020 <<
Recovery of UWF business in Q4 expected to continue, albeit depending on the evolution of the pandemic situation and any further measures restricting economic activity
Navigator will continue with its strong commercial effort, cost efficiency programs and effective management of liquidity; with a geographically diversified business, NVG´s UWF product mix continues to present a strong versatility and higher resilience when compared to other P&W grades

P r e s e n t a t i o n t o I n v e s t o r s
N o v e m b e r 2 0 2 0