presentation to the hawaii state transit oriented ... · presentation to the hawaii state transit...
TRANSCRIPT

April 4, 2017
Presented By:
Ken K. Hira
EVP Kosmont CompaniesICSC WESTERN DIVISION P3 RETAIL CHAIR
1230 Rosecrans Ave., Suite 630
Manhattan Beach, CA 90266
(949) 226-0288 [email protected]
www.kosmont.com
Presentation to the
Hawaii State Transit Oriented
Development Council

Who is Kosmont Companies?
2
Nationally-recognized real estate & economics advisory firm specializing in public-
private transactions for 30 years.
• Offers a full range of economics & real estate advisory services including:
– Market, Fiscal and Feasibility Analyses
– Economic Development Strategies & Implementation
– Identification of Funding Sources & Financing Strategies
– Retailer/Developer Recruitment through #KosmontRetailNOW! ® platform
• Winning track record of initiating and implementing projects for municipalities
– In-house team includes registered municipal advisors, financial analysts,
lawyers, former bond underwriters, former city managers & department heads
– Extensive network of brokers, investors and market data for real-time
information, and retail industry leadership
• Kosmont is not just a “study” company – we create strategies & make projects
a reality
– Over $12 billion in project negotiation and implementation since 1986 and
hundreds of public private transactions

Outline
3
• Demographic Profile
• Retail Trends & Blended Use
• Next-Gen Economic Development:
The California Story
• Case Studies
• Summary
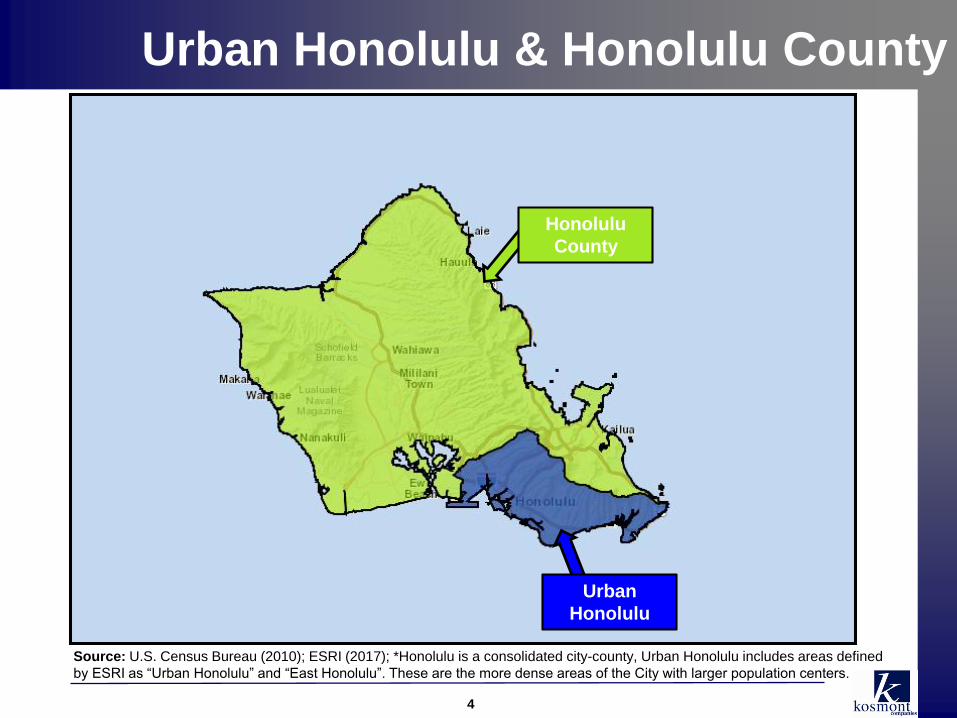
Urban Honolulu & Honolulu County
4
Honolulu
County
Source: U.S. Census Bureau (2010); ESRI (2017); *Honolulu is a consolidated city-county, Urban Honolulu includes areas defined
by ESRI as “Urban Honolulu” and “East Honolulu”. These are the more dense areas of the City with larger population centers.
Urban
Honolulu

5
Demographic Highlights (2016)
Population & Households
• Urban Honolulu* Population of ~403,500 and ~152,900 households;
Honolulu County Population of ~999,800 and ~324,000 households
• 28% of entire State of Hawaii population falls within Urban Honolulu* and 70%
of the State’s population resides in Honolulu County
Income
• Avg. HH income ~$90,500 in Urban Honolulu and ~$94,300 within Honolulu
County
• 1.7% annual growth projected for HH income over next 5 years in Urban
Honolulu and Honolulu County
Other Demographic Characteristics of Urban Honolulu
• Avg. household size of ~2.6 (below County and State averages)
• Median age of ~43 (higher than County and State median age)
• ~39% Bachelor’s Degree or higher (above County and State averages)
• Race: ~51% Asian, ~21% White, ~17% 2 or more races, (~58% Asian & Pacific
Islander origin; 7% Hispanic origin)Source: U.S. Census Bureau (2010); ESRI (2017); *Honolulu is a consolidated city-county, Urban Honolulu includes areas defined
by ESRI as “Urban Honolulu” and “East Honolulu”. These are the more dense areas of the City with larger population centers.

6
Population and Income
Urban Area, County and State
2016Urban
Honolulu*
Honolulu
County
State of
Hawaii
Population 403,496 999,751 1,435,363
Households 152,863 324,047 477,631
Average HH Size 2.55 2.97 2.91
Median Age 43.2 38.2 39.1
% Asian & Pacific Islander Origin 58.1% 49.7% 45.6%
Per Capita Income $35,326 $31,544 $30,608
Median HH Income $65,068 $74,851 $68,416
Average HH Income $90,478 $94,342 $89,117
2016-2021 Annual Growth Rate
Population 0.79% 0.83% 0.94%
Median HH Income 1.70% 1.70% 2.28%
Source: U.S. Census Bureau (2010); ESRI (2017); *Honolulu is a consolidated city-county, Urban Honolulu includes areas defined
by ESRI as “Urban Honolulu” and “East Honolulu”. These are the more dense areas of the City with larger population centers.

Educational Attainment
7
Population Aged 25+ by
Educational Attainment (2016)
9%
24%
28%
25%
14%
8%
27%
32%
23%
11%
8%
29%
32%
21%
10%
No high schooldiploma
High school graduateor equivalent
Some college orAssociate's degree
Bachelor's degree Graduate or prof.degree
Urban Honolulu* County State
Percent Bachelor’s
Degree or Higher
Urban
Hon.39%
County 34%
State 31%
Source: U.S. Census Bureau (2010); ESRI (2017); *Honolulu is a consolidated city-county, Urban Honolulu includes areas defined
by ESRI as “Urban Honolulu” and “East Honolulu”. These are the more dense areas of the City with larger population centers.

Housing & Household Size
8
Housing Breakdown (2016)
44%
47%
9%
52%
41%
8%
50%
37%
13%
Owner Occupied Renter Occupied Vacant
Urban Honolulu* County State Avg. HH Size
Urban
Hon.2.55
County 2.97
State 2.91
Source: U.S. Census Bureau (2010); ESRI (2017); *Honolulu is a consolidated city-county, Urban Honolulu includes areas defined
by ESRI as “Urban Honolulu” and “East Honolulu”. These are the more dense areas of the City with larger population centers.

Home Value History
9
Zillow Home Value Index
Source: Zillow.com (March 2017)
County
Urban Honolulu
Hawaii
$655,000
$196,000
$591,000
USA
$668,000
Outline
10
• Demographic Profile
• Retail Trends & Blended Use
• Next-Gen Economic Development:
The California Story
• Case Studies
• Summary

Cumulative Evolution of Retail
11
1. Big Box Shrinkageo Size matters, but bigger is not necessarily better; most stores smaller by 25% to 75%
o #smallboxretail
2. Food and Place are New Anchor Tenantso For the first time in history, U.S. restaurant sales have surpassed grocery sales
o #YouCan’tEatorDrinkOvertheInternet
3. Mixed Use is about the Right Blendo Today’s “value” metric is more about time and trip generation than sales per square foot
o #CommunityRetail instead of lifestyle retail
4. Millennials Defining Consumer Demographicso Misconception vs. Reality: More spending power than any other generation ($600B)
o 80M strong, mobile devices are their medium for communication, research, shopping, etc.
o #ExperientialRetailing
5. E-Tailo Union of retail consumption & electronic commerce
o Retailers with robust omni-channels backed by physical stores, generate the most online sales
o #Omnichanneling

What is Driving Change for Consumers?
12

Changing Demographics of Consumers
13
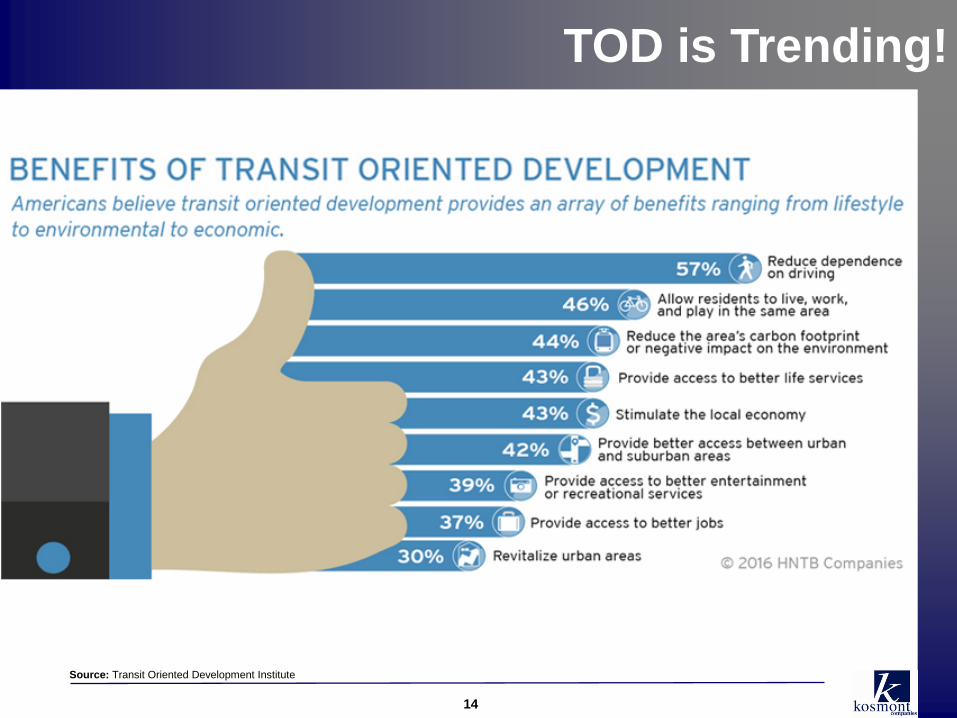
TOD is Trending!
14
Source: Transit Oriented Development Institute

#BlendedUse
15
The 3D Effect:
1. Demand
2. Design
3. Density

2016 Holiday Winner is... Omnichannel Retailers
16
"The convergence of physical and digital continues
to be important as consumers have come to expect
an integrated experience allowing them to buy
products through a variety of channels," McGee
said. "The survey data proves that omnichannel
retailers are the real winners this season as they
offer purchasing options that satisfy the shopping
behaviors of all generations.
Source: International Council of Shopping Centers

Outline
17
• Demographic Profile
• Retail Trends & Blended Use
• Next-Gen Economic Development:
The California Story
• Case Studies
• Summary

The California Redevelopment Story
18
Community Redevelopment Act (1945)
• Local governments allowed to form separate
Redevelopment Agencies (RDAs) in California
• In 1952, Proposition 18 allowed for “tax increment
financing”
• Cities and counties could declare “blighted areas”
allowing agencies to acquire properties, enter public
private transactions and leverage growth in property
tax revenue from RDA project areas
Prop. 13 (1978)
• Capped the general-purpose property tax rate at 1%
and growth of taxes at 2% annually
• Encouraged RDAs to use property-tax income to
finance RDA projects by reducing other financing
options
• Property taxes were reliable and consistent source
of revenue stream
Source: HUD “Redevelopment Agencies in California: History, Benefits, Excesses, and Closure”; ABX1 26 Ch. 2, Section 34172.b (California, 2011)
ABX1 26 (2011)
• Governor Jerry Brown
decided RDAs should be
eliminated in wake of CA
budget deficit
• Dissolution of RDAs and
“all authority to transact
business and exercise
power” on Feb. 1, 2012
• RDA properties to be sold

California Shifting from Oil-Based to Green Economy
19
Sustainable Infrastructure
Investments / Transit
Energy-Saving Industrial
Processes
Renewable Energy
Investments
Cap and Trade ProgramBuilding Efficiency
Design and Upgrades
CEQA Analysis Changes
from LOS to VMT
Focus of Next Gen Economic Development
NOW THE WORLD LEADER IN FIGHT AGAINST CLIMATE CHANGE
SB 32 requires State to reduce greenhouse gas emissions 40% below 1990 levels by 2030.

Next-Gen Economic Development
20
DESTINATION
DIGITAL
DEVELOPMENT

“Creating a Place” using E.D. 2.0 tools
21
Economic Development & Real Estate
Projects
These tools often work best when used together
Real Estate & Property
P3 / Project Delivery Methods
Grants / State / Federal Sources
(EDA, CDBG, Cap and Trade Funds)
Enhanced Infrastructure
Financing Districts (EIFDs)
Property Assessed Clean Energy Finance Program (PACE)
Community Revitalization &
Inv. Authority (CRIA)
Special Districts (Tourism, BIDs,
etc.)
Rebate of Taxes / Revenues
Land Use / Zoning (Higher
Density; DORTM; Parking)
Cities have 9 BASIC TOOLS for Public/Private Projects
TIF
DISTRICTS

The Plumbing of the World is Changing
22
• Tech changing the way we live: shifting retail and tenant mix, interaction and
connectivity (driverless cars, robots, big data)
• Replacement of jobs with automation requires unprecedented commitment to
“continuous” education and job creation
• Retail adapting to changing social habits, brick/clicks blending, focus on trips
• California Governor and Legislature shifting economy to a reduced carbon
footprint “green” economy
• Green Mandates & Green Public/Private Projects with incentives will flourish
• Housing shortage hurts State’s competitiveness
• Cities need the private sector $$ to create jobs & tax revenue and housing
• New E.D. strategies required to respond to accelerated changes in climate
action controls, technology, & lifestyle preferences
• Economic Development is not a mission, it’s an imperative

Next-Gen Tools to Attract
Private Investment Through Sustainability
23
Governor Jerry Brown taketh and giveth …
• Enhanced Infrastructure Financing Districts (EIFDs)
(SB 628/AB 313 Sept. 29, 2014/Sept. 22, 2015)
Focus on infrastructure and public/private transactions
• Community Revitalization and Investment Authorities (CRIAs)
(AB 2/AB 2492 Sept. 22, 2015 / Sept. 23, 2016)
Similar with stringent eligibility standards & focus on affordable housing
• EIFD AND CRIA encourage regional approach with multiple local agencies
(cities, counties & special districts) to maximize tax increment financing
• Can enhance tax increment with state funding geared to climate action and
transportation programs: Cap & Trade/GGRF, PACE, Prop 1, plus regional
transportation sales tax measures

EIFDs at a Glance
24
• Enables tax increment financing for local/regional projects (purchase,
construction, expansion, improvement, seismic retrofit, rehabilitation)
• District lifespan is 45 years to collect and spend property tax increment
• Any property with useful life of 15+ years & of communitywide
significance
• Managed by newly created Public Financing Authority (led by city or
county) – board of 5+ members, includes at least 2 public members
• Activities directed by PFA adopted Infrastructure Financing Plan (IFP)
• No public vote required to create District
• 55% landowner or registered voter election
needed for tax increment bonds
• No school district increment allowed
• Does not increase property taxes

CRIAs at a Glance
25
Community Revitalization Investment Authority (CRIA)
• Restores redevelopment authorities to disadvantaged communities
Carries out provisions of Community Redevelopment Law
• Formed by City or County (Special Districts allowed if CRIA is Joint Powers Authority)
5+ member board, including at least 2 public members
• Allows projects to be financed by bonds serviced by tax increment
30 years to issue debt; 45 years to repay indebtedness
• Powers of eminent domain granted to CRIAs for first 12 years of district
• No voter approval for formation or bond issuance, but subject to majority protest at
adoption and every 10 years
• 25% affordable housing set-aside
• Must meet qualification requirements
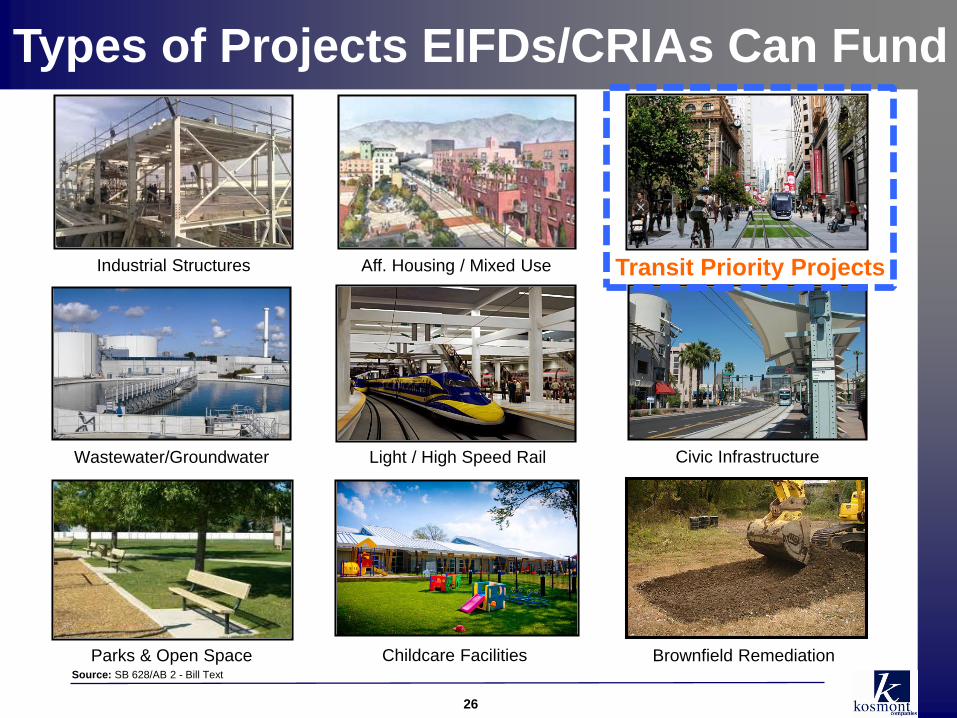
Types of Projects EIFDs/CRIAs Can Fund
26
Source: SB 628/AB 2 - Bill Text
Aff. Housing / Mixed Use
Civic Infrastructure
Brownfield Remediation
Wastewater/Groundwater Light / High Speed Rail
Parks & Open Space
Industrial Structures
Childcare Facilities
Transit Priority Projects

EIFD Example:
Transit-Oriented Development (TOD)
27
Issue
• Sprawl and lack of transportation options lead to auto
dependency and excessive greenhouse gas (GHG)
emissions
Opportunity
• Regions will look to reduce sprawl and improve air quality
• Transit-oriented development (TOD) is one way to not only
reduce car dependency, but also to invest in the
neighborhoods that surround transportation options
• The result is the creation of economically revitalized
communities
Role of the EIFD/Tax Increment District
• Cities/Counties/Special Districts may participate in a tax
increment district to build infrastructure, such as transit
lines/systems, construct stations, and develop the
neighborhoods around the transit terminals
• The District can fund physical improvements: sidewalks,
streets, bicycle lanes, and new parking structures
• User fees from parking and revenue growth from rising
property values, can be used to catalyze private investment

Hypothetical Mixed Use TOD Project
28
Kosmont assumed EIFD for $150 million project valuation shown below
Commercial Development ($2017)
Retail 45,000 SF $ 350 $/SF $ 15,750,000
Office 29,375 SF $ 400 $/SF $ 11,750,000
Hotel 80 Keys $ 250,000 $/Key $ 20,000,000
Subtotal Commercial Development Value $ 47,500,000
Residential Development ($2017)
Residential Owned 150 Units $ 450,000 $/Unit $ 67,500,000
Multifamily Rental 100 Units $ 350,000 $/Unit $ 35,000,000
Subtotal Residential Development Value $ 102,500,000
Total Development Value $ 150,000,000

TIF Growth
29
• The city pledges 15 cents of tax increment to the EIFD
• In this scenario, the EIFD creates approximately $8.4 million in revenue
over 30 years.
$0
$1,000,000
$2,000,000
$3,000,000
$4,000,000
$5,000,000
$6,000,000
$7,000,000
$8,000,000
$9,000,000
1 2 3 4 5 6 7 8 9 10 11 12 13 14 15 16 17 18 19 20 21 22 23 24 25 26 27 28 29 30
City Share
30-Year Property Tax Increment Projections
With 15 Cent City Share

Tax Increment Financing in Hawaii
30
Source: Council of Development Finance Agencies (CDFA); Hawaii State Statutes Div. 1, Title 6, Subtitle 1, Ch. 46, Part IV, Sect. 46-101 to 46-104
Tax Increment Financing at a Glance
• Authorized in 1985 under Hawaii Revised Statutes
(Div. 1, Title 6, Subtitle 1, Ch. 46, Part IV, 46-101)
“Tax Increment Financing Act”
• “Any county council may provide for tax increment
financing by approving a tax increment financing
plan and adopting an ordinance establishing the tax
increment district”
• A county may exercise the power to:
Create tax increment districts
Issue tax increment bonds
Deposit tax increments into the tax increment
fund created for such a District
Enter into agreements with redevelopment
agencies and owners or developers of project
lands and bondholders
Validity of TIF today??
Eligible Public Costs
• Bicycle lanes, bridge
construction and repair,
building acquisition,
convention centers, curb
and sidewalk improvements,
demolition, drainage
facilities, environmental
remediation, lighting, park
improvements, parking
structures, wastewater
treatment facilities, etc.

Outline
31
• Demographic Profile
• Retail Trends & Blended Use
• Next-Gen Economic Development:
The California Story
• Case Studies
• Summary

32
Retail/Mixed-Use Case Study: Old Town Newhall
• Old Town Newhall in Santa Clarita, CA is
currently undergoing revitalization
Kosmont negotiated public private transaction
Old Town is downtown transit district in Santa
Clarita located near Newhall Metrolink Station
• Plans include:
372-space Public Parking Structure - broke
ground March 2017
Newhall Crossings Mixed Use development
(20,000 SF of retail; ~47 new apartment units)
with central courtyard - construction slated for
Sept. 2017
New Laemmle Art House Theater - construction to
begin end of 2017
Newhall Crossings Site Plan
Groundbreaking Ceremony for Parking StructureArtist Rendering of Newhall Crossings
To Newhall
Station
EIFD Case Study:
City of La Verne, CA Proposed EIFD (TOD Focus)
33
• EIFD Status EIFD under evaluation by City of La Verne as lead public agency
La Verne’s EIFD Goals:
• Induce private development around future gold line station
• Access Statewide sustainable funding sources such as Greenhouse Gas
Reduction Fund (GGRF)
• The Proposed District Proximate to University of La Verne, LA County Fairplex properties & future
Gold Line Transit Station
388+ acres adjacent to La Verne’s Old Town Specific Plan Area
Small number of private property owners
• Projects (pubic and private) Development of mixed-use housing, potential hotel, retail and event space
Station area improvements, circulation infrastructure next to Foothill station
Sustainable improvements to commercial and industrial structures

34
La Verne EIFD:
Preliminary Potential EIFD Map
Metro Gold
Line Route
Westbound
to Pasadena
Eastbound
to Montclair

La Verne EIFD:
Infrastructure Around Gold Line Station
35
• Parking: 600-space structure at the Gold Line Station, four future parking
structures at buildout
• Gold Line Improvements (Sub-Area 1): Platforms, bicycle racks and
improved streetscape at station.
• Pedestrian Access: New bike lanes, pedestrian sidewalks, and a footbridge
across Arrow Hwy. to connect proposed Fairplex development to Gold Line
station.
Improvements for increased
Pedestrian Access to Rail StationRail Station
ImprovementsParking Infrastructure

36
La Verne EIFD:
Tax Increment Projections
Assumptions:
• Kosmont used initial 5, 10 and 20 year development projections and infrastructure needs
to estimate tax increment revenues
City of La Verne
Preliminary Assessed Value Projections
Development
Type Units
Projected
AV/Unit/SF
Projected Total
Assessed Value
Hotel 150 Keys $100,000 $15,000,000
Retail 110,000 SF $250 $27,500,000
Business Park 60,000 SF $100 $6,000,000
Apartments 920 Units $175,000 $161,000,000
Condominiums 915 Units $300,000 $274,500,000
Total Projected AV New Development $484,000,000
Key Initial Findings:
• Project Area current assessed value ~$63 million
• Significant infrastructure funding capacity for district, further increased and accelerated
with LA County participation

37
La Verne EIFD:
Partnerships• La Verne Pitch to County for EIFD Participation:
Goals of La Verne EIFD/CRIA are consistent with goals of County per
County E.D. Resolution
Projects funded by EIFD/CRIA are regionally beneficial
EIFD/CRIA induces private investment, which increases tax increment
for LA County
• Tax Increment Potential for La Verne with LA County
Participation:
LA County receives ~30 cents on the dollar in property tax increment
City of La Verne receives ~22 cents
With LA County participation, EIFD district could increase tax increment
above La Verne’s share, increasing/accelerating infrastructure funding
capacity for district

Outline
38
• Demographic Profile
• Retail Trends & Blended Use
• Next-Gen Economic Development:
The California Story
• Case Studies
• Summary

Summary
39
1. Well educated, high income population within Honolulu County
2. Changing demographics, busy lifestyles, and increasing access to
technology are what is driving today’s consumers
3. Retailers are embracing physical and digital platforms to capture
larger amounts of sales via Omnichanneling
4. Plumbing of the world is changing; shifts in technology, climate,
and lifestyle require new Economic Development approaches
5. Next-Gen. Econ Dev fosters regional collaboration, energy
efficiency, sustainability, infrastructure, quality jobs & creating
destinations
6. Cities can use tax increment districts (EIFDs/CRIAs in CA) and
other Econ Dev tools to achieve community objectives; private
sector investment needed to yield taxes, jobs and development

Questions?
40
Questions?