presentation1
TRANSCRIPT


NAKUL N
SHYNU SAMUEL
VISHNU M
VYSHAK S
YEDHU KRISHNAN R U
Group members
RECORDING TECHNIQUES
Recording techniques is the preparatory step towards critical examination to a large extents, depends on how correctly, precisely and in comprehensive form the facts relating to the method under study are recorded . Recording techniques are following
Process charto operation process charto flow process charto two handed process charto multiple activity chart o travel charto SIMO chart
Diagrams and modelso flow diagramo string diagramo model and therbligo cycle graph

ASME

OPERATION PROCESS CHART
It gives the bird’s eye view of whole the process by recording only the major activities and inspections involved in the process. It is also called outline
process chart. Uses only two symbols,o Operation
o Inspection

FLOW PROCESS CHART
It gives the sequence of flow of work of a product or any part of it, through the work centre recording the events using appropriate symbols. it is the amplification of the operation process chart in which operations , instructions, storage, delay and transportation are represented. Flow process chart are of three types,
o Material o Man o Equipment

TWO HANDED PROCESS CHART
A chart in which the activities of a worker’s hands (or limbs) are recorded in their relationship to one another.
Generally used for repetitive operation, when one complete cycle of the operation is to be recorded

MULTIPLE ACTIVITY CHART Chart on which activities of workers, product and
machines are recorded on a common time scale to show their relationships

TRAVEL CHART It is a tabular record for presenting quantitative data
about the movement of workers, materials or equipment between any number of places over any given period of time.

SIMO CHART
A basic motion-time chart used to show the simultaneous nature of motions; commonly a therblig chart for two-hand work with motion symbols plotted vertically with respect to time, showing the therbligabbreviation and a brief description for each activity, and individual times values and body-member detail. Also known as simultaneous motion-cycle chart.

DIAGRAMS
Diagrams are used to scale and layout the present slide. The flow process chart shows the sequence and the nature of movements but it does not shows the path of movements. In the path of movements there are often undesirable features such as congestion, back tracking and unnecessary long movements. To record these unnecessary features, representation of the working area in the form of flow diagrams, string diagrams can be made.
FLOW DIAGRAMS
Shows the relative position of machines and equipments and marks the path followed by man and material


STRING DIAGRAM
The string diagram is a scale plan or model onwhich a thread is used to trace and measure thepath of workers, material or equipment during aspecified sequence of events
The string diagram is a special form of flowdiagram, in which a string or thread is used tomeasure distance. It is necessary that the stringdiagram be drawn correctly to scale.
The string diagram is started in exactly the sameway as all other method studies: by recording allthe relevant facts from direct observation.
A string diagram can be used to plot themovements of materials, and, especially when awork study person wants to find out easily justhow far the materials travel


THERBLIGS
Therbligs are 18kinds of elemental motions used in the study of motion economy in the workplace. A workplace task is analyzed by recording each of the therblig units for a process, with the results used for optimization of manual labour by eliminating unneeded movements.

CYCLE GRAPH AND CHRONOCYCLE GRAPH
Cycle graph
To study the path of movement of operators hands; A small electric bulb is attached to hand and photograph is taken by a still camera
Chrono cycle graph
A device used in micro motion studies to record a complete work cycle by taking still pictures with long exposures, the motion paths being traced by small electric lamps fastened to the worker's hands or fingers; time is obtained by interrupting the light circuits with a controlled frequency which produces dots on the film.
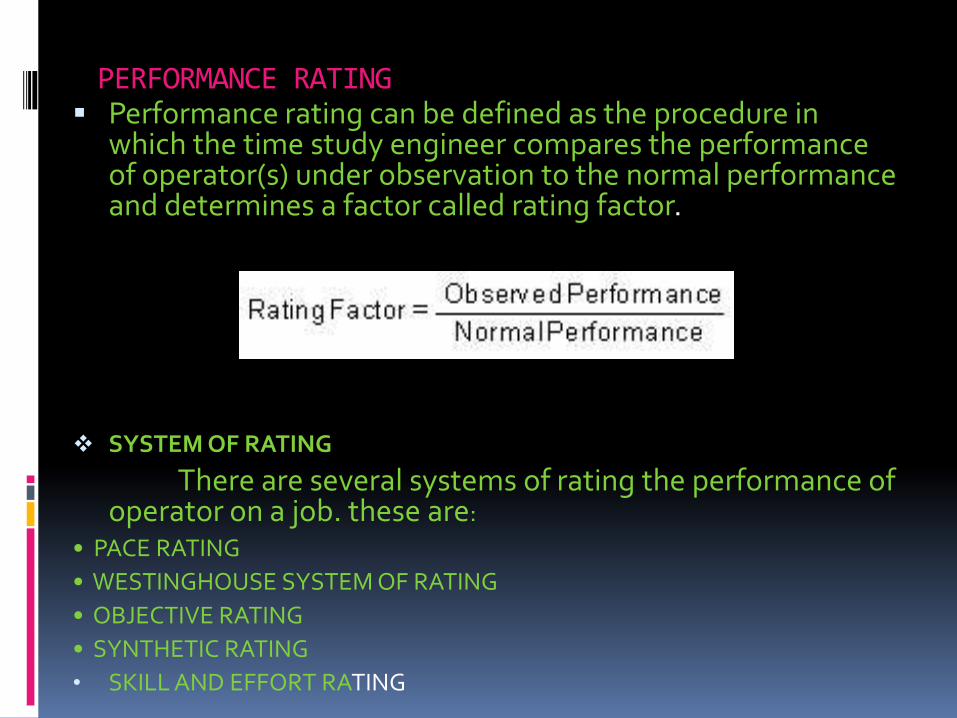
PERFORMANCE RATING Performance rating can be defined as the procedure in
which the time study engineer compares the performance of operator(s) under observation to the normal performance and determines a factor called rating factor.
SYSTEM OF RATING
There are several systems of rating the performance of operator on a job. these are:
• PACE RATING
• WESTINGHOUSE SYSTEM OF RATING
• OBJECTIVE RATING
• SYNTHETIC RATING
• SKILL AND EFFORT RATING

PACE RATING
pace rating is also called the speed rating method, the time study person judges the operators speed of movements, i.e. the rate at which he is applying himself, or in other words "how fast" the operator performs the motions involved.
Normal time = observed time worker's speed
speed expected from the worker
WESTINGHOUSE SYSTEM OF RATING
This method considers four factors in evaluating the performance of operator: skill, effort, conditions, and
consistency.

OBJECTIVE RATING In this system, speed of movements and job difficulty are rated separately and the two estimates are combined into a single value. Rating of speed or pace is done as described earlier, and the rating of job difficulty is done by selecting adjustment factors corresponding to characteristics of operations are
• amount of body used
• eye-hand co ordination
• foot movements
• handling requirements
• weight handled

SYNTHETIC RATING
This method of rating has two main advantages over other methods that
1, it does not rely on the judgment of the time study person
2,it give consistent results.
The time study is made as usual. Some manually controlled elements of the work cycle are selected. Using a PMT system (Predetermined motion time system), the times for these elements are determined. The times of these elements are the performance factor is determined for each of the selected elements.
Performance or Rating Factor, R = P / A
Where P = Predetermined motion time of the element , A = Average actual Observed time of the element.

SKILL AND EFFORT RATING
Bedaux introduced this method and his time standards were expressed in points or “Bs” .
‘B’ was simply another name for a standard minute.
Bedaux used 6o points equal to standard performance. In other words, an operator working at a normal pace was expected to produce 60 Bs per hour and it was expected that the average incentive pace would be around 70 to 85 points per hour.

PHYSIOLOGICAL EVALUATION OF PERFORMANCE LEVEL
Performance level of a worker can also be estimated physiology , because heart beat rate increases with muscular activities and amount of oxygen consumed by a worker increases with the severity of physical labour.
