presentation1.pptx, radiological imaging of cerebral ischemia
TRANSCRIPT
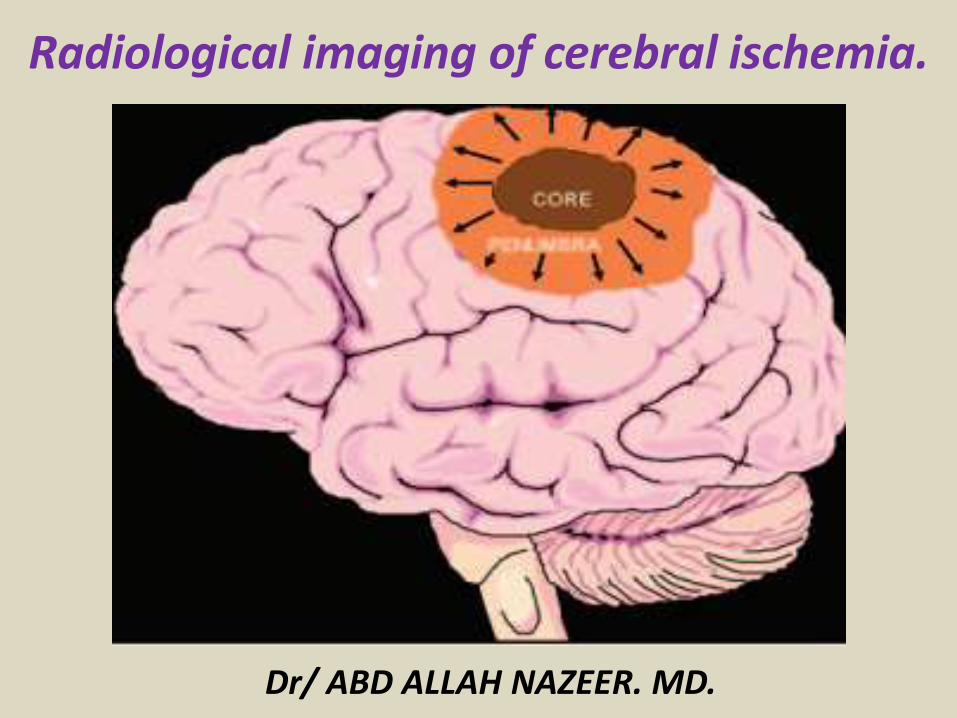
Radiological imaging of cerebral ischemia
Dr ABD ALLAH NAZEER MD
Ischemic stroke results from a sudden cessation of adequate amounts of blood reaching parts of the brain Ischemic strokes can be divided according to territory affected or mechanism
Clinical presentationAn ischemic stroke typically presents with rapid onset neurological deficit which is determined by the area of brain that is involved The symptoms often evolve over hours and may worsen or improve depending on the fate of the ischemic penumbra
PathophysiologyInterruption of blood flow through an intracranial artery leads to deprivation of oxygen and glucose in the supplied vascular territory This initiates a cascade of events at a cellular level which if circulation is not re-established in time will lead to cell death mostly through liquefactive necrosisThe mechanism of vessel obstruction is important in addressing therapeutic manoeuvres to both attempt to reverse or minimize the effects and to prevent future infarcts
Etiology of strokeStroke in adultsbull atherosclerosis of extracranial arteries that supply blood to the brainbull hypertension and atherosclerosisbull arterial embolismbull CNS vasculitis
Stroke in children and young adultsbull congenital or acquired heart conditionsbull hematologic and disordersbull vasculopathies andbull drug ingestion
Neonatal strokebull Maternal causes autoimmune disorders coagulation disorders congenitalheart disease diabetes traumabull Placental causes thrombosis placental abruption placental infectionchorioamnionitisbull Congenital blood disordersbull Systemic or CNS infection
TTP-time to peak CBF- cerebral blood flow CBV-cerebral blood volume
Radiographic featuresThe goals of CT in the acute setting are exclude intracranial hemorrhage which would preclude thrombolysislook for any early features of infarctionexclude other intracranial pathologies that may mimic a stroke such as tumourImmediateThe earliest CT sign visible is a hyperdense segment of a vessel representing direct visualization of the intravascular thrombus embolus and as such is visible immediately Although this can be seen in any vessel it is most often observed in the middle cerebral artery Early (1-3 hours) (also known as hyperacute phase)Within the first few hours a number of signs are visible depending on the site of occlusion and the presence of collateral flow Early features includeloss of grey-white matter differentiation and hypoattenuation of deep nuclei
lentiform nucleus changes seen as early as 1 hour after occlusion visible in 75 of patients at 3 hours
cortical hypodensity with associated parenchymal swelling with resultant gyral effacement
cortex which has poor collateral supply (eg insular ribbon) is more vulnerable
First weekWith time the hypo-attenuation and swelling become more marked resulting in significant mass effect This is a major cause of secondary damage in large infarcts
Second to third weekAs time goes on the swelling starts to subside and small amounts of cortical petechial hemorrhages (not to be confused with hemorrhagic transformation) results in elevation of the attenuation of the cortex This is known as the CT fogging phenomenon Imaging a stroke at this time can be misleading as the affected cortex will appear near normal
MonthsLater still the residual swelling passes and gliosis sets in eventually appearing as a region of low density with negative mass effect Cortical mineralization can also sometimes be seen appearing hyperdense
CT perfusionCT perfusion has emerged as a critical tool in selecting patients for reperfusion therapy as well as increasing the accurate diagnosis of ischemic stroke among non-expert readers four fold compared to routine non-contrast CT It allows both the core of the infarct (that part destined to never recover regardless of reperfusion) to be identified as well as the surrounding penumbra (the region which although ischemic has yet to go on to infarct and can be potentially salvaged) The key to interpretation is understanding a number of perfusion parameterscerebral blood volume (CBV)cerebral blood flow (CBF)mean transit time (MTT) time to peak (TPP)Areas which demonstrate matched defects in CBV and MTT represent the unsalvageable infarct core whereas areas which have prolonged MTT but preserved CBV are considered to be the ischemic penumbra
CT angiographymay identify thrombus within an intracranial vessel and may guide intra-arterial thrombolysis or clot retrieval evaluation of the carotid and vertebral arteries in the neck
establishing stroke etiology (eg atherosclerosis dissection)access limitation for endovascular treatment (eg turtuosity stenosis)
MRIMRI is more time consuming and less available than CT but has significantly higher sensitivity and specificity in the diagnosis of acute ischemic infarction in the first few hours after onsetdiffusion weighted imaging (DWI) ADC
diffusion restriction may be seen within minutes following the onset of ischaemia correlates well with infarct corefor detailed discussion of DWI and ADC in stroke see diffusion weighted MRI in acute stroke
T2-weighted imaging and FLAIRless sensitive than DWI in the first few hours to parenchymal changeloss of normal signal void in large arteries may be visible immediatelyafter 6-12 hours infarcted tissue becomes high signal sulcal effacement and mass effect develop and become maximal in the first few daysfogging between 1-4 weeks (peak 2-3 weeks) infiltration of inflammatory cells may reduce T2 signal such that it becomes relatively isointense to normal parenchyma
T1low intensity roughly mirrors high T2 FLAIR signalcortical laminar necrosis or pseudolaminar necrosis may be seen as a ribbon of intrinsic high T1 signal usually after 2 weeks (although it can be seen earlier)
T1 C+arterial enhancement (aka intravascular enhancement)
can be seen very early (0-2 hours) although it is more common at about day 3lasts approximately 1 week seen in ~50 of cases
parenchymal enhancementusually begins towards the end of the first week usually lasts less than 12 weeks if longer than this the presence of an underlying lesion should be considered
meningeal enhancement uncommonseen in the first week typically 1-3 daysusually fades by the start of the second week
GRESWIhighly sensitive in the detection of hemorrhage
bull DWI-MRI is the technique of choice for detection of hyperacute cerebral ischemia (in the first six hours) In many cases of hyperacute stroke in which hyperintense signal is already present on T2-weighted images DW sequence better denes the size of the affected tissue bull Perfusion-weighted imaging (PWI) provides information on the hemodynamic status of the affected tissue In hyperacute stroke the tissue with abnormal perfusion is larger than the DWI lesions therefore PWI help identify tissue at risk- the so-called ischemic penumbrabull Diffusion Tensor Imaging (DTI) has opened new possibilities of imaging early stages of Wallerian Degeneration DTI detects changes of water diffusion in the fiber tracts within the first 2 weeks after stroke at a time when T2-weighted images and maps of the orientationally averaged diffusivity do notreveal obvious changes
Early CT signs of ischemic stroke there is loss of corpus striatum on the left side
PICA recent infarcts
Unenhanced CT images in a 56-year-old man with right hemiparesis (a at a lower level than b) demonstrate involvement of the M1 region insular cortex (I) and lentiform nucleus
Computer tomography (CT) in a patient with complete right middle cerebral artery territory infarction (within arrows) Embolic infarctions involve a well-defined vascular territory and characteristically have a triangular appearance on CT
Axial unenhanced head CT demonstrating low attenuation suggestive of ischemia involving bilateral
thalami (A) portions of cerebellum bilaterally (B) and midbrain (C) as represented by the arrows
Hyperdense MCA signals (a) and loss of corpus striatum (b) on the right On perfusion CT (MTT map) there is a large area of diminished perfusion
(c) DWI performed the next day shows a massive MCA infarction (d)
Slightly hyperdense MCA sign on the left (a) AngiondashCT shows a subocclusion at this level (b) that is also seen on the reconstructions (c)
Unenhanced axial CT image show infarction confined to the basal ganglia Axial maximum-intensity-projection image from CT angiogram shows occlusion (arrow) of right middle cerebral artery Note opacification of distal middle cerebral artery branches via collateral circulation from other arteries
Unenhanced axial CT image of brain shows large infarction in essentially entire right middle cerebral artery territory CT angiogram shows occlusion (arrow) of right middle cerebral artery
CT perfusion imaging of (A) cerebral blood volume and (B) mean transit time in a patient with left-sided weakness and ischemic stroke in the right middle cerebral artery territory The prediction model in (C) demonstrates areas of brain colored in red that are likely irreversibly damaged (core infarction) and areas in green that are ischemic (ischemic penumbra) but may be salvageable if blood flow is restored rapidly
a) From the perfusion-computed tomography raw data (first line) three parametric maps can be extracted relating to mean transit time (second row) regional cerebral blood flow (third row) and regional cerebral blood volume (fourth row) respectively Application of the concept of cerebral vascular autoregulation leads to a prognostic map (fifth row) in which the infarct is shown in red and the penumbra in green the latter being the target of thrombolytic drugs (b c) computed tomographyndashangiography allows identification of the origin of the hemodynamic disturbance demonstrated by perfusion-computed tomography In this patient it relates to an occlusion at the right M1ndashM2 junction (arrows) (d e) Finally computed tomographyndashangiography reveals bilateral calcified atheromatous plaques at both carotid bifurcations (arrowheads
a) Nonenhanced CT scans obtained 5 hours after the onset of symptoms in a 60-year-old man withmotoric aphasia and slight right hemiparesis demonstrate normal findings (b) Perfusion CT study shows a smallwedge-shaped area of nonperfused brain in the left frontal lobe that is best seen on the lower images (arrow) In additionthere is a 3-second prolongation of TTP (measurement not shown) within the entire left hemisphere (green area on TTP maps)
A 64-year-old man presenting with headache and acute aphasia A On admission NCCT and CTP were performed NCCT shows no evidence of acute infarction B CT perfusion CBF map shows a region of decreased perfusion within the posterior segment of the left MCA territory (arrows) D MTT map shows a corresponding prolongation within this same region (arrows) C CBV map demonstrates no abnormality therefore representing a CBVMTT mismatch or ischemic penumbra
An 87-year-old woman presenting with acute dysarthria left facial droop and left-sided weakness On admission NCCT and CTP were performed concurrently A NCCT shows some microvascular ischemic changes posteriorly BminusD CTP maps CBF (B) CBV (C) and MTT (D) demonstrate a large area of matched deficit on CBV and MTT maps indicative of core infarct in the right MCA territory
Multimodal CT imaging in a 63-year-old female patient with acute stroke obtained 4 h after symptom onset NCT scan shows subtle loss of the grayndashwhite matter interface in the right parietal lobe CTA demonstrates a paucity of MCA distal branches in the affected brain area no proximal MCA occlusion was found PCT parametric maps show a nearly complete match between the MTT and CBV parametric maps The patient was not treated with rt-PA CTA = CT angiography PCT = perfusion-CT MTT = mean transit time CBV = cerebral blood volume rt-PA = recombinant tissue plasminogen activator
Subacute left MCA infarction CT perfusion shows hypoperfusion (a) On DWI there is an area of hyperintensity involving the basal ganglia on the left (b) Susceptibility-weighted
imaging (SWI) shows no hemorrhage (c) and there is a slight hyperperfusion due to reperfusion a few days later seen on arterial spin labeling (ASL) angiography (d)
Right-hemispheric stroke There is disorganization of the fibers on the reconstructed tractogram in the right hemisphere
Acute stroke in the left medial temporal lobe
Acute ischemia in the right posterior inferior cerebellar artery (PICA) territory DWI shows a bright lesion (a) with a decreased ADC (b) whereas multivoxel spectroscopy shows a decrease in both NAA (c) and Cr (d)
DWI and ADC in acute stroke
fMRI at the acute phase in a patient with a thalamic stroke There is cortical activation on the affected side whereas a hypoperfused lesion is clearly visible in the left thalamus
Penumbra model The central ischemic core is seen as a hyperintensity on DWI (a) This area also visible on the ADC map (b) is surrounded by a larger area of hypoperfused tissue (c)
DWI in a patient with an acute left MCA infarction On the T2-weighted image the lesion is visible (a) DWI shows a large hyperintensity on the left MCA territory(b) with a decreased EDC in the corresponding area (c)
Multimodality imaging of a left middle cerebral artery (MCA) stroke There is a large hyperintensity on diffusion-weighted imaging (DWI) with a reduction in ADC the lesion is visible on the T2-weighted image (c) but there is no blood on the T2 images (d) The coronal Flair image shows the extent of the infarct in the frontal and temporal lobes Contrast-enhanced (f) and intracranial time-of-flight MR angiography show a left MCA occlusion
T2WI and FLAIR images in acute infarct
(c) MIP images (left frontolateral view) and an SSD image (superior view) (far right) from CT angiography show proximal occlusion of the left MCA (white arrow) as well as occlusion of the left ICA (arrowhead) Note that the posterior cerebral arteries are predominantly supplied by the posterior communicating arteries (black arrows) This is a common anatomic variant and explains why the subtle TTP prolongation includes the territory of the posterior cerebral artery (d) Nonenhanced CT scans obtained 1 day later show hypoattenuating swelling in the left MCA territory
(a) Nonenhanced CT scans obtained 21frasl2 hours after the onset of symptoms in a 73-year-old man withright hemiplegia and complete aphasia demonstrate partial obscuration of the lentiform nucleus and subtle swellingand hypoattenuation of the left temporal lobe (arrows) findings that indicate infarction (b) Perfusion CT study demonstrates relative values of 60 and 72 for CBF and CBV respectively within the MCA territory findings that indicate tissue at risk In addition a small area of nonperfusion is seen within the lentiform nucleus (arrow)
Right MCA syndrome
c) MIP images from CT angiography show a high-grade stenosis of the left ICA (straightarrow) that results in narrowing of the distal lumen of the ICA (arrowheads) and of the MCA (curved arrow) The right carotid artery and the basilar artery are normal (d) Nonenhanced CT scans obtained 3 weeks after the onset ofstroke demonstrate infarction of the frontal portion of the lentiform nucleus (arrow) and a small infarction in the left frontal lobe (arrowhead)
Subacute ischemic StageAs time progresses in the subacute phase brain swelling and mass effect will gradually build up within a week followed by gradual improvement beginning from that 1 week onward These are not easily picked up by human eyes on CT Initial hypodensity detected by CT usually remains during this phase However an interesting phenomena sometimes occurred during this phase known as ldquoCT fogging effectrsquo where hypodensed infarcted area disappear becoming isodense This is probably dues to resolution of edema in the infarcted area This usually occurs between 2-6 weeks after the onset of stroke Such ldquodisappeared infarctrdquo will reappear in later phase in a form of tissue cavitation (encephalomalcia) [In addition to that there is also a risk of hemorrhagic transformation in 15-20 of the cases during this period of time Most of the time this occurred within 4-6 days after onset of stroke Once happened the hyperdensity CT image may persist up to 8-10weeks
CT result demonstrating the ldquofogging effectrdquo occurs during subacute phase Left CT image is obtained at 36h with bilateral occipital hypodensities Right image is taken at 18 days showing the isodense appearance of previous infarct Image
Cortical edema in a subacute infarct a The axial FLAIR-weighted image shows high signal gyral swelling and sulcal effacement b There is subtle low signal and gyral swelling (arrow) seen on the T1-weighted sagittal image
Enhancing infarcts Postcontrast T1-weighted image shows gyriform enhancement at the left insula and posterior parietal lobe from a subacute left MCA infarct
a) Ischemic penumbra and infarct core at acute time Red shaded region represents the ischemic penumbra identified using an MTT perfusion map while the blue one represents the infarct core manually delineated on the DWI image A large area of perfusiondiffusion mismatch is clearly distinguishable (b) Swelling at acute time of stroke onset observed in a DWI image A massive swollen infarct occupies most of the MCA territory distorting the right ventricle (c) An example of the influence of partial reperfusion in penumbra and core evolution patterns The acute DWI (left) and the acute perfusion TTP map (right) demonstrates the ldquoreverserdquo mismatch revealing a partial reperfusion where the TTP appears normal in the anterior portion of the MCA territory (d) Scattered lesion at acute timepoint (3 h) The manually delineated lesion in 3 different axial slices in a DWI image is composed of two topologically separate components (e) Scattered lesion at a subacute timepoint(6 days) For the same patient showed in (d) the evolution of the spatial boundaries of the manually delineated scattered lesion is shown at a subacute timepoint (f) Perfusiondiffusion mismatch and the influence of perfusion parameters on the boundary of the visible mismatch The red contour represents the DWI lesion depicted at an acute timepoint superimposed with both MTT (in blue) and CBF (in green) lesions manually delineated at an acute timepoint
Chronic ischemic StageIn chronic stage which has vaguely defined period (weeks to months) the damaged necrotic tissue is resorbed This results in formation of encephalomalcia accompanied by gliosis of adjacent brain tissue Associated with this is dilation of ventricular system of affected part though usually found in relatively large infarct These pathological finding could be picked up by non-enhanced CT and MRI
CT picture of various location of ischemic stroke at chronic phase demonstrating the encephalomalcia
Wallerian degeneration Coronal T2-weighted image shows encephalomalcia of the right frontal and temporal lobes and T2 high signal extending into the right cerebral peduncle (arrow) from Wallerian degeneration
Laminar necrosis This sagittal noncontrast T1-weighted image shows gyriform T1 high signalin a chronic left MCA infarct Mild enlargement of the sulci is consistent with encephalomalcia
Deep cerebral vein thrombosis
Thrombosis of deep cerebral veins
Cortical venous thrombosis This large edematous lesion in the right hemisphere shows hypo-intensity on DWI (a) and hyperintensity on coronal Flair imaging (b) MR phlebography shows a thrombosed cortical vein (c)
ConclusionMRI with a multimodality approach is highly sensitive to detect early changes in strokebull DWI and SWI (T2) detection of brain ischemia vs hemorrhagebull DWI and PWI evaluation of the ischemic penumbrabull MRA vessel occlusionbull SWI (T2) hemorrhagic riskGiven the access-related limitations of MRI unenhanced CT is the most common imaging study used to exclude hemorrhagein the acute patient identify early signs seen after the ictusonset and the vascular lesion responsible for the neurologicdeficit
bull CT perfusion allow to evaluate the ischemic core and theischemic penumbra
bull CT angiography permit to evaluate the vessel status and the occluded vessel
Thank You
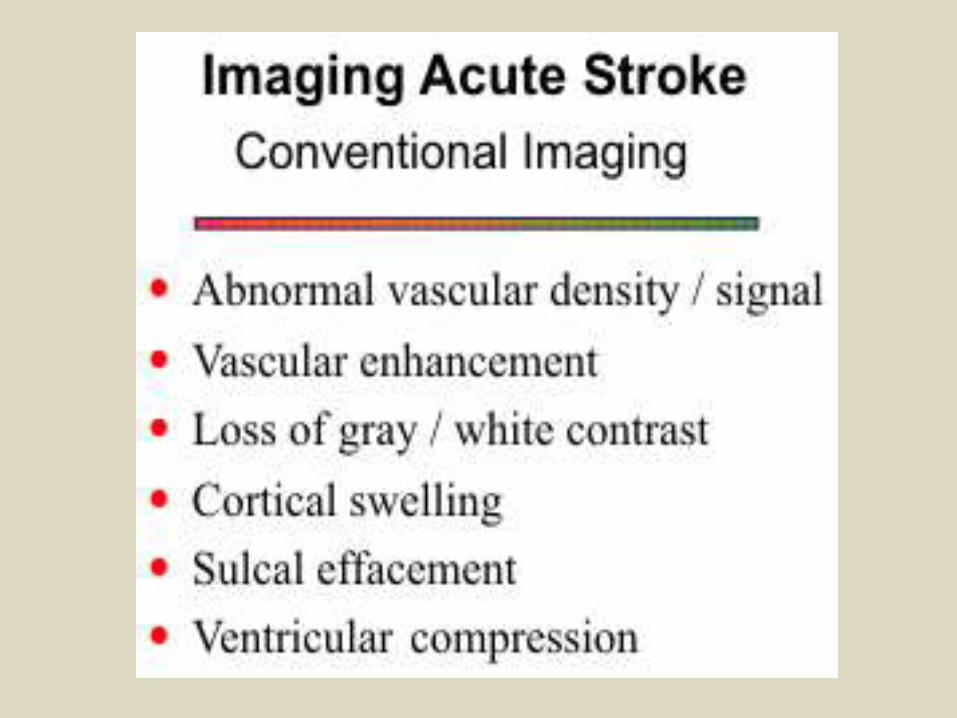
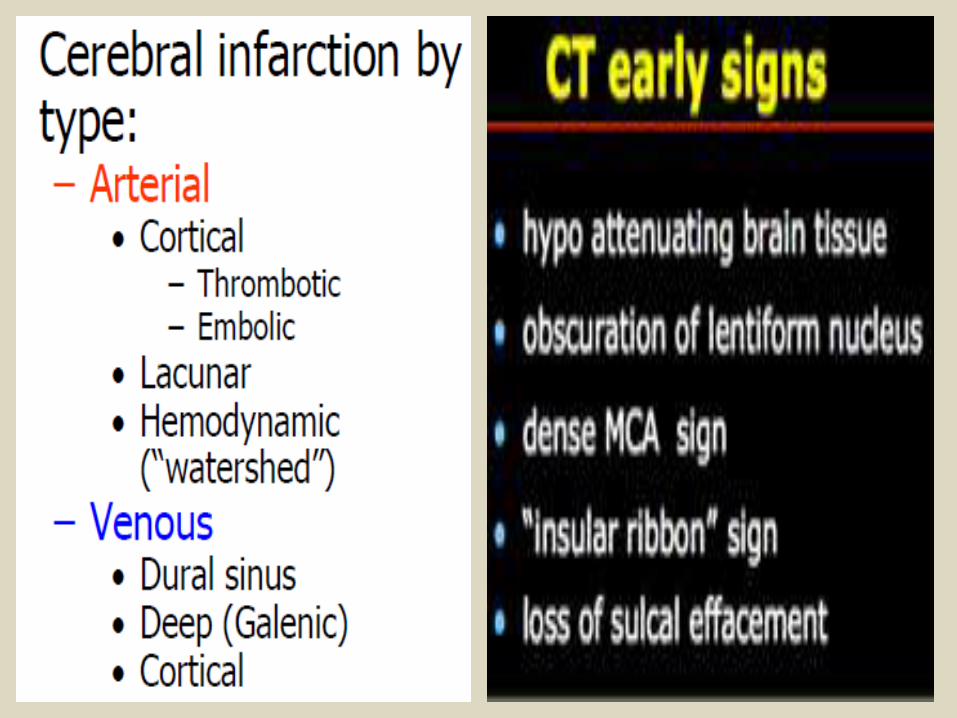
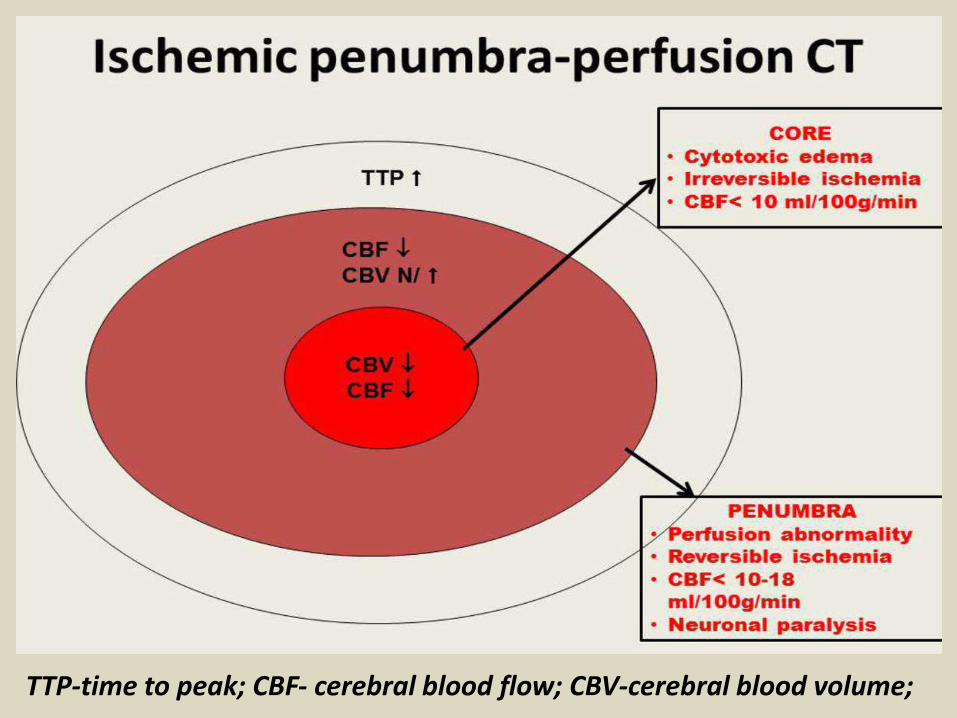
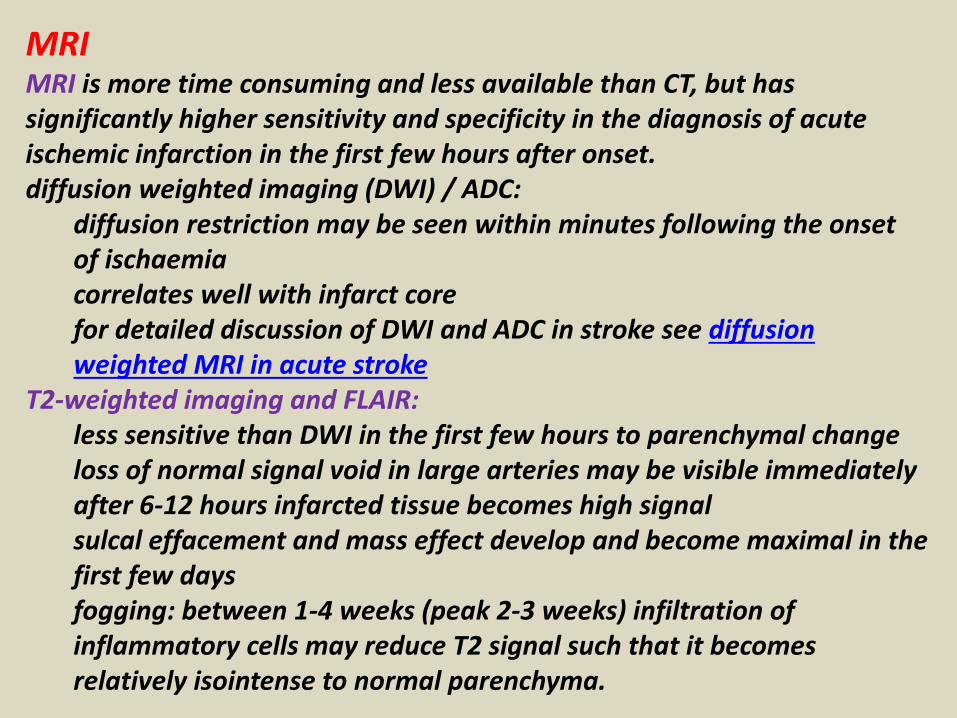
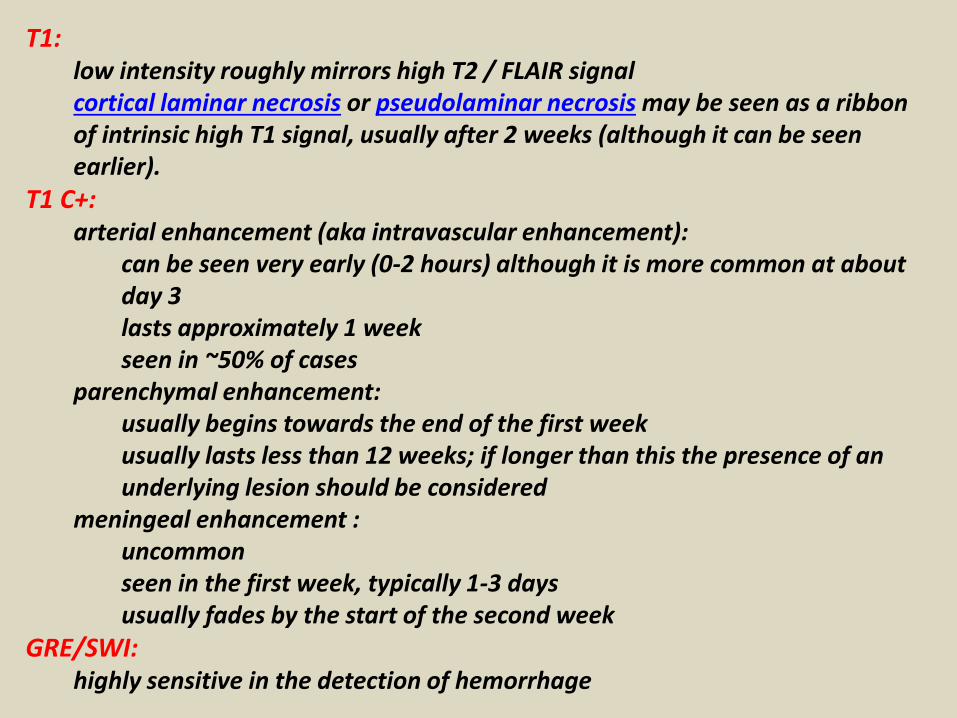
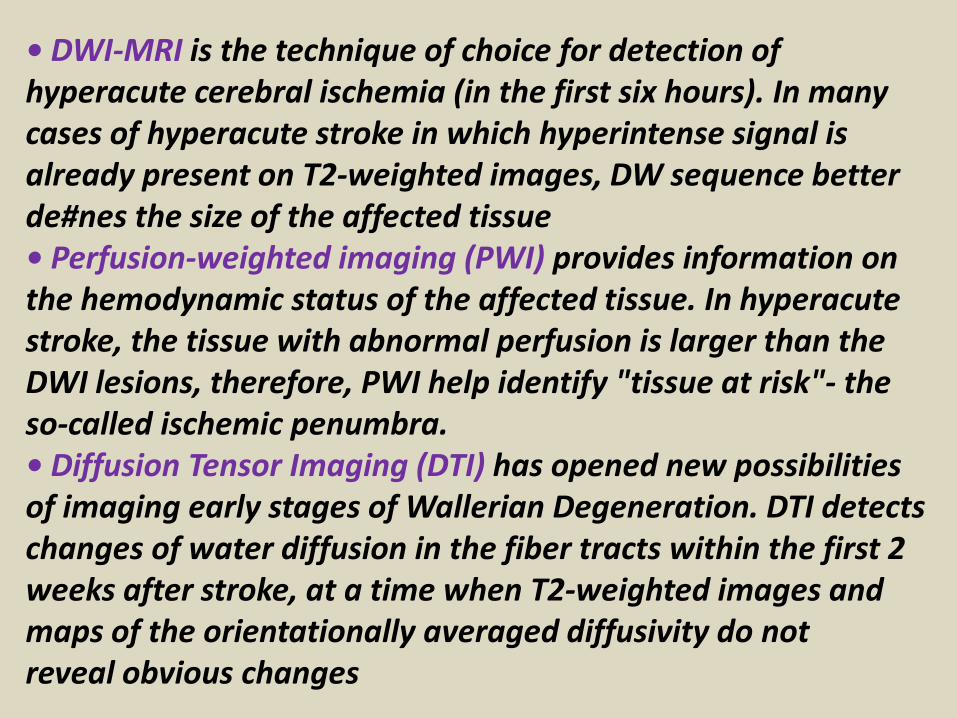
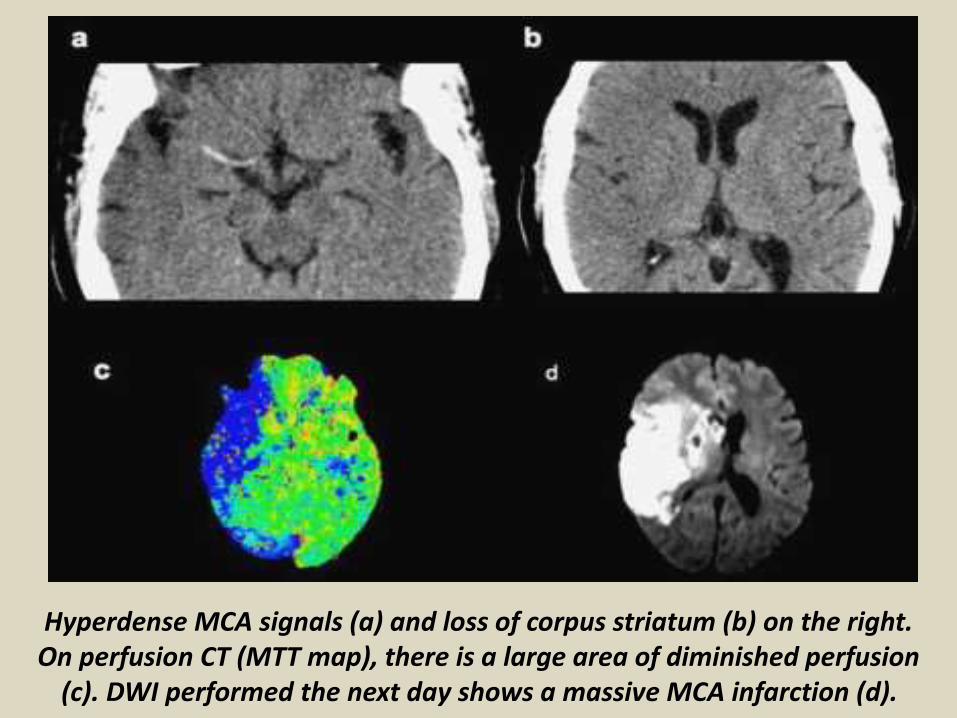
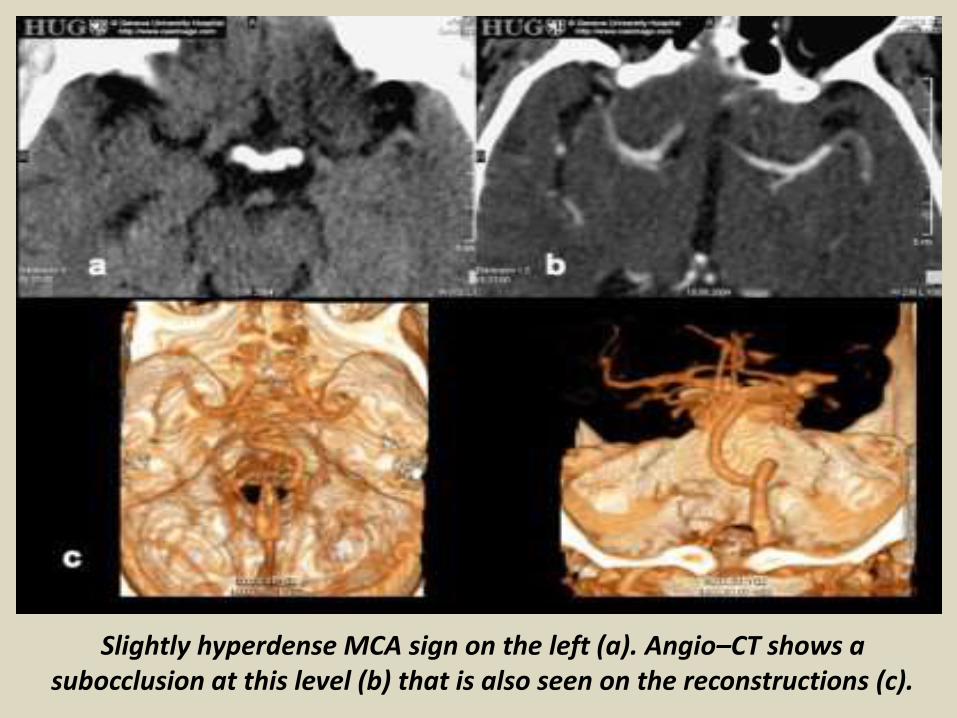
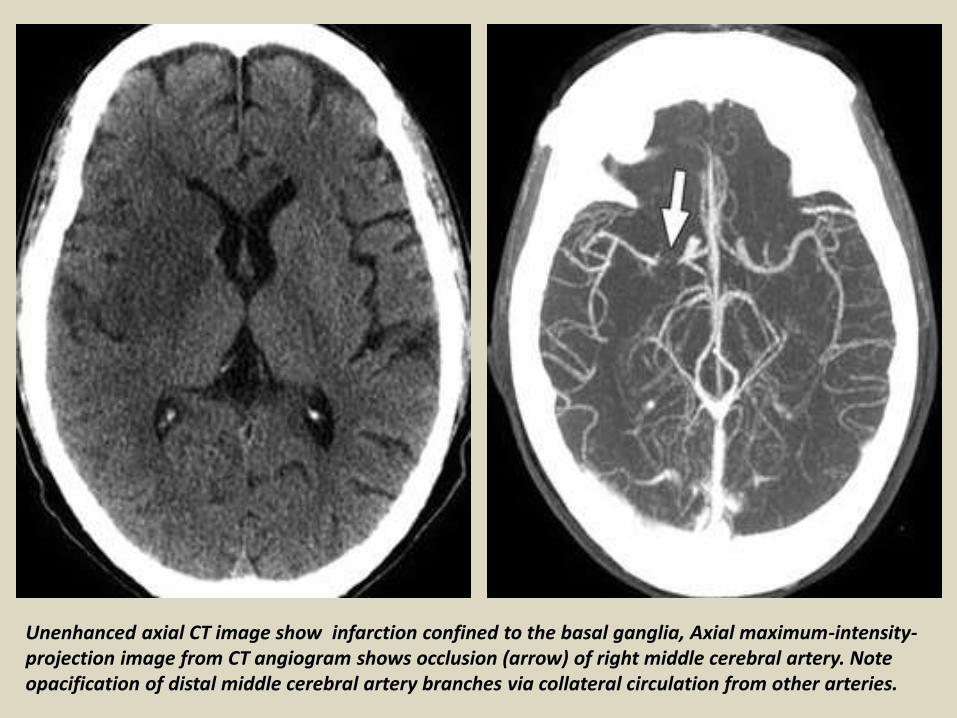
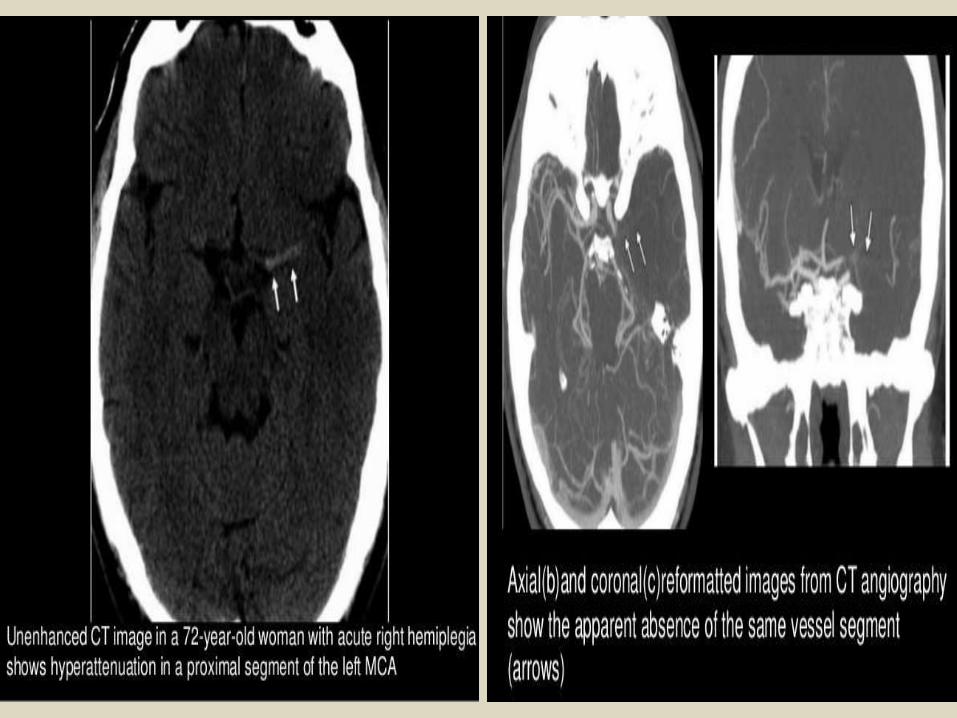
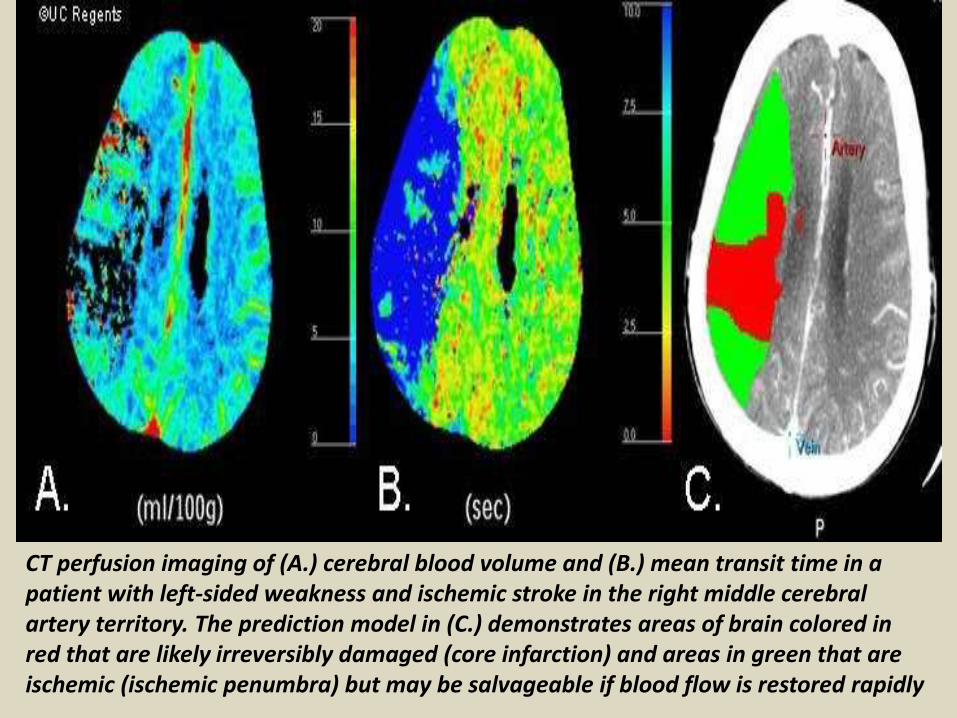
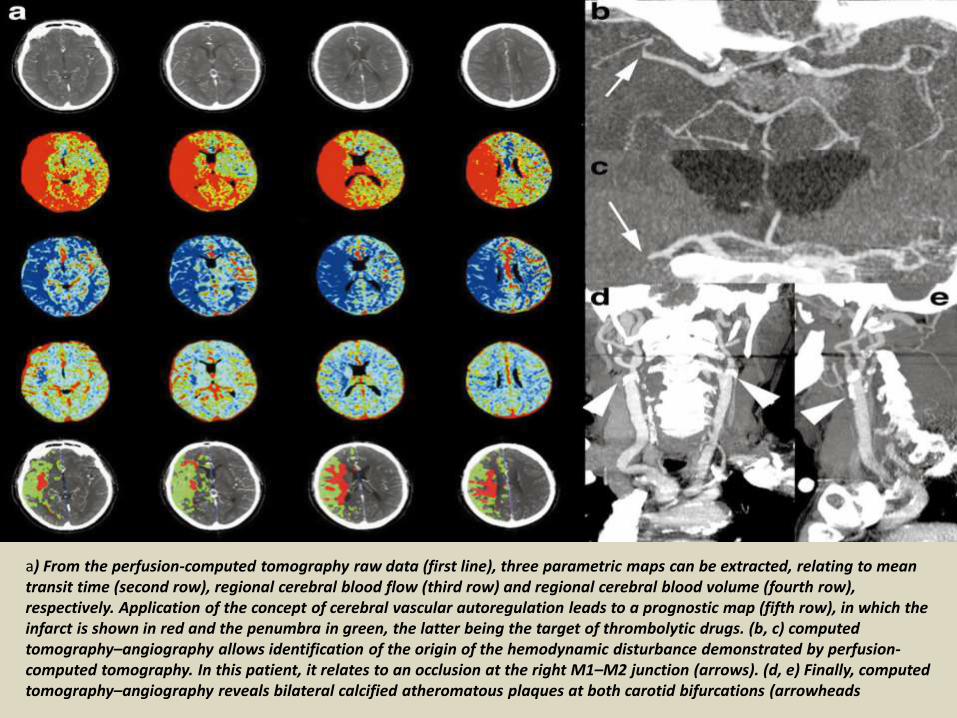
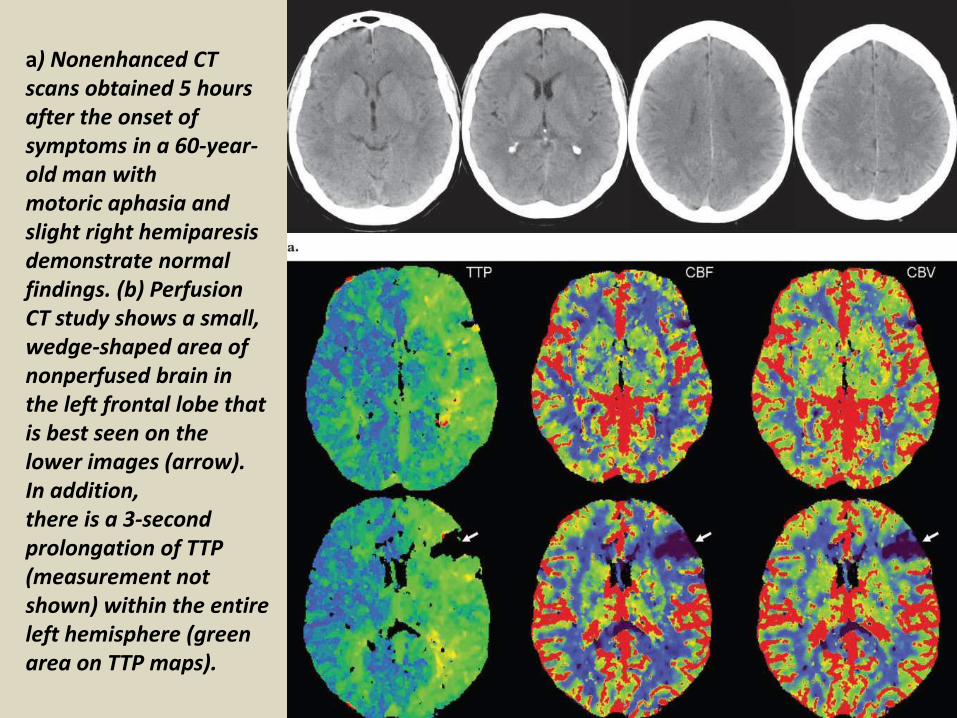
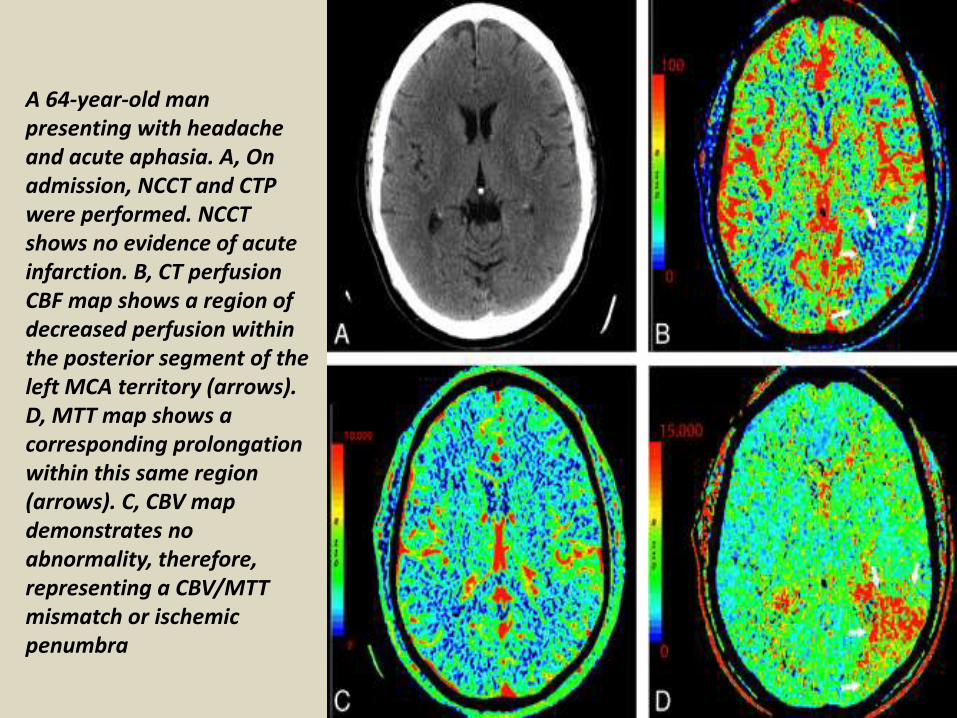
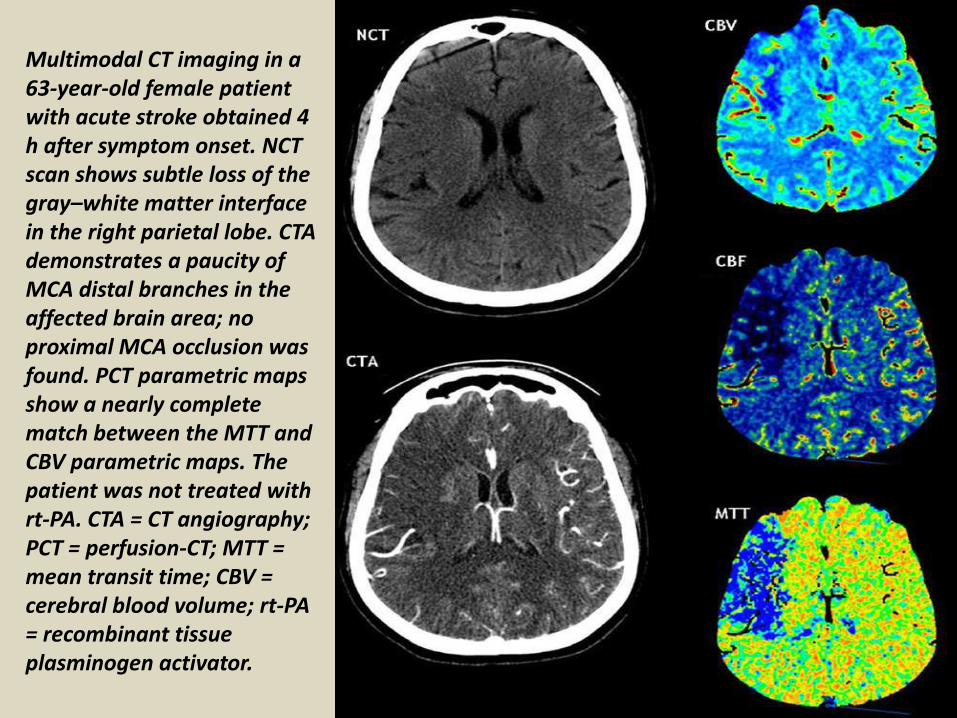
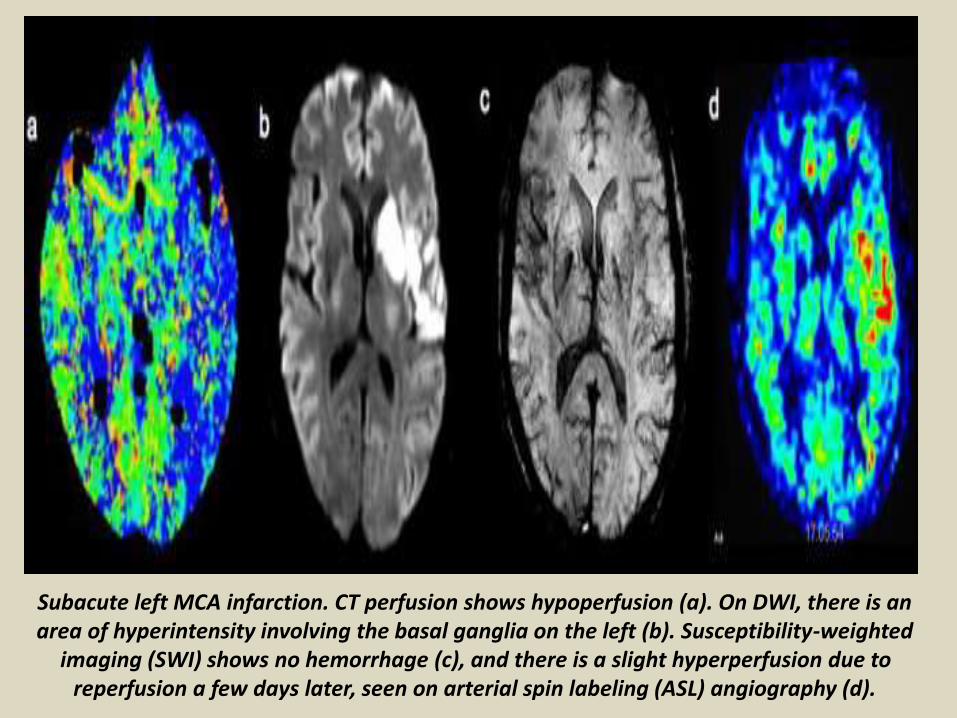
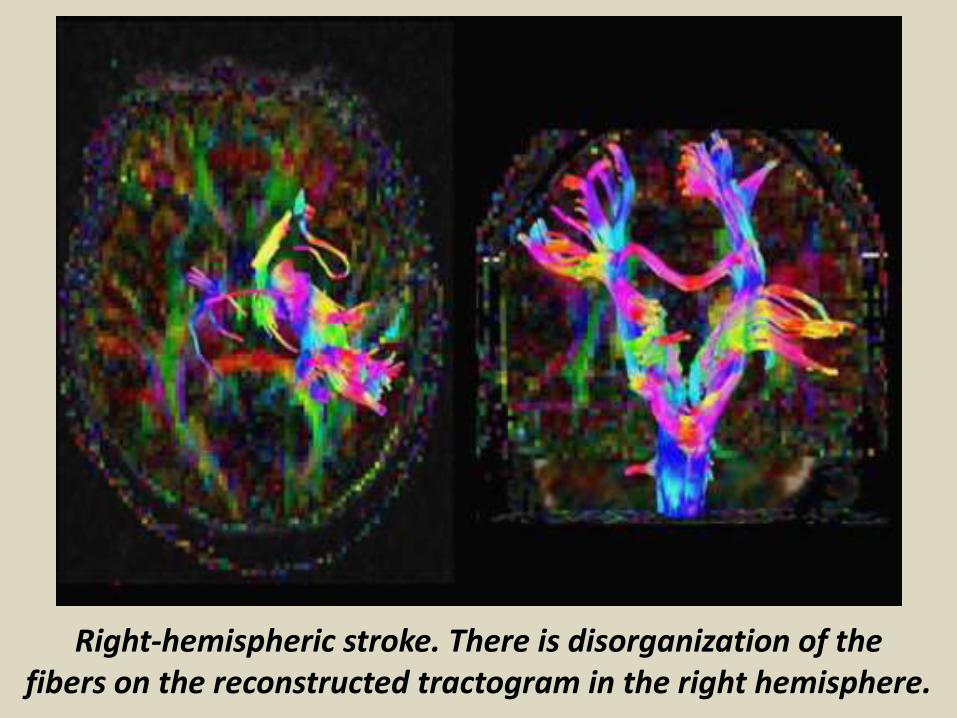
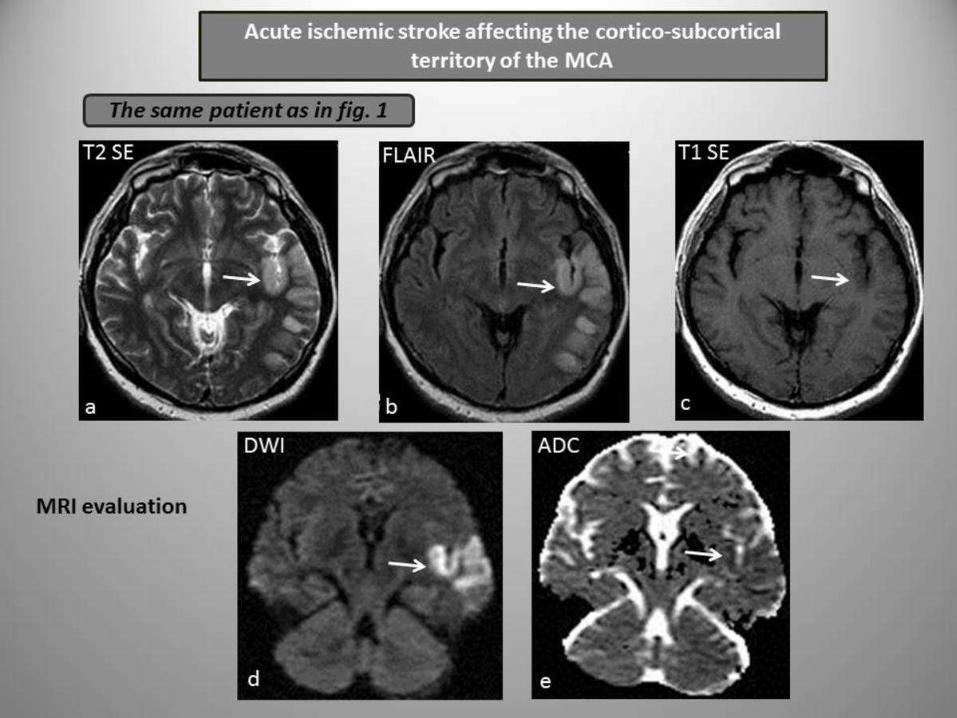
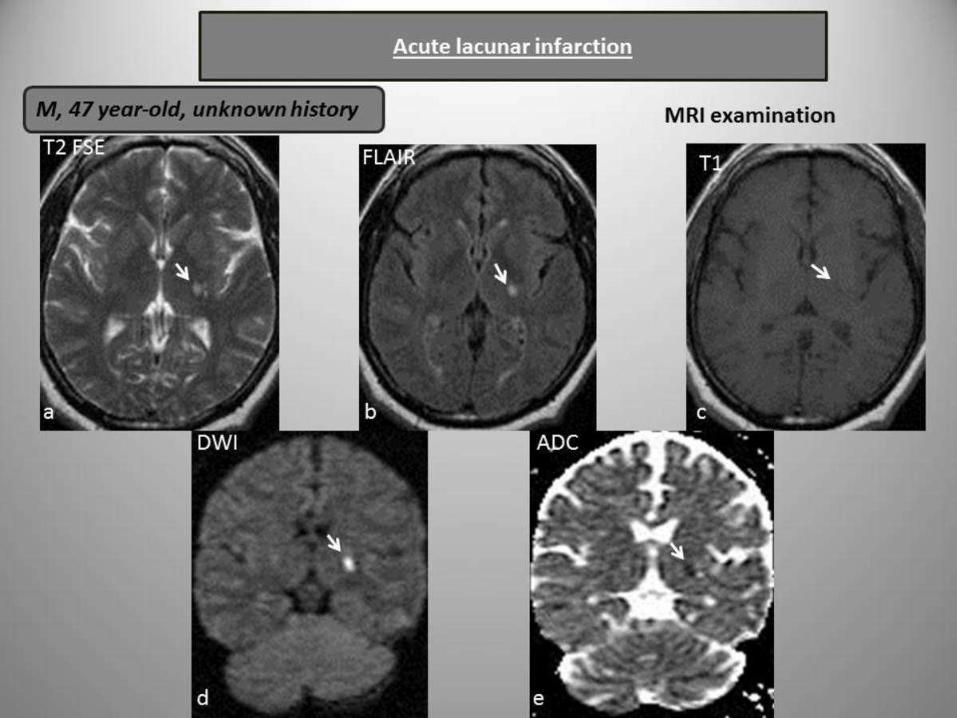
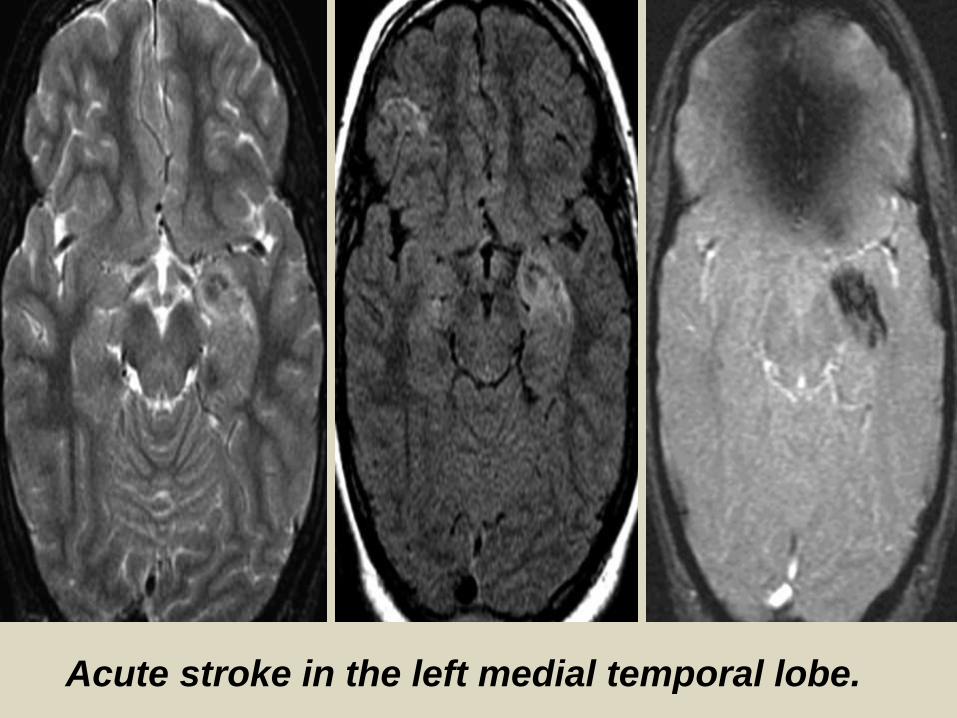
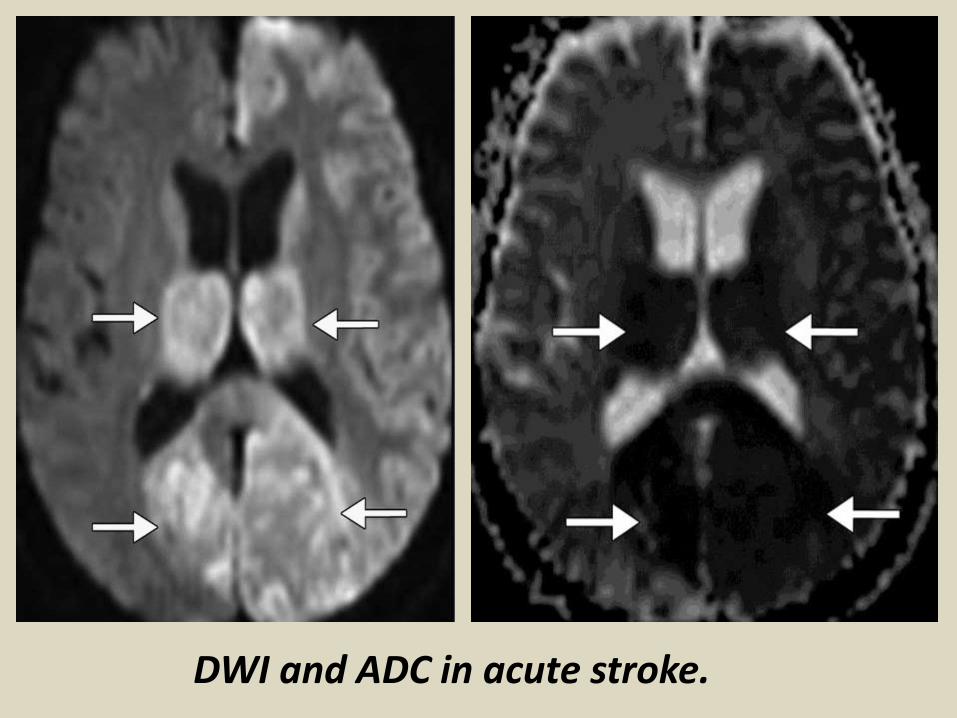
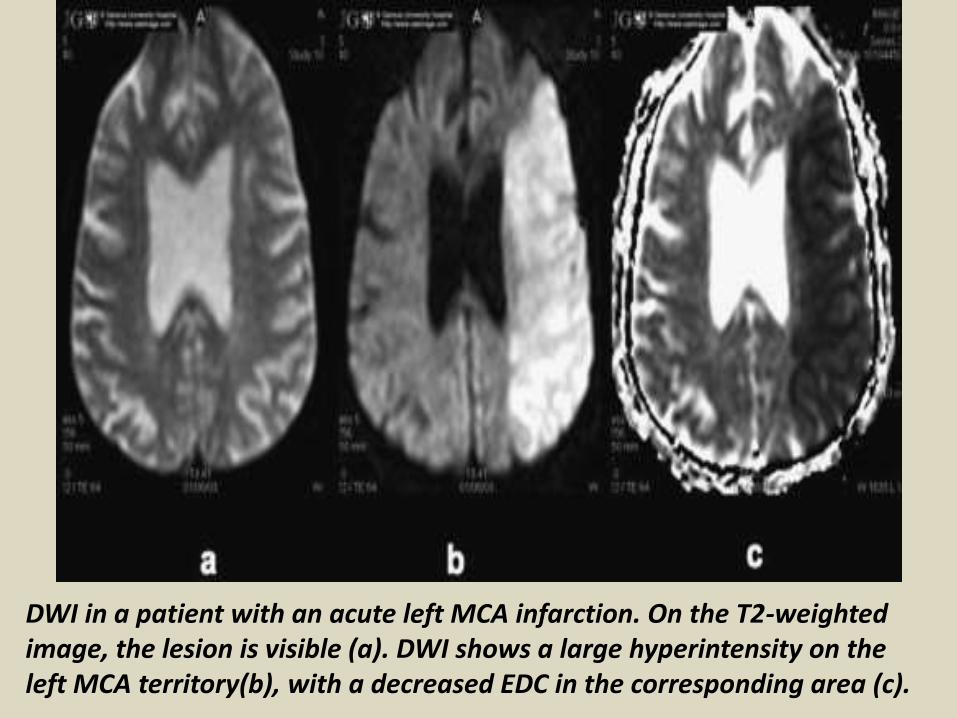
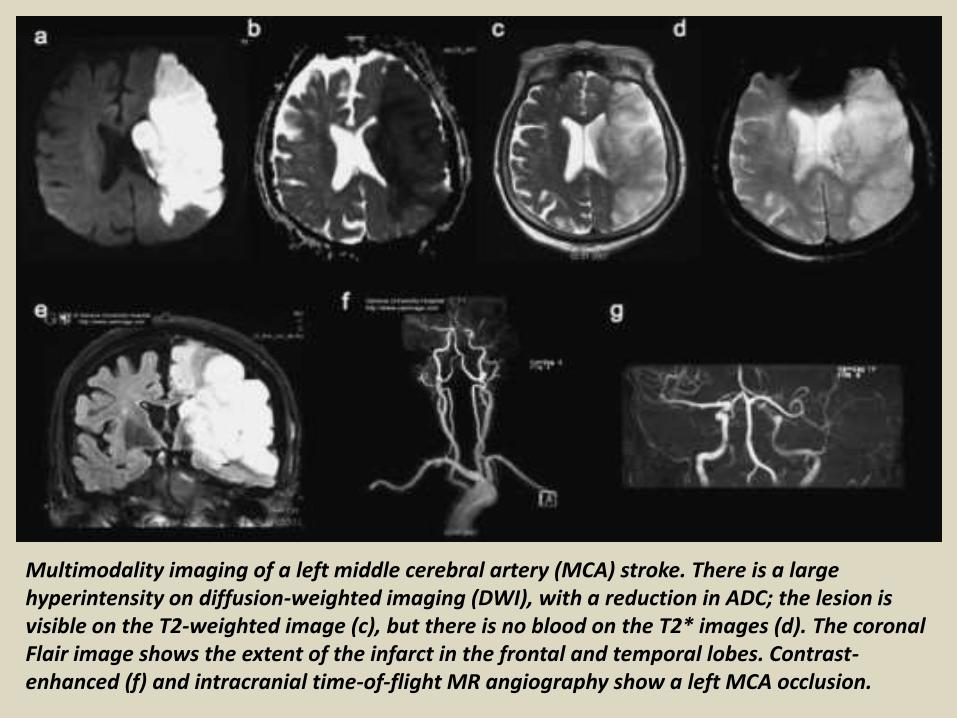
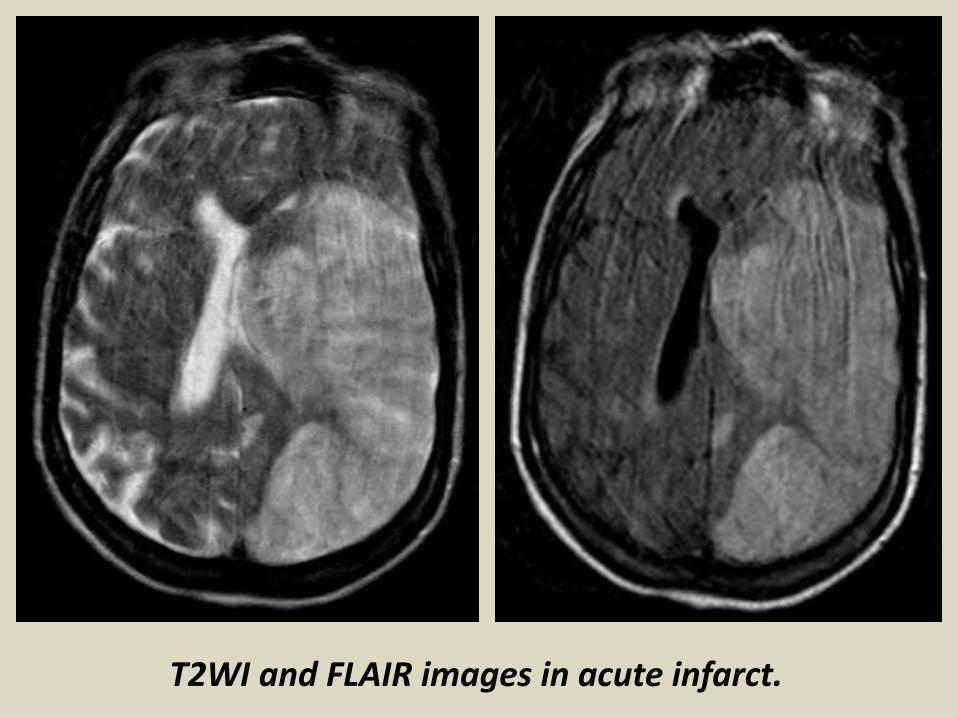
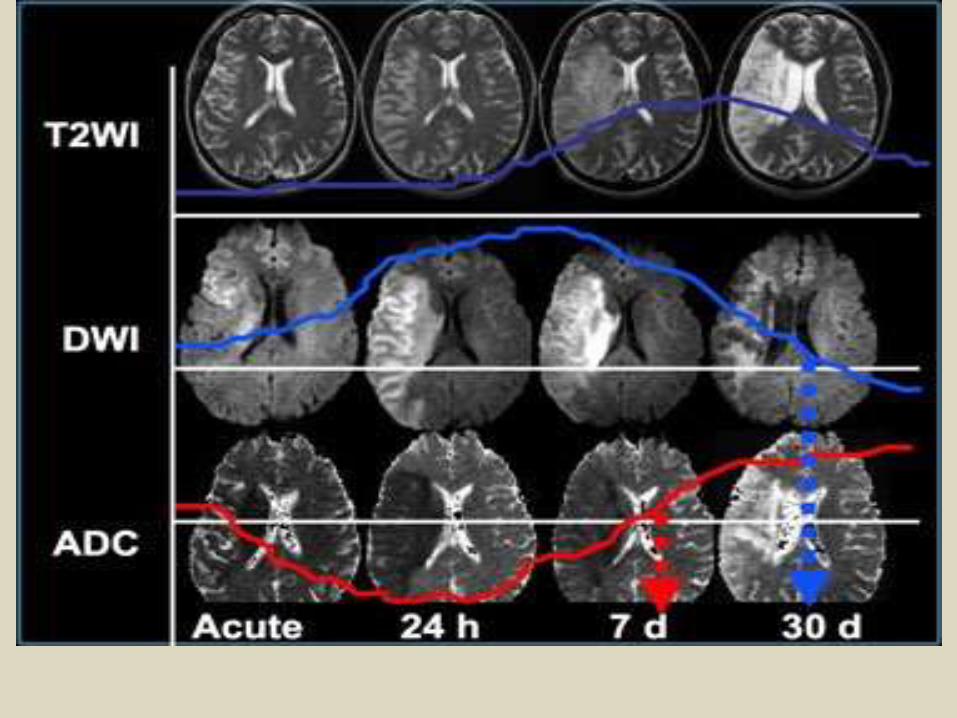
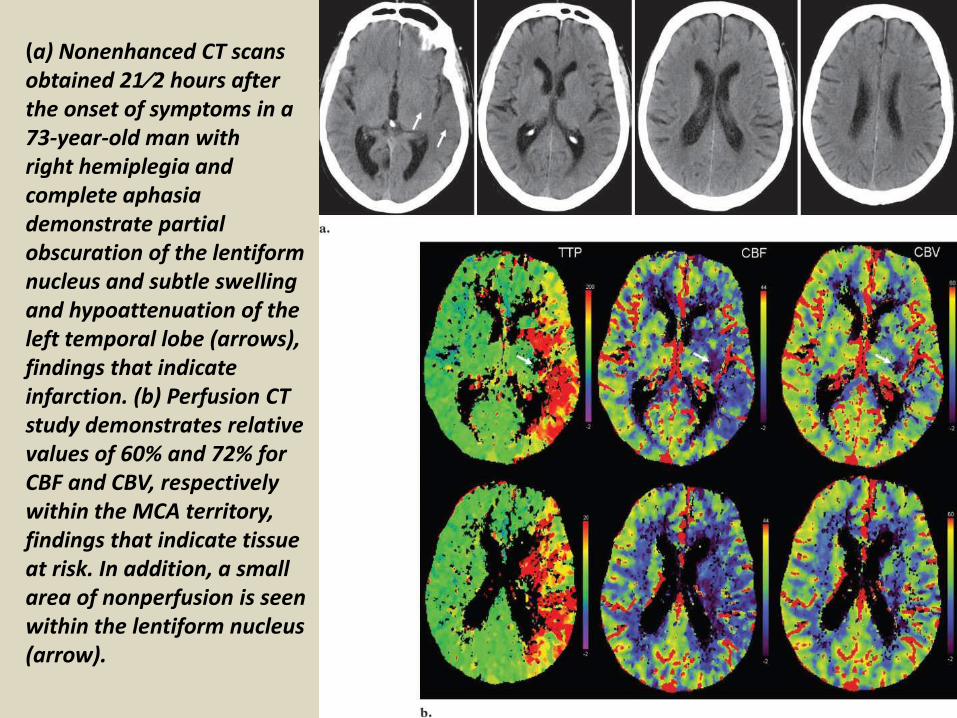
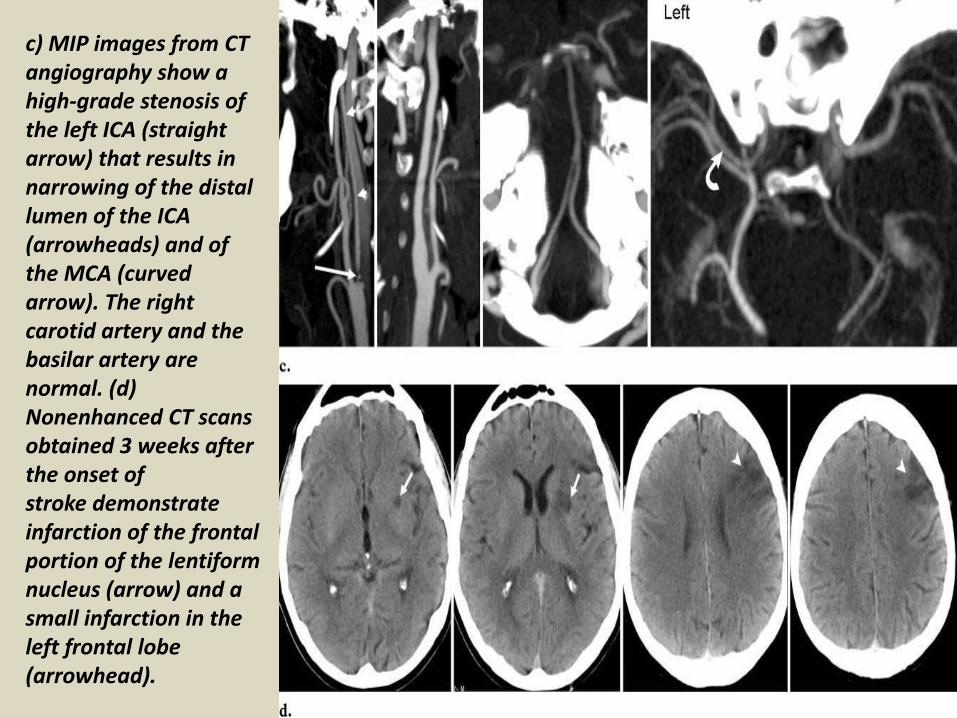
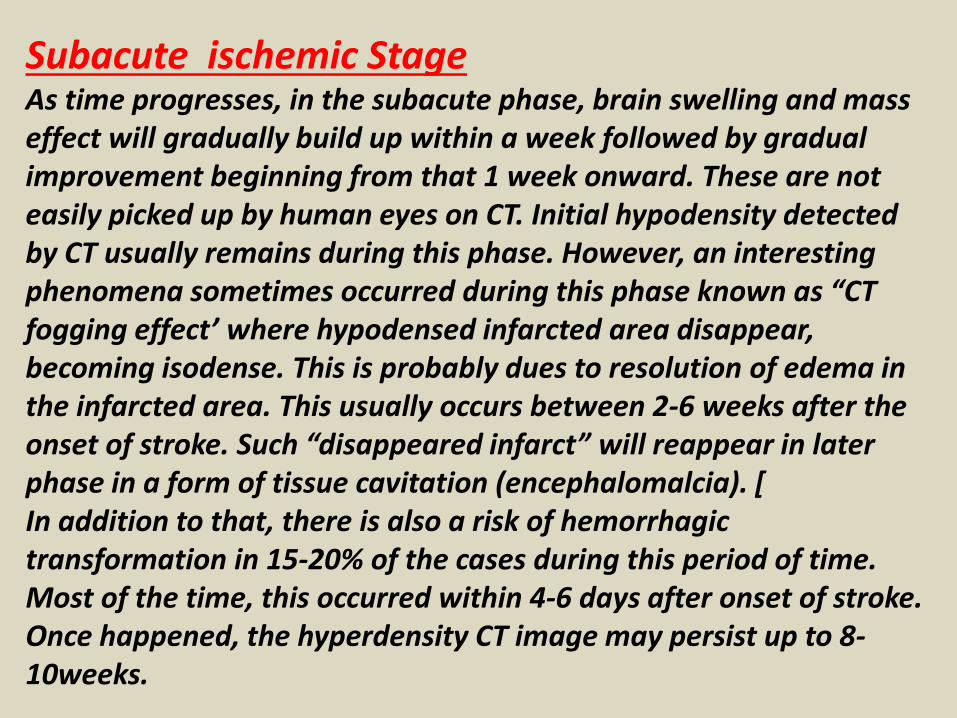
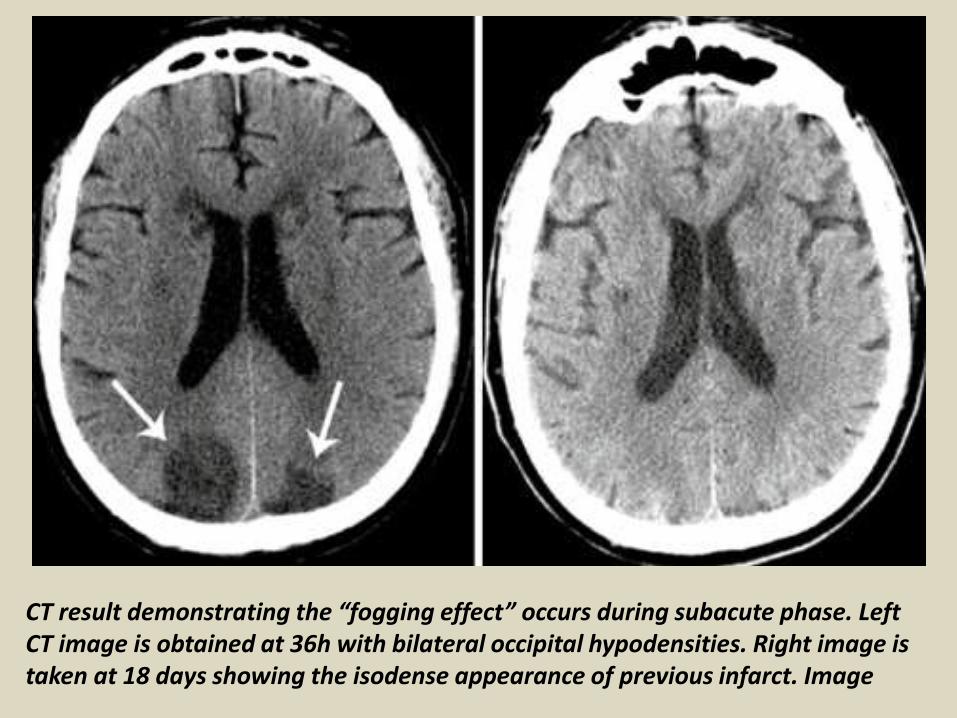
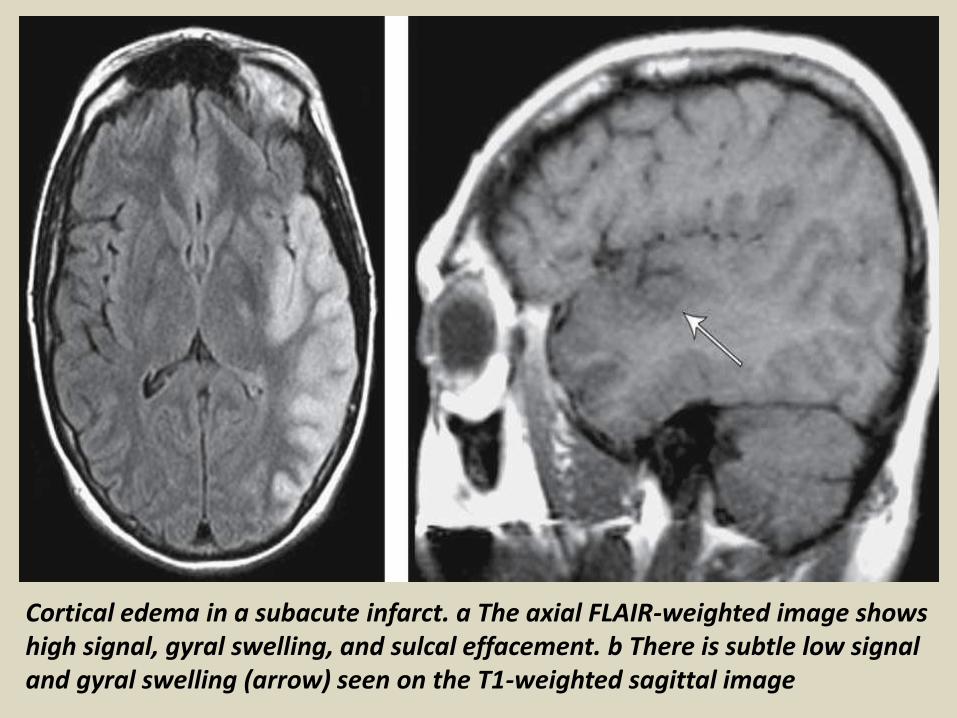
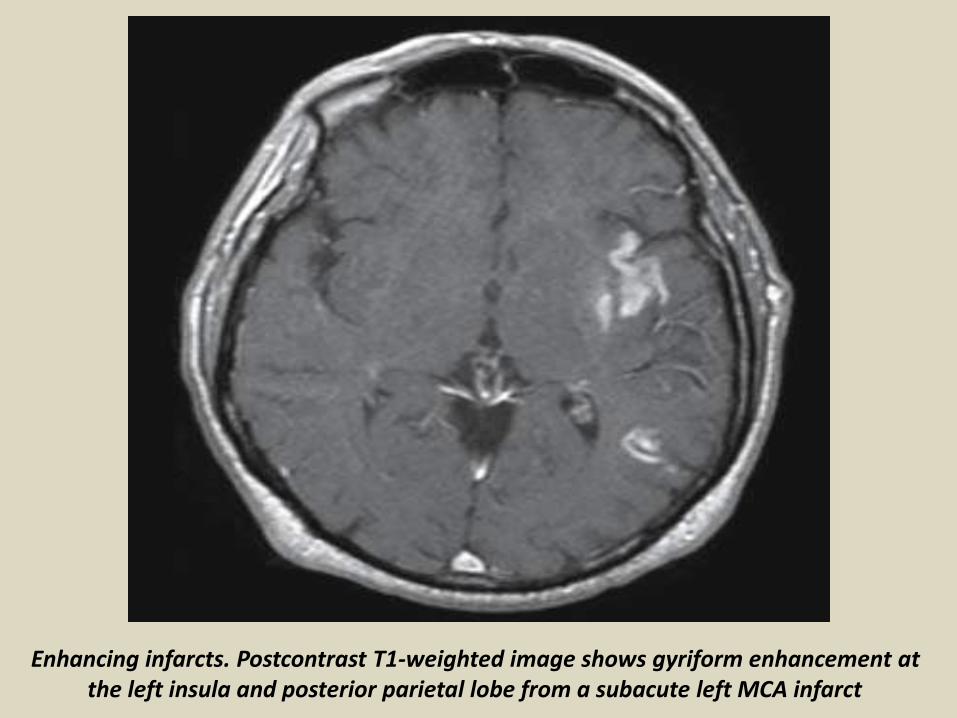
Thank You