presentazione standard di powerpoint - icca · 2014-02-12 · cagr 03/12 average size cagr 03/12...
TRANSCRIPT

Welcome to ICCA Mediterranean Chapter
SUMMIT ROME, 2nd – 4th February, 2014
Our first 40 years...
Italian members were
crucial supporters for the
foundation of ICCA
Med Chapter
from STUDIO EGA
ICCA Member since
April, 26th 1977

some boring figures

0
50.000
100.000
150.000
200.000
250.000
2003
2012
boring figures estimated total number of participants (countries)
Source: EGA elaboration of ICCA data

0%
2%
4%
6%
8%
10%
12%
boring figures compound annual growth rate (number of participants)
Source: EGA elaboration of ICCA data
Average CAGR 03/12: 6,5%

0
50.000
100.000
150.000
200.000
250.000
2003
2012
boring figures estimated total number of participants (cities)
Source: EGA elaboration of ICCA data

-20%
-15%
-10%
-5%
0%
5%
10%
15%
-5% 0% 5% 10% 15% 20%
Florence
AthensLondon
Dubrovnik
Istanbul
Rome
Madrid
Paris
Amsterdam
Berlin
Vienna
CAGR 03/12 Average Size
Florence
AthensLondon
Dubrovnik
Istanbul
Rome
Madrid
Paris
Amsterdam
Berlin
Vienna
CAGR 03/12 Average Size
CAGR 03/12 Number of Meetings
boring figures cities trend of performances
Source: EGA elaboration of ICCA data Bubbles size = market share 2012 (participants)
Average CAGR: -2,5%
Average CAGR: +6,1%
Milan
Size
N. of Meetings
Size
N. of Meetings Size
N. of Meetings
Size
N. of Meetings

Source: University of Rome Tor Vergata, 2011
boring figures key factors in the evaluation process of destination by PCOs
0
0,2
0,4
0,6
0,8
1
1,2
Cap
acità
spa
zi con
gres
suali
Qua
lità
spaz
i con
gres
suali
Qua
lità
spaz
i esp
ositivi
F&B
Imm
agine
dell'o
fferta
di s
pazi con
gres
suali
Cos
to d
egli sp
azi c
ongr
essu
ali
Vissu
to d
egli sp
azi c
ongr
essu
ali
Qua
lità
della
Ricet
tività
Prezz
i della R
icet
tività
Qua
lità
della
ristor
azione
Prezz
i dei ser
vizi
Attrat
tori
Acces
sibillit
à
Mob
ilità
Vissu
to d
ella d
estin
azione
Imm
agine
della
des
tinaz
ione
Media

0,80
0,85
0,90
0,95
1,00
1,05
Capacità spazi congressuali
Qualità spazi congressuali
Qualità spazi espositivi
F&BImmagine dell'offerta di spazi
congressuali
Costo degli spazi congressuali
Vissuto degli spazi congressuali
Roma Media
boring figures rome congress centres performance on key factors
Source: University of Rome Tor Vergata, 2011
capacity of meeting spaces
quality of meeting spaces
quality of exhibition spaces
F&B perception of meeting spaces
cost of meeting spaces
experience of meeting spaces
rome average

0,80
0,85
0,90
0,95
1,00
1,05
Qualità della Ricettività
Prezzi della Ricettività
Qualità della ristorazione
Prezzi dei servizi
AttrattoriAccessibillità
Mobilità
Vissuto della destinazione
Immagine della destinazione
Roma Media
boring figures rome destination performance on key factors
Source: University of Rome Tor Vergata, 2011
quality of hotels
hotel rates
quality of food
cost of services
attracting factors accessibility
mobility
experience of the destination
image of the destination
rome average

milan
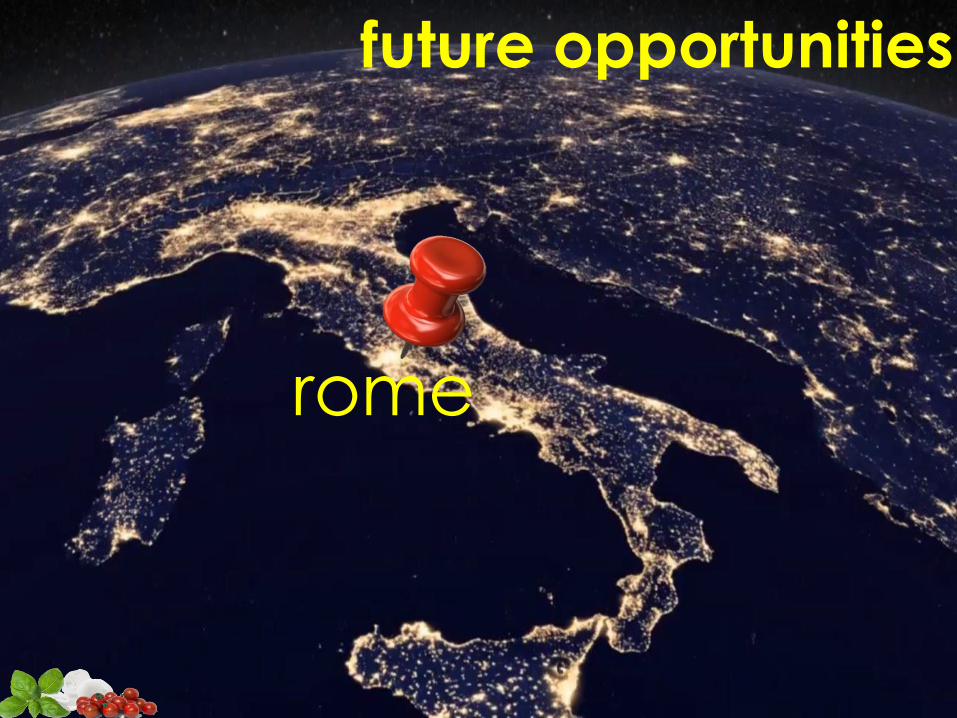
future opportunities

142 participant countries
88% of world population
21 mln expected visitors ( 30% from abroad)
500.000 beds within 90 min distance from Milan
142 participant countries
88% of world population
21 mln expected visitors ( 30% from abroad)
500.000 beds within 90 min distance from Milan

In the heart of Milan/Designed in 2002 and double-sized in 2005/18.000 delegates total capacity/70 rooms/2 plenary rooms up to 4.000/Auditorium up to 1.500/54.000 sq m of exhibition space/12-15 international congresses per year/35-50 corporate events per year
MiCo – Milano Congressi
future opportunities
rome
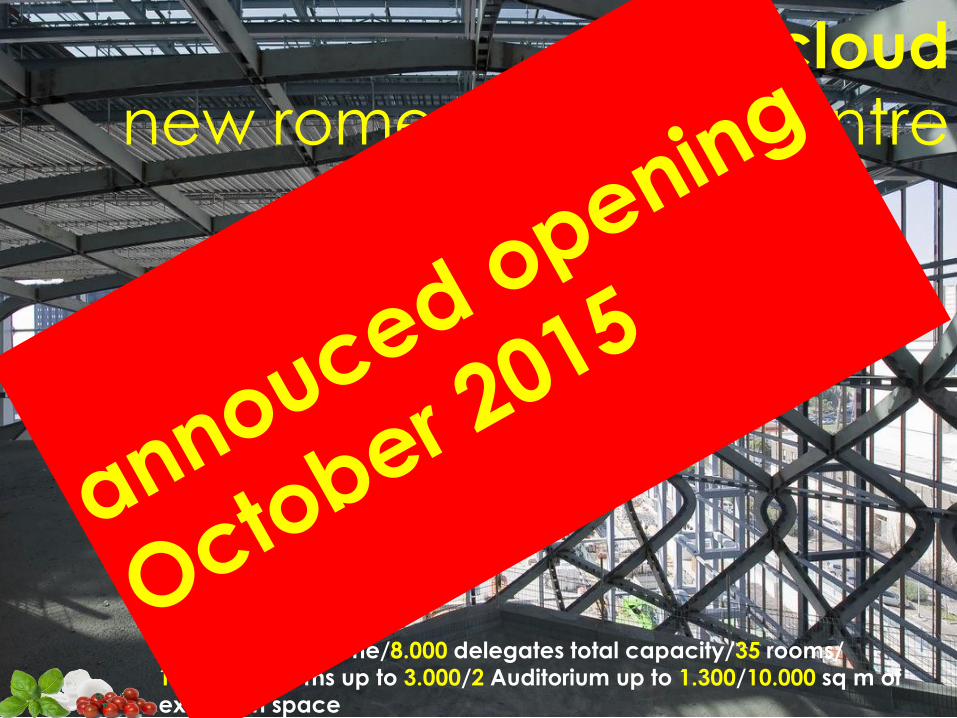
the cloud new rome congress centre
In the heart of Rome/8.000 delegates total capacity/35 rooms/ 1 plenary rooms up to 3.000/2 Auditorium up to 1.300/10.000 sq m of
exhibition space

Thanks enjoy your stay in rome!
emma aru, president of ega