presented by eugene silberstein, m.s., cmhe, beap suffolk county community college cengage learning...
TRANSCRIPT

Presented by
Eugene Silberstein, M.S., CMHE, BEAP
Suffolk County Community College
Cengage Learning
HVAC EXCELLENCE EDUCATORS CONFERENCE
SOUTH POINT HOTEL & CASINO
MARCH 31 – APRIL 2, 2014

If we change the way we look at things, the things
we look at change


IXS


Chocolate Pudding

1 x 1 x 72
1 x 2 x 36
1 x 3 x 24
1 x 4 x 18
1 x 6 x 12
1 x 8 x 9
2 x 2 x 18
2 x 3 x 12
2 x 4 x 9
2 x 6 x 6
3 x 4 x 6
3 x 3 x 8
743928231918
221715141314


Pressure
Heat Content
(psia)
Btu/lb
LINES OF CONSTANT PRESSURELINES OF CONSTANT ENTHALPY
HEAT CONTENT INCREASES
HEAT CONTENT DECREASES
PRESSURE RISES
PRESSURE DROPS

Pressure
Heat Content
(psia)
Btu/lbBtu/lb
SATURATION CURVE

THE SATURATION CURVE
• Under the curve, the refrigerant follows the pressure-temperature relationship
• The left side of the saturation curve represents 100% liquid
• The right side of the saturation curve represents 100% vapor
• For non-blended refrigerants, one pressure corresponds to one temperature
Pressure
Heat Content
(psia)
Btu/lb
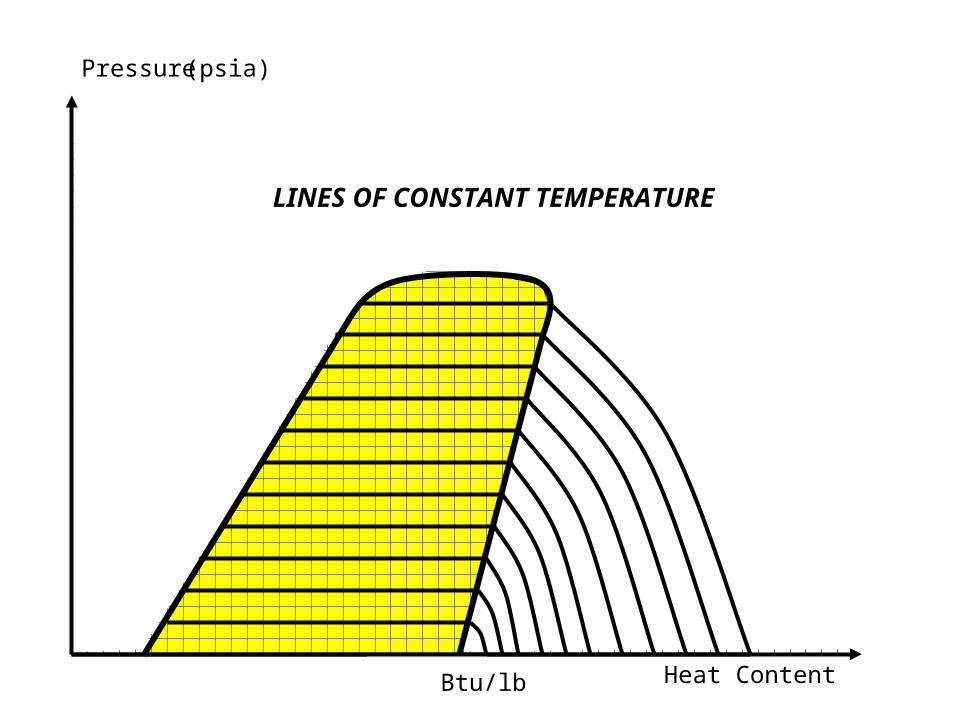
LINES OF CONSTANT TEMPERATURE

Pressure
Heat Content
(psia)
Btu/lb
LINES OF CONSTANT VOLUME (ft3/lb)

Pressure
Heat Content
(psia)
Btu/lb
LINES OF CONSTANT ENTROPY

Pressure
Heat Content
(psia)
Btu/lb
LINES OF CONSTANT QUALITY

Pressure
Heat Content
(psia)
Btu/lb
PUT IT ALL TOGETHER…

0°F
20°F
40°F
60°F
80°F
100°F
120°F
140°F
12 20 25 31 35 8 8 8 8 8 9 9 9 9 9 1 1 1 1 1
24
36
52
72
99
132
172
221
0 2 4 6 8 0 2 4 6 8 0 0 0 0 0
0 2 4 6 8Enthalpy in btu/lb (Heat Content)
Pressure (psia)
Pressure-Enthalpy (p-h) Diagram for R-12 (Simplified)
160°F

0°F
20°F
40°F
60°F
80°F
100°F
120°F
140°F
15 24 31 40 46
39
58
84
117
159
211
275
352
Enthalpy in btu/lb (Heat Content)
Pressure (psia)
Pressure-Enthalpy (p-h) Diagram for R-22 (Simplified)
160°F
110
112
123
119

0°F
20°F
40°F
60°F
80°F
100°F
120°F
140°F
13 28 45
63
93
133
186
251
334
434
557
Enthalpy in btu/lb (Heat Content)
Pressure (psia)
Pressure-Enthalpy (p-h) Diagram for R-410A (Simplified)
160°F
123 133 143 140 21 37 53
148 152

REPEATING vs. NON-REPEATING CYCLES

High Pressure High Temperature
High Pressure High Temperature
Low Pressure Low Temperature
Low Pressure Low Temperature
Liquid
Liquid
Vapor
Vapor
COMPRESSOR
CONDENSER
METERING DEVICE
EVAPORATOR

COMPRESSOR
CONDENSER
METERING DEVICE
EVAPORATOR
Superheated VaporSubcooled Liquid Saturated Refrigerant

Superheated Region
Saturated Region
Subcooled Region
Pressure
Heat Content

Pressure
Heat Content

Pressure
Heat Content
(psia)
Btu/lb

Saturation
Height Above Saturation
VAPORLIQUID

Saturation
Distance Below Saturation
VAPORLIQUID

Pressure
Heat Content
(psia)
Btu/lb

Pressure
Heat Content
(psia)
Btu/lb
PUT IT ALL TOGETHER…
A
B C D
E

Pressure
Heat Content
(psia)
Btu/lb
PUT IT ALL TOGETHER…
A
B C D
EA
B C D
E
E to A: CONDENSER (Including discharge and liquid line)
A to B: METERING DEVICE
B to C: EVAPORATOR
C to D: SUCTION LINE
D to E: COMPRESSOR

A
B C D
E
NET REFRIGERATION EFFECT
The portion of the system that provides the desired cooling or conditioning of the space or products being
treated.

NET REFRIGERATION EFFECT
• The larger the NRE, the greater the heat transfer rate per pound of refrigerant circulated
• NRE is in the units of btu/lb
• Cooling effect can be increased by increasing the NRE or by increasing the mass flow rate
• The cooling effect can be decreased by decreasing the NRE or by decreasing the rate of refrigerant circulation through the system

NRE Example
• Heat Content at point B = 35 btu/lb
• Heat Content at point C = 85 btu/lb
• NRE = C – B = 85 btu/lb – 35 btu/lb
NRE = 50 btu/lb
• Each pound of refrigerant can therefore hold 50 btu of heat energy
• How many btu does it take to make 1 ton?

How Many btu = 1 Ton?• 12,000 btu/hour = 1 Ton = 200 btu/min
• From the previous example, how many lb/min do we have to move through the system to get 1 ton?
• 200 btu/min/ton ÷ 50 btu/lb = 4 lb/min
• We must circulate 4 pounds of refrigerant through the system every minute to obtain one ton of refrigeration
• Mass Flow Rate Per Ton

NRE and MFR/ton• The NRE determines the number of btu that a
pound of refrigerant can hold
• The larger the NRE the more btu can be held by the pound of refrigerant
• As the NRE increases, the MFR/ton decreases
• As the NRE decreases, the MFR/ton increases
• NRE = Heat content at C – Heat content at B
• MFR/ton = 200 ÷ NRE
• Cool, huh?


A
B C D
E
THE SUCTION LINE
The line that connects the outlet of the evaporator to the inlet of the compressor. This line is field installed
on split-type air conditioning systems.

SUCTION LINE • The suction line should be as short as possible
• The amount of heat introduced to the system through the suction line should be minimized
• Damaged suction line insulation increases the amount of heat added to the system and decreases the system’s operating efficiency
• Never remove suction line insulation without replacing
• Seal the point where insulation sections meet

A
B C D
E
D
E

A
B C D
E
HEAT OF WORK
The quantity, in btu/lb that represents the amount of heat that is added to the refrigerant during the
compression process.
HEAT OF WORK (HOW)• The HOW indicates the amount of heat added
to a pound of refrigerant during compression
• As the pressure of the refrigerant increases, the heat content of the refrigerant increases as well
• Heat gets concentrated in the compressor
• As HOW increases, efficiency decreases
• As HOW decreases, system efficiency increases
• HOW = Heat content at E – Heat content at D

A
B C D
E
HEAT OF COMPRESSION
The quantity, in btu/lb that represents the amount of heat that is added to the system, outside of the
evaporator

HEAT OF COMPRESSION (HOC)
• The HOW indicates the amount of heat added to a pound of refrigerant outside the evaporator
• Comprised of the HOW and the suction line
• As HOC increases, efficiency decreases
• As HOC decreases, system efficiency increases
• HOW = Heat content at E – Heat content at C

A
B C D
E
TOTAL HEAT OF REJECTION
The quantity, in btu/lb that represents the amount of heat that is removed from the system. THOR includes
the discharge line, condenser and liquid line.

TOTAL HEAT OF REJECTION (THOR)
• THOR indicates the total amount of heat rejected from a system
• Refrigerant (hot gas) desuperheats when it leaves the compressor (sensible heat transfer)
• Once the refrigerant has cooled down to the condensing temperature, a change of state begins to occur (latent heat transfer)
• After condensing, refrigerant subcools• THOR = Heat content at E – Heat content at A• THOR = NRE + HOC

SUBCOOLING & FLASH GAS
• Subcooling is a good thing, right?
• Flash gas is a good thing, right?
• Are flash gas and subcooling related?
• How can we tell?
• Stay tuned...

A
B C D
E
HIGH SUBCOOLING....
(Only a slight Exaggeration)
What happened to the amount of flash gas?

A
B C D
E
LARGE AMOUNT OF FLASH GAS....
(Only a slight Exaggeration)
What happened to the subcooling?

SUBCOOLING & FLASH GAS
• Subcooling and flash gas are inversely related to each other
• As the amount of subcooling increases, the percentage of flash gas decreases
• As the percentage of flash gas increases, the amount of subcooling decreases

A
B C D
E
COMPRESSION RATIO
Determined by dividing the high side pressure (psia) by the low side pressure (psia)
High-side pressure
Low-side pressure

COMPRESSION RATIO
• Represents the ratio of the high side pressure to the low side pressure
• Directly related to the amount of work done by the compressor to accomplish the compression process
• The larger the compression ratio, the larger the HOW and HOC and the lower the system MFR
• The larger the HOW and HOC, the lower the system efficiency
• Absolute pressures must be used

ABSOLUTE PRESSURE
• Absolute pressure = Gauge pressure + 14.7
• Round off to 15, for ease of calculation
• Example 1– High side pressure (psig) = 225 psig– High side pressure (psia) = 225 + 15 = 240 psia– Low side pressure (psig) = 65 psig– Low side pressure (psia) = 65 + 15 = 80 psia– Compression ratio = 240 psia ÷ 80 psia = 3:1

Low Side Pressure in a Vacuum?
• First, convert the low side vacuum pressure in inches of mercury to psia
• Use the following formula
(30” Hg – vacuum reading) ÷ 2
• Example– High side pressure = 245 psig– High side pressure (psia) = 245 + 15 = 260 psia– Low side pressure = 4”Hg– Low side (psia) = (30”hg – 4”Hg) ÷ 2 = 13 psia– Compression ratio = 260 ÷ 13 = 20:1

Meet Tammy…
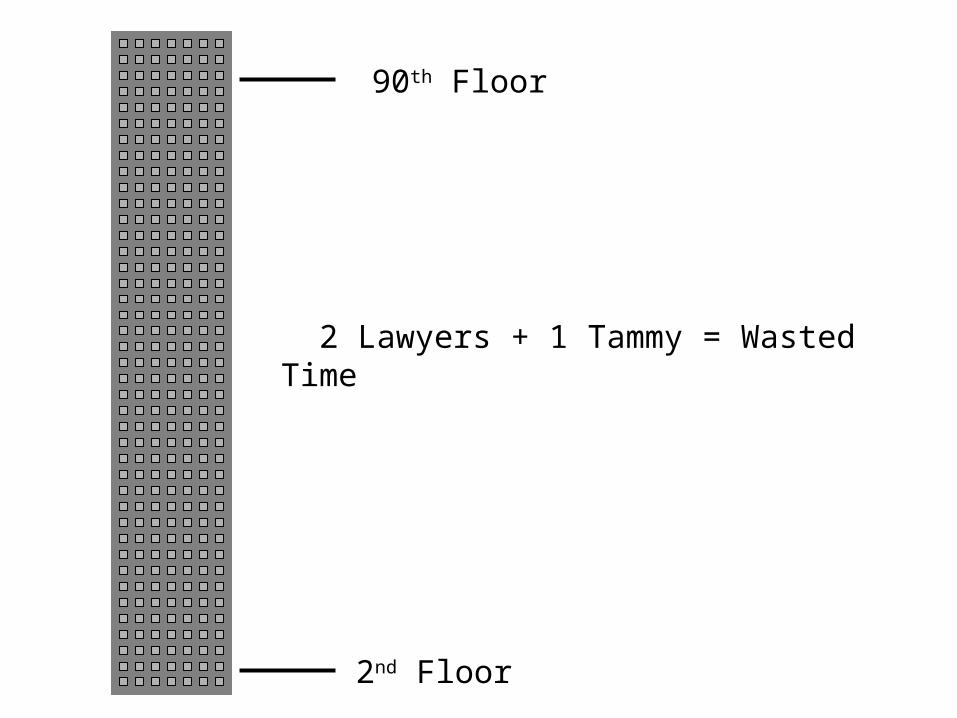
2nd Floor
90th Floor
2 Lawyers + 1 Tammy = Wasted Time


Tammy’s 8-Hour Day• 9am – 10 am Work on 2nd Floor
• 10am – 11am Walk up
• 11am – 12 noon Work on 90th Floor
• 12 noon – 1pmWalk down
• 1 pm – 2pm Lunch
• 2pm – 3 pm Work on 2nd Floor
• 3 pm – 4 pm Walk up
• 4pm – 5 pm Work on 90th Floor

Hmmmmmmmmmmmm
• What if the law firm moves its 90th floor office to the 3rd floor?
• How will this affect Tammy’s productivity?
• Will she do more work? Less?
• What the heck does this have to do with air conditioning?
• How many licks does it take to get to the chocolaty center of a Tootsie Pop?

If Tammy’s office moves from the 90th floor to the 3rd floor, we
get something like this….

Tammy’s 8-Hour Day• 9:00 am – 10:00 am Work on 2nd Floor • 10:00 am – 10:05 am Walk up to 3rd Floor• 10:05 am – 11:05 noon Work on 3rd Floor• 11:05 am – 11:10 am Walk down to 2nd Floor• 11:10 am – 12:10 pm Work on 2nd Floor• 12:10 pm – 1:10 pm Lunch• 1:10 pm – 1:15 pm Walk up to 3rd Floor• 1:15 pm – 2:15 pm Work on 3rd Floor• 2:15 pm – 2:20 pm Walk down to 2nd Floor• 2:20 pm – 3:20 pm Work on 2nd Floor• 3:20 pm – 3:25 pm Walk up to 3rd Floor• 3:25 pm – 4:25 pm Work on 3rd Floor• 4:25 pm – 4:30 pm Walk down to 2nd Floor• 4:30 pm – 5:00 pm Work on 2nd Floor

Office Comparison
• 2nd Floor 90th Floor– 4 hours of work– 3 hours of walking up
and down the stairs– 1 hour lunch– Day ends on the 90th
Floor
• 2nd Floor 3rd Floor– 6 ½ hours of work– 30 minutes of walking
up and down the stairs– 1 hour lunch– Day ends on the 2nd
Floor
Which is better?

COMPRESSION RATIO
• Lower compression ratios higher system efficiency
• Higher compression ratios lower system efficiency
• The closer the head pressure is to the suction pressure, the higher the system efficiency, all other things being equal and operational

Causes of High Compression Ratio (High Side Issues)
• Dirty or blocked condenser coil
• Recirculating air through the condenser coil
• Defective condenser fan motor
• Defective condenser fan motor blade
• Defective wiring at the condenser fan motor
• Defective motor starting components (capacitor) at the condenser fan motor

Causes of High Compression Ratio (Low Side Issues)
• Dirty or blocked evaporator coil• Dirty air filter• Defective evaporator fan motor• Dirty blower wheel (squirrel cage)• Defective wiring at the evaporator fan motor• Closed supply registers• Blocked return grill• Loose duct liner• Belt/pulley issues

THEORETICAL HORSEPOWER PER TON
• Determines how much compressor horsepower is required to obtain 1 ton of cooling
• The ft-lb is a unit of work
• The ft-lb/min is a unit of power
• 33,000 ft-lb/min = 1 Horsepower
• The conversion factor between work and heat is 778 ft-lb/btu
• 33,000 ft-lb/min/hp ÷ 778 ft-lb/btu =
42.42 btu/min/hp
THEORETICAL HORSEPOWER PER TON
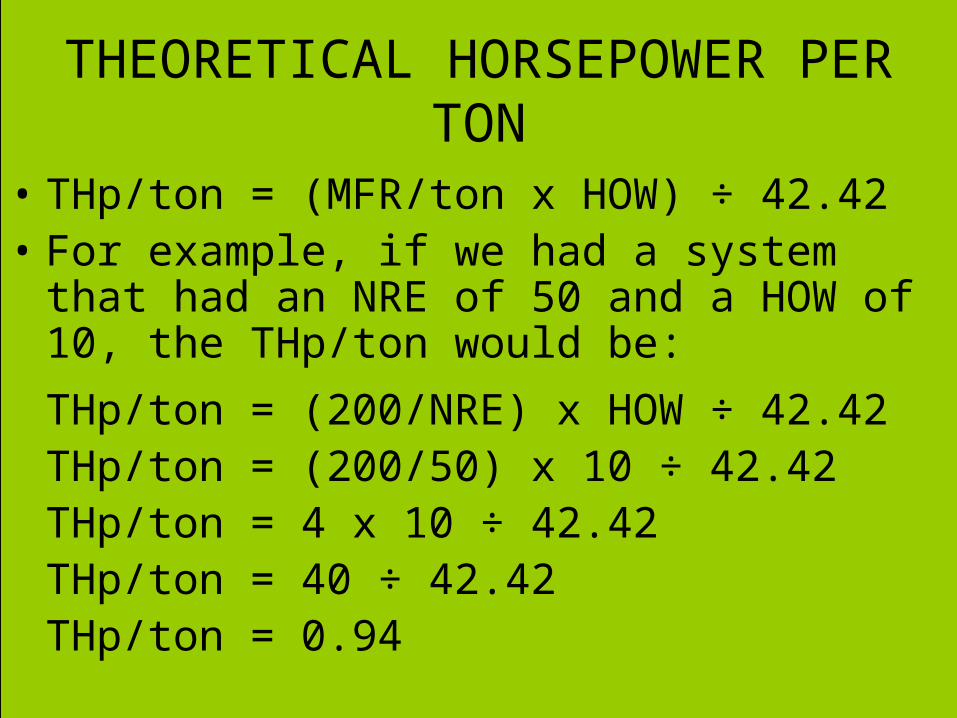
• THp/ton = (MFR/ton x HOW) ÷ 42.42• For example, if we had a system that had an
NRE of 50 and a HOW of 10, the THp/ton would be:
THp/ton = (200/NRE) x HOW ÷ 42.42THp/ton = (200/50) x 10 ÷ 42.42THp/ton = 4 x 10 ÷ 42.42
THp/ton = 40 ÷ 42.42THp/ton = 0.94


THp/ton Example
• If we had a 20-Hp reciprocating compressor and the THp/ton calculation yielded a result of 2 hp/ton, what would the expected cooling capability of the system be?
10 TONS16 TONS
5 TONS
25 TONS
3,492 TONS1 TON
3.8 TONS
20 TONS

What Affects the THp/ton Number?
• The Net Refrigeration Effect (NRE)
• The Heat of Work (HOW)
What Affects the NRE and HOW?
• Suction pressure
• Discharge pressure
• Compression Ratio
• Airflow through the coils
• Blowers and fans
• And so on, and so on, and so on, and so on….

Get the Picture?

MASS FLOW RATE OF THE SYSTEM• The amount of refrigerant that flows past any
given point in the system every minute
• Not to be confused with MFR/ton
• MFR/system is the actual refrigerant flow, while MFR/ton is the flow per ton
• MFR/system can be found by multiplying the MFR/ton by the number of tons of system capacity, or
MFR/system = (42.42 x Compressor HP) ÷ HOW

COOL STUFF• As the HOW increases, the MFR/system
decreases, and vice versa• As the Compression Ratio increases, the
HOW increases• As head pressure increases, or as suction
pressure decreases, the Compression Ratio increases
• As the MFR/system decreases, the capacity of the evaporator, condenser and compressor all decrease
• Let’s take a closer look…

EVAPORATOR CAPACITY• A function of the MFR/system and the NRE
• The MFR/system is in lb/min, the NRE is in btu/lb and the capacity of the evaporator is in btu/hour
Evaporator Capacity = MFR/system x NRE x 60
Btu Lb Btu 60 Min Hour Min Lb Hour

EVAPORATOR CAPACITY
• If the NRE or the MFR/system decreases, the evaporator capacity also decreases
• The “60” is a conversion factor from btu/min to btu/hour, given that there are 60 minutes in an hour
• Divide the evaporator capacity in btu/hour by 12,000 to obtain the evaporator capacity in tons

CONDENSER CAPACITY• A function of the MFR/system and the THOR
• The MFR/system is in lb/min, the THOR is in btu/lb and the capacity of the condenser is in btu/hour
Condenser Capacity = MFR/system x THOR x 60
Btu Lb Btu 60 Min Hour Min Lb Hour

COMPRESSOR CAPACITY• A function of the MFR/system and the
Specific volume of the refrigerant at the inlet of the compressor
• Calculated in cubic feet per minute, ft3/min
Compresser Capacity = MFR/system x Specific Volume
ft3 Lb ft3
Min Min Lb

COEFFICIENT OF PERFORMANCE (COP)
• The ratio of the NRE compared to the HOC
• If the HOC remains constant, any increases in NRE will increase the COP
• If the NRE remains constant, any decrease in HOC will increase the COP
• The COP is a contributing factor to the EER of an air conditioning system
• COP is a unitless value

COP EXAMPLE
• Heat content at point B = 35 btu/lb
• Heat content at point C = 104 btu/lb
• Heat content at point E = 127 btu/lb
• NRE = 104 btu/lb – 35 btu/lb = 69 btu/lb
• HOC = 127 btu/lb – 104 btu/lb = 23 btu/lb
• COP = 69 btu/lb ÷ 23 btu/lb = 3
• Notice that the “3” has no units

ENERGY EFFICIENCY RATIO (EER)
• A ratio of the amount of btus transferred to the amount of power used
• In the units of btu/watt• The conversion between btus and watts is
3.413• One watt of power generates 3.413 btu• For example, if a system required 50,000 btu of
heat, 14,650 watts of electric heat (14.65 kw) can be used
ENERGY EFFICIENCY RATIO (EER), Cont’d.
• The efficiency rating of an air conditioning system is the COP
• For each btu/lb introduced to the system in the suction line and the compressor, a number of btus equal to the NRE are absorbed into the system via the evaporator
• To convert the COP to energy usage, we multiply the COP by 3.413

EER EXAMPLE
• The NRE of a system is 70 btu/lb
• The HOC of the same system is 20 btu/lb
• The COP is 70 btu/lb ÷ 20 btu/lb = 3.5
• The EER = COP x 3.413
• EER = 3.5 x 3.413
• EER = 11.95

SEASONAL EER (SEER)
• Takes the entire conditioning system into account
• Varies depending on the geographic location of the equipment
• Ranges from 10% t0 30% higher than EER
• So, if the EER is 10, the SEER will range from 11 to 13

From the P-H Chart, We Can Find
• Compression Ratio• NRE• HOC• HOW• THOR• COP• MFR/ton
• THp/ton• MFR/system• Evaporator Capacity• Condenser Capacity• Compressor Capacity• EER of the System• SEER
Okay, Okay, Okay… How do I plot one of these things?

An R-22 A/C System…
• Condenser saturation temperature 120°F
• Condenser outlet temperature 100°F
• Evaporator saturation temperature 40°F
• Evaporator outlet temperature 50°F
• Compressor inlet temperature 60°F
• Compressor Horsepower: 4 hp

0°F
20°F
40°F
60°F
80°F
100°F
120°F
140°F
3 4 4 5 1 1 1 1 1
39
58
84
117
211
352
1 1 1 2 2 0 2 7 1 5
Enthalpy in btu/lb (Heat Content)
Pressure (psia)
Pressure-Enthalpy (p-h) Diagram for R-22 (Simplified)
180°F
160°F
-20°F
-40°F
275
159
25
2 0 6 3
0.7

0°F
20°F
40°F
60°F
80°F
100°F
120°F
140°F
3 4 4 5 1 1 1 1 1
39
58
84
117
211
352
1 1 1 2 2 0 2 7 1 5
Enthalpy in btu/lb (Heat Content)
Pressure (psia)
Pressure-Enthalpy (p-h) Diagram for R-22 (Simplified)
180°F
160°F
-20°F
-40°F
275
159
25
2 0 6 3
0.7

0°F
20°F
40°F
60°F
80°F
100°F
120°F
140°F
3 4 4 5 1 1 1 1 1
39
58
84
117
211
352
1 1 1 2 2 0 2 7 1 5
Enthalpy in btu/lb (Heat Content)
Pressure (psia)
Pressure-Enthalpy (p-h) Diagram for R-22 (Simplified)
180°F
160°F
-20°F
-40°F
275
159
25
2 0 6 3
0.7A
B C

0°F
20°F
40°F
60°F
80°F
100°F
120°F
140°F
3 4 4 5 1 1 1 1 1
39
58
84
117
211
352
1 1 1 2 2 0 2 7 1 5
Enthalpy in btu/lb (Heat Content)
Pressure (psia)
Pressure-Enthalpy (p-h) Diagram for R-22 (Simplified)
180°F
160°F
-20°F
-40°F
275
159
25
2 0 6 3
0.7A
B C D

0°F
20°F
40°F
60°F
80°F
100°F
120°F
140°F
3 4 4 5 1 1 1 1 1
39
58
84
117
211
352
1 1 1 2 2 0 2 7 1 5
Enthalpy in btu/lb (Heat Content)
Pressure (psia)
Pressure-Enthalpy (p-h) Diagram for R-22 (Simplified)
180°F
160°F
-20°F
-40°F
275
159
25
2 0 6 3
0.7A
B C D

0°F
20°F
40°F
60°F
80°F
100°F
120°F
140°F
3 4 4 5 1 1 1 1 1
39
58
84
117
211
352
1 1 1 2 2 0 2 7 1 5
Enthalpy in btu/lb (Heat Content)
Pressure (psia)
Pressure-Enthalpy (p-h) Diagram for R-22 (Simplified)
180°F
160°F
-20°F
-40°F
275
159
25
2 0 6 3
0.7A
B C D
E

0°F
20°F
40°F
60°F
80°F
100°F
120°F
140°F
3 4 4 5 1 1 1 1 1
39
58
84
117
211
352
1 1 1 2 2 0 2 7 1 5
Enthalpy in btu/lb (Heat Content)
Pressure (psia)
Pressure-Enthalpy (p-h) Diagram for R-22 (Simplified)
180°F
160°F
-20°F
-40°F
275
159
25
2 0 6 3
0.7A
B C D
E
High: 275 psia
Low: 84 psia
“A”: 40 btu/lb
“B”: 40 btu/lb
“C”: 110 btu/lb
“D”: 112 btu/lb
“E”: 125 btu/lb

High: 275 psia
Low: 84 psia
“A”: 40 btu/lb
“B”: 40 btu/lb
“C”: 110 btu/lb
“D”: 112 btu/lb
“E”: 125 btu/lb
COMPRESSION RATIO
HIGH SIDE PRESSURE (psia)
LOW SIDE PRESSURE (psia)
COMPRESSION RATIO = 275 psia ÷ 84 psia = 3.27:1

High: 275 psia
Low: 84 psia
“A”: 40 btu/lb
“B”: 40 btu/lb
“C”: 110 btu/lb
“D”: 112 btu/lb
“E”: 125 btu/lb
HEAT OF WORK
HEAT OF WORK = 125 btu/lb – 112 btu/lb = 13 btu/lb
HEAT CONTENT AT “E” – HEAT CONTENT AT “D”

High: 275 psia
Low: 84 psia
“A”: 40 btu/lb
“B”: 40 btu/lb
“C”: 110 btu/lb
“D”: 112 btu/lb
“E”: 125 btu/lb
HEAT OF COMPRESSION
HEAT OF COMPRESSION= 125 btu/lb – 110 btu/lb = 15 btu/lb
HEAT CONTENT AT “E” – HEAT CONTENT AT “C”
High: 275 psia
Low: 84 psia
“A”: 40 btu/lb
“B”: 40 btu/lb
“C”: 110 btu/lb
“D”: 112 btu/lb
“E”: 125 btu/lb
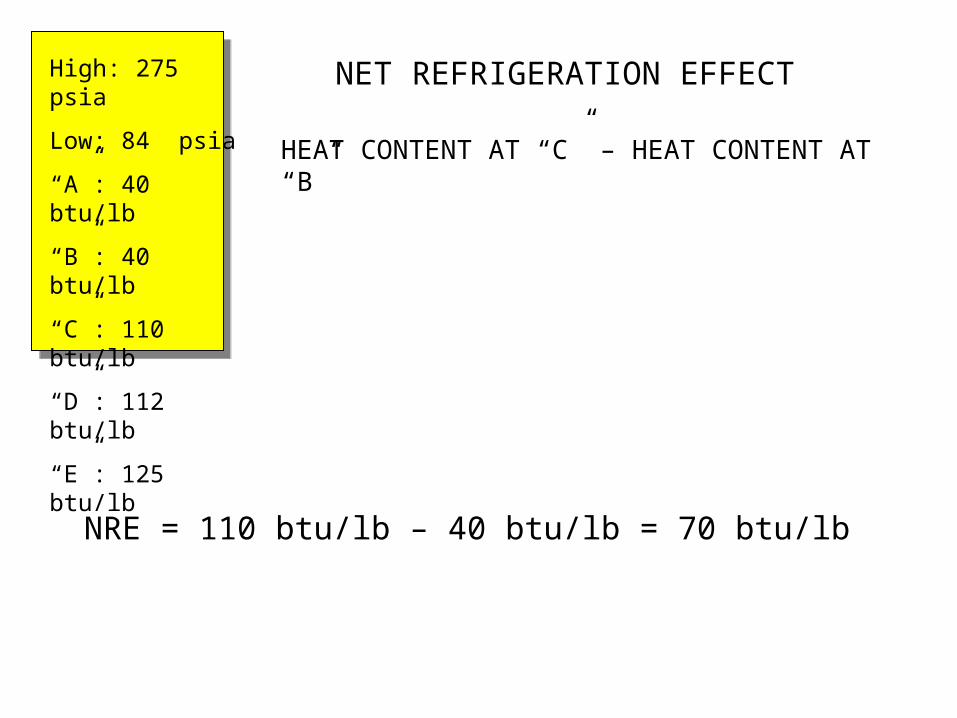
NET REFRIGERATION EFFECT
NRE = 110 btu/lb – 40 btu/lb = 70 btu/lb
HEAT CONTENT AT “C” – HEAT CONTENT AT “B”

High: 275 psia
Low: 84 psia
“A”: 40 btu/lb
“B”: 40 btu/lb
“C”: 110 btu/lb
“D”: 112 btu/lb
“E”: 125 btu/lb
MASS FLOW RATE PER TON
MFR/ton = 200 ÷ NRE =200 ÷ 70 btu/lb = 2.86 lb/min/ton
200 ÷ NRE

High: 275 psia
Low: 84 psia
“A”: 40 btu/lb
“B”: 40 btu/lb
“C”: 110 btu/lb
“D”: 112 btu/lb
“E”: 125 btu/lb
TOTAL HEAT OF REJECTION
THOR = 125 btu/lb – 40 btu/lb = 85 btu/lb
HEAT CONTENT AT “E” – HEAT CONTENT AT “A”

High: 275 psia
Low: 84 psia
“A”: 40 btu/lb
“B”: 40 btu/lb
“C”: 110 btu/lb
“D”: 112 btu/lb
“E”: 125 btu/lb
THEORETICAL HORSEPOWER PER TON
THp/ton = 2.86 lb/min/ton x 13 btu/lb ÷ 42.42 = 0.88 Hp/ton
[MFR/ton x HOW] ÷ 42.42

High: 275 psia
Low: 84 psia
“A”: 40 btu/lb
“B”: 40 btu/lb
“C”: 110 btu/lb
“D”: 112 btu/lb
“E”: 125 btu/lb
COEFFICIENT OF PERFORMANCE
COP = 70 btu/lb ÷ 15 btu/lb = 4.67
NRE ÷ HOC

High: 275 psia
Low: 84 psia
“A”: 40 btu/lb
“B”: 40 btu/lb
“C”: 110 btu/lb
“D”: 112 btu/lb
“E”: 125 btu/lb
MASS FLOW RATE OF THE SYSTEM
MFR/system = [42.42 x 4] ÷ 13 btu/lb = 13.05 lb/min
[42.42 x Compressor HP] ÷ HOW

High: 275 psia
Low: 84 psia
“A”: 40 btu/lb
“B”: 40 btu/lb
“C”: 110 btu/lb
“D”: 112 btu/lb
“E”: 125 btu/lb
CAPACITY OF THE EVAPORATOR
CAP/evap = 70 btu/lb x 13.05 x 60 = 54,810 btu/hour
NRE x MFR/system x 60
CAP/evap = 54,810 btu/hour ÷ 12,000 btu/hour/ton = 4.57 tons

High: 275 psia
Low: 84 psia
“A”: 40 btu/lb
“B”: 40 btu/lb
“C”: 110 btu/lb
“D”: 112 btu/lb
“E”: 125 btu/lb
CAPACITY OF THE CONDENSER
CAP/cond = 85 btu/lb x 13.05 x 60 = 66,555 btu/hour
THOR x MFR/system x 60
CAP/cond = 66,555 btu/hour ÷ 12,000 btu/hour/ton = 5.55 tons

High: 275 psia
Low: 84 psia
“A”: 40 btu/lb
“B”: 40 btu/lb
“C”: 110 btu/lb
“D”: 112 btu/lb
“E”: 125 btu/lb
CAPACITY OF THE COMPRESSOR
CAP/comp = 13.05 x 0.7 = 9.13 ft3/min
MFR/system x Specific Volume

High: 275 psia
Low: 84 psia
“A”: 40 btu/lb
“B”: 40 btu/lb
“C”: 110 btu/lb
“D”: 112 btu/lb
“E”: 125 btu/lb
ENERGY EFFICIENCY RATIO
EER = 4.67 x 3.413 = 15.94
COP x 3.413
SEER (low end) = 1.1 x EER = 1.1 x 15.94 = 17.5
SEER (high end) = 1.3 x EER = 1.3 x 15.94 = 20.7
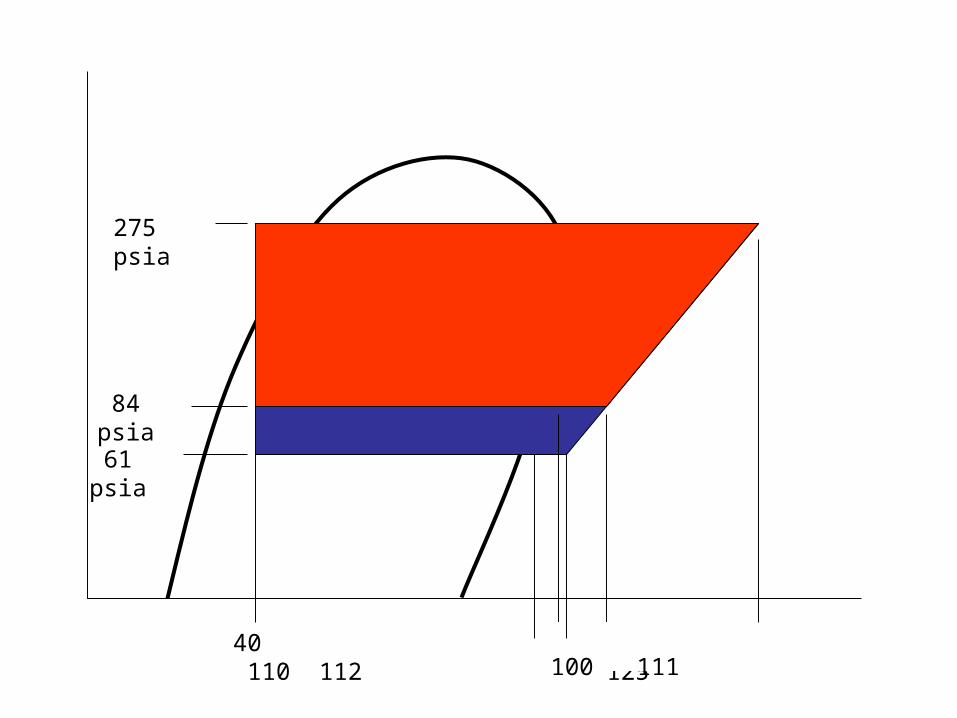
40 110 112 125
275 psia
84 psia
61 psia
100 111

Let’s See What Happened…
• CR = 3.27• HOW = 13• HOC = 15• NRE = 70• MFR/ton = 2.86 lb/min• THp/ton = 0.88• COP = 4.67• MFR/system = 13.05• CAP/evap = 66,555 btu• EER = 15.9
• CR = 4.5• HOW = 14• HOC = 25• NRE = 60• MFR/ton = 3.33 lb/min• THp/ton = 1.1• COP = 2.4• MFR/system = 12.12• CAP/evap = 43,632 btu• EER = 8.19


Properly Operating System• Heat Content “A” = 40 btu/lb• Heat Content “B” = 40 btu/lb• Heat Content “C” = 109 btu/lb• Heat Content “D” = 111 btu/lb• Heat Content “E” = 125 btu/lb• High side pressure = 267 psig• High side pressure = 282 psia• Low side pressure = 70 psig• Low side pressure = 85 psia• Compressor Hp = 2.5 Hp• Specific Volume = 0.7
• NRE = 69 btu/lb• HOW = 14 btu/lb• HOC = 16 btu/lb• THOR = 85 btu/lb• Comp. Ratio = 3.32• MFR/ton = 2.9 lb/min/ton• THp/ton = 0.96 Hp/ton• COP = 4.3• MFR/system = 7.58 lb/min• CAP/evap = 31,381 btuh• CAP/cond = 38,658 btuh• CAP/comp = 5.3 ft3/min• EER = 14.68• SEER = 16.15 – 19.1
A/B C D E


Clogged Cap Tube System• Heat Content “A” = 39 btu/lb• Heat Content “B” = 39 btu/lb• Heat Content “C” = 112 btu/lb• Heat Content “D” = 118 btu/lb• Heat Content “E” = 134 btu/lb• High side pressure = 226 psig• High side pressure = 241 psia• Low side pressure = 59 psig• Low side pressure = 74 psia• Compressor Hp = 2.5 Hp• Specific Volume = 0.9
• NRE = 73 btu/lb• HOW = 16 btu/lb• HOC = 22 btu/lb• THOR = 95 btu/lb• Comp. Ratio = 3.26• MFR/ton = 2.74 lb/min/ton• THp/ton = 1.03 Hp/ton• COP = 3.3• MFR/system = 6.63 lb/min• CAP/evap = 29,039 btuh• CAP/cond = 37,791 btuh• CAP/comp = 5.97 ft3/min• EER = 11.26• SEER = 12.39 – 14.64
A/B C D E


System Okay System Clogged Increase/Decrease
NRE 69 73 Increase
HOW 14 16 Increase
HOC 16 22 Increase
THOR 85 95 Increase
Comp. Ratio 3.32 3.26 Decrease
MFR/ton 2.9 2.74 Decrease
THp/ton 0.96 1.03 Increase
COP 4.3 3.3 Decrease
MFR/system 7.58 6.63 Decrease
CAP/evap 31,381 (2.62) 29,039 (2.42) Decrease
CAP/cond 38,658 (3.22) 37,791 (3.15) Decrease
CAP/comp 5.3 5.97 Increase
EER 14.68 11.26 Decrease
SEER 16.15 – 19.1 12.39 – 14.64 Decrease

Contact Information...
Eugene Silberstein
Suffolk County Community College
1001 Crooked Hill Road
Brentwood, NY 11717
(631) 851-6897
E-mail: [email protected]