presented by: jeff bagdade traffic engineer aaa michigan road improvement demonstration program...
Post on 21-Dec-2015
214 views
TRANSCRIPT

Road Improvement Demonstration Program
Economic Analyses
Presented By:Presented By:
Jeff BagdadeJeff BagdadeTraffic EngineerTraffic EngineerAAA MichiganAAA Michigan

Economic tool for Economic tool for comparing the benefits comparing the benefits accrued to the costs accrued to the costs incurred based on the incurred based on the number of crashes number of crashes preventedprevented
Benefit Cost AnalysisBenefit Cost Analysis

When do you conduct When do you conduct benefit cost analyses?benefit cost analyses?
1. To choose potential project locations
2. To determine which engineering countermeasures can be economically justified
3. During Post Improvement Evaluation

What are the BENEFITS?
Crashes Prevented
• Reductions in Congestion and Travel Time
• Reductions in Maintenance Costs

What are the COSTS?
• Societal Costs (National Safety Council)– Wage and Productivity Losses– Medical ExpensesInsurance Costs– Motor Vehicle Damage– Employer Costs– Loss of Quality of Life
• Operations & Maintenance Costs

What are the Current Published Societal Costs?
Fatal Collision = $3.1 million
A-Level Injury = $153,500
B-Level Injury = $39,500
C-Level Injury = $18,800
Typical Average Value used for Injuries = $34,000
Property Damage Only (PDO) = $1,800
Source: National Safety CouncilNSC on the web: www.nsc.org

How do you Calculate the Benefit Cost Ratio?
Benefits
B/C Ratio =
Costs

Choosing Potential Project Locations
MAJOR STREET
MINOR STREET
3 YEAR AVERAGE
CRITICAL3 YEAR
AVERAGECRITICAL
3 YEAR AVERAGE
CRITICAL
Forest Van Dyke 22 22 49% 40% 2.6 1.9
Plymouth Hubbell 36 22 40% 40% 4.8 1.9
Greenfield McNichols 53 8 23% 43% 9.3 1.6
Seven Mile Dequindre 37 22 22% 40% 3.7 1.9
FREQUENCY % INJURY RATE
Source: Michigan State Police
Which location should you choose?

Which Location to Choose?
Step #1 – Determine the average annual costs currently being accrued at each intersection.
Forest & Van Dyke• 11 PDO• 11 InjuriesAnnual Cost=(11*$1800)+(11*$34,000)=$393,800
BENEFIT TERM

• Step #2 – Assuming that crashes and injuries will decrease by 15% each how much will your costs decrease?
PDO Savings = Annual # of PDO * Crash Reduction Factor * PDO Societal Cost
PDO Savings = 11*0.15*$1800 = $2970
Injury Savings = Annual # of Injuries * Crash Reduction Factor * Injury Societal Cost
Injury Savings = (11*0.15*$34,000) = $56,100
BENEFIT TERM

Benefits = PDO Savings + Injury Savings
Benefits = $59,070
BENEFIT TERM

• Step #3a – Estimate the cost to implement the improvements– Estimated Improvement Cost (EIC) =
$100,000
• Step #3b – Assign a discount rate & find the corresponding capital recovery factor (CRF)
Discount Rate = 8% Project Life Span = 10 yearsCRF = 0.149
Costs = EIC * CRF = $100,000 * 0.149 = $14,900
COST TERM
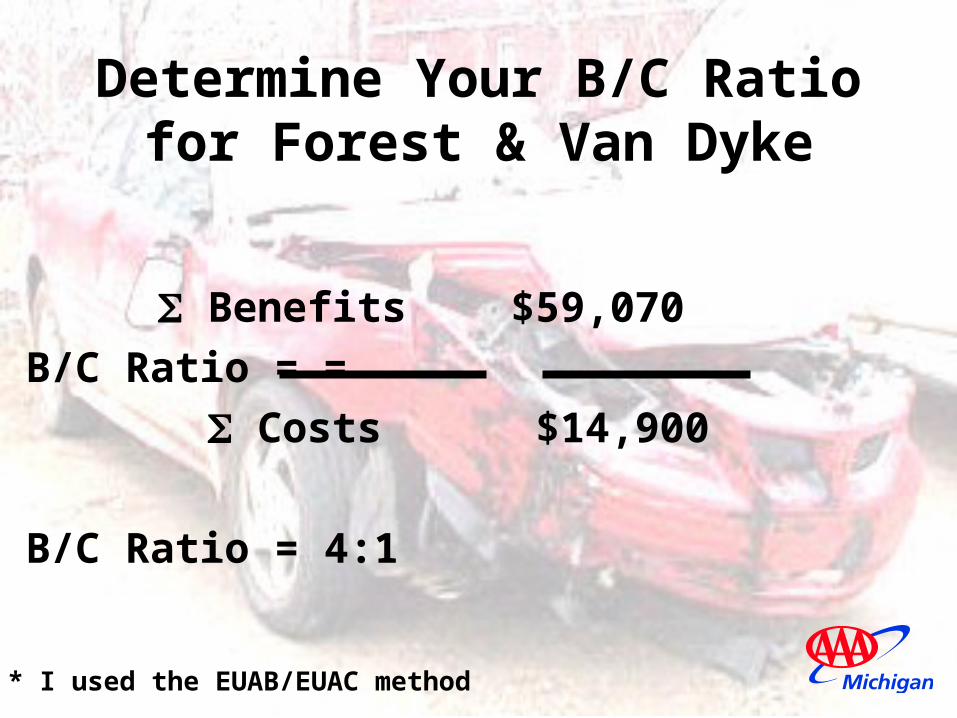
Determine Your B/C Ratiofor Forest & Van Dyke
Benefits $59,070
B/C Ratio = =
Costs $14,900
B/C Ratio = 4:1
* I used the EUAB/EUAC method

Now calculate the B/C Ratio for the following intersections
• Plymouth & Hubbell
• Greenfield & McNichols
• Seven Mile & Dequindre

Which Intersection To Choose?
Intersection B/C RatioForest & Van Dyke 4.0 : 1
Plymouth & Hubbell 5.2 : 1
Greenfield & McNichols 4.9 : 1
Seven Mile & Dequindre 3.3 : 1

Which Engineering Countermeasures are Economically Justified at Plymouth & Hubbell?
Westbound Approach of Plymouth

Southbound Approach of Hubbell
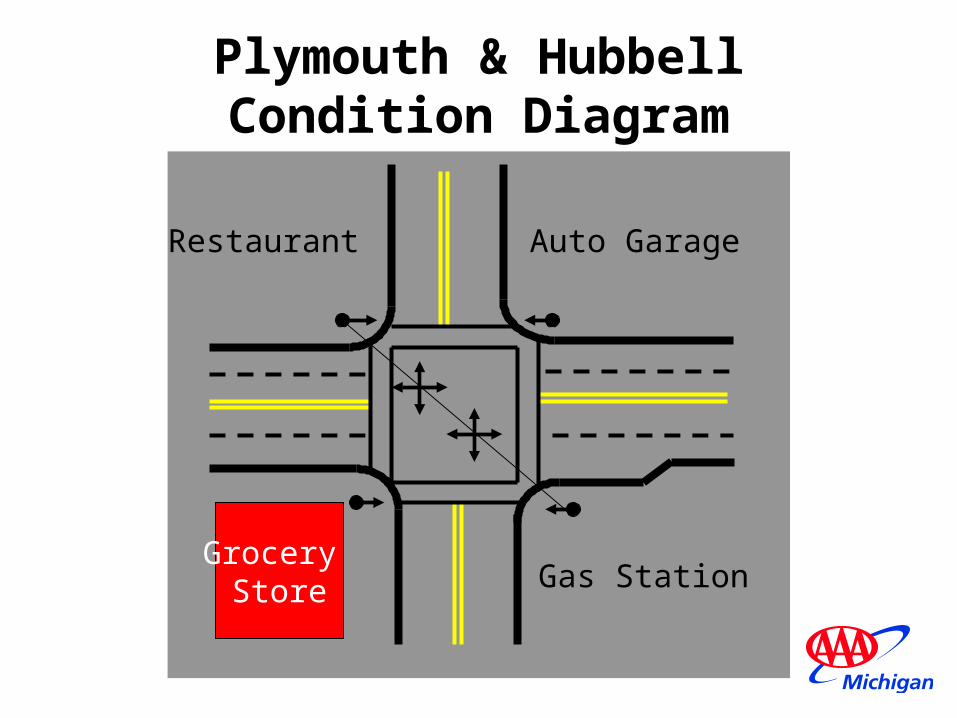
Plymouth & HubbellCondition Diagram
Grocery Store Gas Station
Auto GarageRestaurant

Hu
bb
ellPlymouth
Crash Data from 1998 & 1999Source: UD-10’s from Detroit Police Dept.
ISSUES •Lots of red light running• Left-turns • Driveways• Signal visibility• Sight Distance
Plymouth & HubbellCollision Diagram

Traffic Counts
Plymouth Road = 15,000 vehicles/day
Hubbell Avenue = 8,000 vehicles/day
8039560
16549525
85 175 35
40 250 25

What type of improvements
would you make to this
intersection?

Level of Service
Approach Current Conditions
With LT Phase on Plymouth
Eastbound C A
Westbound C A
Northbound B B
Southbound B B
Economic Analysis of Improvements
Use the same process as was used for choosing intersections to determine whether the countermeasures are justified.
Each group will calculate the B/C ratio for their set of countermeasures. Be able to justify why you chose your specific countermeasures

Economic Analysis of Improvements (cont.)
Signal,PavementMarkings &Signs Only
Signal,PavementMarkings, Signs & Geometric
Group # # of Countermeasures
Crash Reduction
Factor
Project Cost
1 1 15% $70,000
2 2 20% $80,000
3 3 25% $90,000
4 4 30% $100,000
5 1 25% $100,000
6 2 30% $125,000
7 3 35% $150,000
8 4 40% $175,000

B/C Analysis to Meet Specific Criteria
AAA must meet a minimum criteria a B/C ratio of 2:1 over two years for any investment at an intersection.
How do you calculate a maximum investment using a specific B/C criteria?

Step #1: Set the B/C equation equal to the criteria you are tying to meet. Use a B/C of 2:1 over 2 years and assume a crash reduction of 20%, a discount rate of 8% and a project life of 5 years. Assume the intersection has 20 PDO and 7 Injury Crashes.
Benefits Benefits
2 = =
Costs Max Inv * CRF

Calculate the Benefits
Benefits=(20*$1800*0.20)+(7*$34,000*0.20)
Benefits = $54,800

Using Algebra Calculate the
Maximum Investment
Benefits $54,800
Max Inv = =
2*CRF 2*0.2505
Max Inv = $107,784