presented by joseph k. berry principal, berry & associates // spatial information systems...
TRANSCRIPT
Presented by
Joseph K. Berry
Principal, Berry & Associates // Spatial Information SystemsAdjunct Faculty in Geosciences, Department of Geography, University of Denver
Adjunct Faculty in Natural Resources, Warner College of Natural Resources, Colorado State University
Email: [email protected] — Website: www.innovativegis.com/basis
This PowerPoint with notes and online links to further reading is posted at
www.innovativegis.com/basis/Present/CentroidCSU2014/
GIS in Natural Resources and Agriculture
GIS Centroid SeminarColorado State University — October 17, 2014
Premise: While Natural Resources and Agriculture have significant differences in their respective motivations, goals, decision environments, and technological approaches,
advanced Map Analysis and GIS Modeling applications are bridging these differences.
Premise: While Natural Resources and Agriculture have significant differences in their respective motivations, goals, decision environments, and technological approaches,
advanced Map Analysis and GIS Modeling applications are bridging these differences.

Mapping vs. Analyzing (Processing Mapped Data …review from “Future Directions” seminar)
(Berry)
(Biotechnology) (Nanotechnology)
Global Positioning System
(locate and navigate)
Remote Sensing
(measure and classify)
Geographic Information Systems
(map and analyze)
GPS/GIS/RS
…GIS is a Technological Tool involving —
−Mapping that creates a spatial representation of an area
−Display that generates visual renderings of a mapped area
−Geo-query that searches for map locations having a specified classification, condition or characteristic
“Map”
(Descriptive Mapping)
“Analyze”
… and an Analytical Tool involving —
−Spatial Mathematics that applies scalar mathematical formulae to account for geometric positioning, scaling, measurement and transformations of mapped data
−Spatial Analysis that investigates the contextual relationships within and among mapped data layers
−Spatial Statistics that investigates the numerical relationships within and among mapped data layers
(Prescriptive Modeling)

Spatial Statistics Operations Spatial Analysis Operations
“Map-ematics”
Maps as Data, not Pictures
Vector & Raster — Aggregated & Disaggregated
Qualitative & Quantitative
A Mathematical Structure for Map Analysis/Modeling (…review from “Future Directions”
seminar)
Technological Tool
Mapping/Geo-Query (Discrete, Spatial Objects)
Geotechnology RS – GIS – GPS
Grid-basedMap Analysis Toolbox
(Berry)
ArcGIS Spatial Analyst operations…over 170 individual “tools”
(Continuous, Map Surfaces) Map Analysis/Modeling
Analytical Tool
Geo-registered
Analysis Frame
…organized set of numbers
Matrix of Numbers
www.innovativegis.com/basis/BeyondMappingSeries/, Book IV, Topic 9 for more discussion
A Map-ematical Framework
Traditional math/stat procedures can be extended into
geographic space to support
Quantitative Analysis of Mapped Data
“…thinking analytically with maps”
Map Stack
SpatialSTEM

Comparing Natural Resources and Agriculture (a GIS perspective)
(Berry)
Spatial Statistics seeks to map the variation in a data set instead of focusing on a single typical response
(central tendency), thereby providing a Statistical Framework for investigating the
Numerical Spatial Relationships within and among grid map layers
Spatial Analysis extends the basic set of discrete map features (points, lines and polygons) to map surfaces that represent continuous geographic space (matrix), thereby
providing a Mathematical Framework for investigating
Contextual Spatial Relationships within and among grid map layers
Natural ResourcesMapping/Geo-query
Terrain AnalysisVariable-width BuffersEmergency Response
Visual ExposureShape/Patterns
Consensus Building :
AgricultureNavigation
Yield MappingNutrient SurfacesPrescription Map
Spatial T-testClustering
Regression:
SpatialCoincidence
among map variables
RelativePositioning
within map variables
“Technical Tool” (Descriptive “Where is What”)
Mapping/Geo-Query(Discrete Spatial Objects)
vs. Analytical Tool (Prescriptive “Why, So What and What if”)
Map Stack (geo-registered)
Map Analysis/Modeling(Continuous Map Surfaces)
Geo-registered
Analysis Frame
…organized set of numbers
Matrix of Numbers
Mathematical Framework Statistical Framework

Video of “Future Directions in Map Analysis and Modeling” seminar can be viewed at https://www.youtube.com/watch?v=YA-mGpc20vc
Spatial Analysis Operations (Math Examples …review from “Future Directions” seminar)
(Berry)
The Spatial Derivative identifies the localized inclination (slope) and orientation (aspect) at every grid cell on a map surface. Spatial Analyst commands Slope and Aspect.
Advanced Grid Math applies mathematical operations (add, subtract, multiply, divide, power, log, cosine, Boolean AND, Bitwise AND, etc.). Spatial Analyst commands Math and Map Algebra toolsets.
The Spatial Integral calculates the volume (or other statistical summary) for an area. Spatial Analyst Zonal Statistics commands.

Video of “Future Directions in Map Analysis and Modeling” seminar can be viewed at https://www.youtube.com/watch?v=YA-mGpc20vc
Spatial Analysis Operations (Distance Examples …review from “Future Directions” seminar)
Optimal Path identifies the “shortest not-necessary-straight route”. Spatial Analyst command Cost Path.
Visual Connectivity identifies cells visually connected to an observer location (Viewshed) or the number of cells (Visual Exposure). Spatial Analyst command Viewshed.
(Berry)

Movement …around and through absolute and relative barriers
(click) …animated time steps in construction of a Travel-time Surface
Spatial Analysis Operations (Travel-time Surface backcountry emergency response)
(Berry)Travel-time Surface (accumulated movement) Least Cost Path (optimal movement)

Wildfire Risk/Behavior Modeling (Example of an advanced NR application)
The consequences of wildfires have never been greater as more people move into wildfire-prone areas. There is an increasingneed for wildfire risk assessment, fuel treatments, mitigation planning, prevention awareness, wildfire behavior modeling, real-time suppression response and recovery preparedness to reduce risk and impacts to communities and sensitive areas.
Wildfire Risk Modeling…Wildfire Risk integrates numerous map layers such as weather factors,
historical fire occurrence, surface and canopy fuels, terrain, and suppression effectiveness.
(Berry)
…analysis of Wildfire Spread and Behavior, integrates current weather, fuel characteristics, and topography. Simulation results are in real
time, providing capabilities to adjust simulations with observed data and proposed suppression activities.
Wildfire Behavior Modeling
After Scott, Pyrologix ; Buckley and Ramirez, Tecnosylva
Economic Impact of wildfire is based on probability/intensity of a wildfire (Risk) times assessor data (Value).
Risk
Value
Wildfire Risk
Rebuild Value
Risk times $Value = $Exposure
Fire ignites and moves SW

Comparing Natural Resources and Agriculture (a GIS perspective)

Video of “Future Directions in Map Analysis and Modeling” seminar can be viewed at https://www.youtube.com/watch?v=YA-mGpc20vc
Spatial Statistics (Linking Data Space with Geographic Space …review from “Future Directions” seminar)
Traditional Statistics fits a Standard Normal Curve (2D density function) to identify the typical value in a data set (Mean) and its typical variation (Standard Deviation) in abstract data space.
Unusually High Locations are identified as locations greater than the Mean plus one Standard Deviation (upper tail). Spatial Analyst Reclass command.
Surface Modeling uses Spatial Interpolation to fit a continuous surface (3D density function) that maps thespatial distribution (variation) in geographic space. Spatial Analyst IDW, Kriging, Spline and Natural Neighbors
commands.
(Berry)
Video of “Future Directions in Map Analysis and Modeling” seminar can be viewed at https://www.youtube.com/watch?v=YA-mGpc20vc
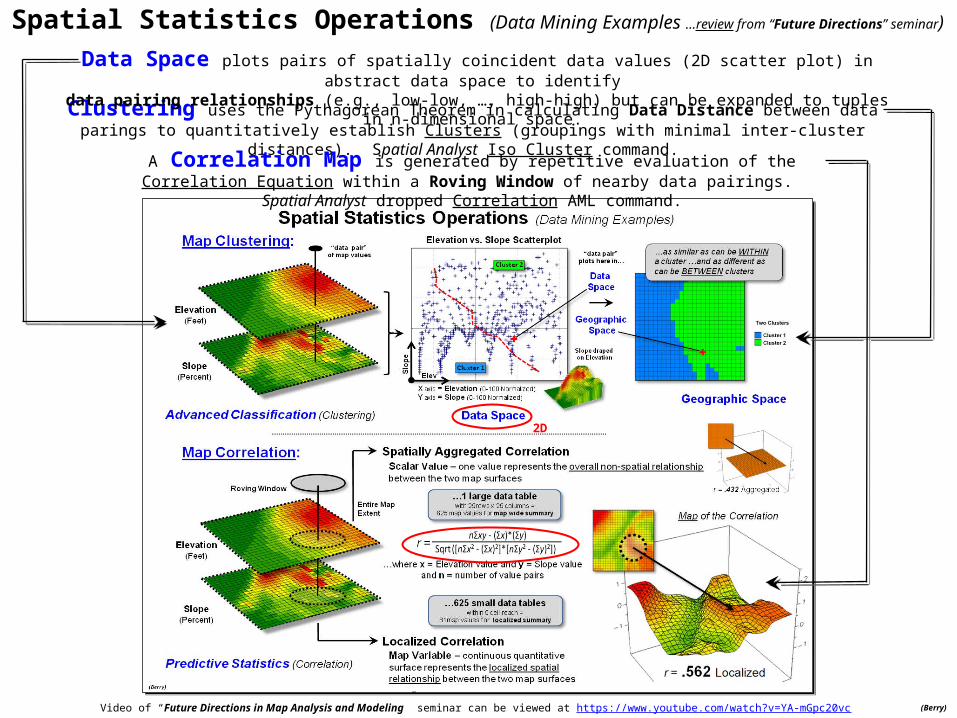
Spatial Statistics Operations (Data Mining Examples …review from “Future Directions” seminar)
Clustering uses the Pythagorean Theorem in calculating Data Distance between data parings to quantitatively establish Clusters (groupings with minimal inter-cluster distances). Spatial Analyst Iso Cluster command.
(Berry)
Data Space plots pairs of spatially coincident data values (2D scatter plot) in abstract data space to identify data pairing relationships (e.g., low-low, …, high-high) but can be expanded to tuples in n-dimensional space.
A Correlation Map is generated by repetitive evaluation of the Correlation Equation within a Roving Window of nearby data pairings. Spatial Analyst dropped Correlation AML command.
2D

Visualizing Spatial Relationships
Multivariate Coincidence
What spatial relationships do you see?
Humans can only “see” broad
Generalized Patterns in a single map variable
(Berry)
Phosphorous (P)
Interpolated Spatial Distribution
of soil nutrient concentrations
Continuous Grid-Map Surfaces (Data Layers)
…do relatively high levels of P often occur with high levels of K and N?
…how often?
…where?
(Map Stack)

Geographic Space
Clustering Maps for Data Zones
…groups of relatively close “floating balls” in data space identify locations in the field with similar data patterns– Data Zones (Data Clusters)
…but computers can “see” detailed numeric patterns in multiple map variables using Data Space
(Berry)
3D
…the IsoData algorithm minimizes Intra-Cluster distances (within a cluster— similar)
while at the same time maximizing Inter-Cluster distances (between clusters— different)
Data Distance = SQRT (a2 + b2 + c2)
Data Space Distance calculated using the Pythagorean Theorem
Note: can be expanded to N-dimensional Data SpaceData Distance = SQRT (a2 + b2 + c2 + …)

On-the-Fly
Yield Map
The Precision Ag ProcessAs a combine moves through a field it…
1) uses GPS to check its location every second then
Steps 1–3)
Derived Soil Nutrient Maps
6) …that is used to adjust fertilization levels applied every few
feet in the field (If <condition> then <action>).
Variable Rate Application
Step 6)
Intelligent Implements
“As-applied” maps
(Berry)
2) records the yield monitor value at that location to
3) create a continuous Yield Map surface identifying the variation in crop
yield every few feet throughout the field (dependent map variable).
Prescription Map
Zone 3
Zone 2
Zone 1
4) …soil samples are interpolated for
continuous Nutrient Map surfaces.
Step 4)
5) The yield map is analyzed in combination with soil nutrient maps, terrain and other mapped factors
(independent map variables) to derive a Prescription Map…
Step 5)
…more generally termed the Spatial Data Mining Process (e.g., Geo-Business application)

Precision Ag(Individual Field Focus)
Terrain
Soils
Yield
Potassium
CIR Image
Precision Conservation (compared to Precision Ag)
Precision Conservation(Landscape Focus)
Wind Erosion
Runoff
Leaching Leaching
Leaching
SoilErosion
Chemicals
(Stewardship Emphasis)
Interconnected Perspective
3-dimensional
(Berry)
…intertwined disciplines
https://www.sensorsandsystems.com/article/features/5662-precision-agricultures-success-yields-precision-conservation.html
Isolated Perspective
(Production Emphasis)
2-dimensional
Coincidence

Surface_flows
Erosion Buffers
Erosion_potentiErosion_potential
33 = Heavy, Steep= High :11 = Light, Gentle= Low
Deriving Erosion Potential (Common Ground Example …terrain modeling)
(Berry)
Distance away from the streams is a function of the erosion potential
(Flow/Slope Class) with intervening heavy flow and steep slopes computed as
effectively closer than simple distance— as the crow walks”
But all buffer-feet are not the same…
Need to reach farther under some conditions
and not as far under others— common sense?
Simple Buffer – fixed geographic reach
Simple approach tor protecting the stream
Streams
Variable-width Buffer (Landscape Level)
Slope_classes
Flow_classes
Erosion PotentiaErosion Potential fn(S,F)
Derived Maps of Slope and surface Flow
Flowmap
Slopemap
On/Off-Field Flows(Field Level)
The combined map identifies where surface flows likely move/deposit materials (e.g., organic, fine particles, chemicals) within a field. Locations with a lot of movement at the edge of a field are identified as potential problem areas.
Surface FlowsSurface Flows fn(S,F)
Flowmap
Slopemap
Elevation

Water Conservation Modeling (Conservation = “wise use”)
(Berry)
New/Expanded Data Collection /Instrumentation:
Remote Sensing Weather/Climate
Water Flow Evapotranspiration
Soil Moisture
Weather Station
Weather Station
Soil Moisture Probes
Soil Moisture Probes
Solar IrradianceEvapotranspiration
Monitors
Solar IrradianceEvapotranspiration
Monitors
WirelessConnectivit
y
WirelessConnectivit
y
ToRiver
Farmland
ToRiver
HistoricCrop Water Allocation
Farmland
Farm
City
“Buy and Dry”
WaterRights
Temporary Monitored Transfers
Alternative Water BudgetCrop Water Allocation
DroughtMonitor
March 2014
AbnormallyDry
ExceptionalDrought
100th Meridian
Weather Station
Weather Station
Low AltitudeAerial Photos
Low AltitudeAerial Photos
FullIrrigation
FullIrrigation
DeficitIrrigation
DeficitIrrigation
Fully IrrigatedTree Crop
under Drip Irrigation
Fully IrrigatedTree Crop
under Drip Irrigation
Fully IrrigatedVegetables
underDrip Irrigation
Fully IrrigatedVegetables
underDrip Irrigation
FallowedField
FallowedField
Deficit Irrigated Crop under Center
Pivot Sprinkler
Deficit Irrigated Crop under Center
Pivot Sprinkler
LandsatSatellite Images
LandsatSatellite Images
Management Management ActionsActions
Auto-Flume Adjustment
Auto-Flume Adjustment
“Win-Win-Win”
Crops
FarmIncome
CityWater
Sell or LeasePurchaseWater Rights
www.regenmg.com/Home.aspx
Sustainable Water and Innovative Irrigation Management (SWIIM)
Off-Farm Data Collection
On-FarmOn-Farm Instrumentation Instrumentation
“First in time, First in Right”

Upshot (NR compared to Ag from a GIS perspective)
(Berry)
Future Directions:
With increasing understanding of Map Analysis and GIS Modeling capabilities and spatial reasoning skills both disciplines will be Pushed/Pulled closer together…
Historical Setting:
NR was an early adopter of geospatial technology as a direct outgrowth of its long and extensive mapping/inventory legacy for automated cartography and geoquery of an extended resource base.
― NR will incorporate more quantitative analysis of mapped data (Spatial Statistics) in its science, and
— Ag will adopt a more ecological perspective focusing on the cycles and movements of soil and water (Spatial Analysis).
— NR’s analytical applications currently tend to focus more on ecology and environmental impacts at the landscape level utilizing Spatial Analysis operations (geographical context; relative position) for analysis of spatial relationships among factors affecting ecosystem conditions and management actions.
Contemporary GIS Applications and Approaches:
The bulk of GIS applications for both NR and Ag applications involve Technological Tools utilizing mapping, geo-query and display for NR and GPS navigation, implement control and data collection for Ag.
On theother hand, Ag had little use for mapping and spatially detailed inventories.
— Ag’s analytical applications currently tend to focus on stewardship and economics at the individual field level utilizing Spatial Statistics operations (numerical context; spatial coincidence) for analysis of spatial relationships among factors affecting crop production and management actions.
However…

So Where to Head from Here?
Joseph K. Berry Joseph K. Berry [email protected]@innovativegis.com
eMail Contact
Online Materials (www.innovativegis.com/Basis/Courses/SpatialSTEM/)
)
This PowerPoint with notes and online links to further reading is posted at
www.innovativegis.com/basis/Present/CentroidCSU2014/
Website (www.innovativegis.com)For more papers and presentations on GeotechnologyFor more papers and presentations on Geotechnology
www.innovativegis.comwww.innovativegis.com
For more papers and presentations on GeotechnologyFor more papers and presentations on Geotechnology
www.innovativegis.comwww.innovativegis.com
Beyond Mapping Compilation Series…nearly 1000 pages and more than 750
figures in the Series provide a comprehensive and longitudinal perspective of the underlying
concepts, considerations, issues and evolutionary development of modern
geotechnology (RS, GIS, GPS).