presented to the prosperous places: building economic
TRANSCRIPT

Presented to the Prosperous Places: Building Economic Competitiveness in Rural Regions and Small Communities Conference
Salt Lake City, Utah March 26, 2013
Charles W. Fluharty President & CEO
Rural Policy Research Institute

I. Recalibrating the rural/urban dialogue and paradigm
II. The global rationale for a “Regional Rural Innovation” strategy
III. Is there a “rural” commitment in current U.S. domestic policy?
IV. Rural imperatives, and signs of hope and progress!
V. Final reflections: Why your work is so critical

I. Recalibrating the rural/urban dialogue and paradigm

U.S. Census Bureau
Urban and Rural Areas
Office of Management and Budget
Core Based Statistical Areas – Metropolitan and Nonmetropolitan Areas

The U.S. Census Bureau defines urban areas: Core blocks and block groups with population density
of 1,000 people per square mile.
Surrounding blocks with overall density of 500 ppmi2
Range in size from 2,500 people to nearly 2 million people.
Rural is everything that is not urban.
Based on the 2010 Decennial Census: 59 million people live in rural areas (19%)
249 million people live in urban areas (81%)
5


Hermann, MO Population 2,515
New York-Newark Population 1.8 million

These boundaries are only defined every 10 years.
Urban area boundaries don’t align with boundaries of cities and towns.
There is no governmental jurisdiction over Census defined urban areas.
Very limited sub-county data challenges more granular understanding, and resource targeting.
The most comprehensive data is at the county level.
All would agree that some “urban” places are really much more rural in character.

Defined by the Office of Management and Budget.
Designed to be functional regions around urban centers.
Classification is based on counties.
Three classifications of counties:
Metropolitan, Micropolitan, Noncore
Based on size of urbanized area/urban cluster in central counties and commuting ties in outlying counties.

Core Based Statistical Areas Metropolitan Micropolitan Noncore

Usually, metropolitan is equated with urban and nonmetropolitan is
equated with rural.
So, if metropolitan is urban, then…

This is urban:
Los Angeles, California Population 1.2 million

And so is this:
Armstrong County, Texas Population 2,071 Part of the Amarillo Texas Metropolitan Area

And if nonmetropolitan is rural, then…

This is rural:
Loving County, Texas Population 55

And so is this:
Paducah, Kentucky Population 48,035

Most Counties are Both Urban and Rural!
Coconino County, Arizona Population 127,450 Flagstaff Metro Area

Most metropolitan areas contain rural territory and rural people.
In fact…
54% of all rural people live in metropolitan counties!

Distribution of U.S. Population by Urban and Rural Areas, and Core Based Statistical Areas, 2010
Urbanized Area
Urban Cluster
Rural Total
Metropolitan
219,677,256
10,766,879
32,007,997
262,452,132
Micropolitan
228,950
13,852,786
13,072,477
27,154,213
Noncore
15,917
4,711,483
14,411,793
19,139,193
Total
219,922,123
29,331,148
59,492,267
308,745,538
Urbanized Area
Urban Cluster
Rural Total
Metropolitan 99.9% 36.7% 53.8% 85.0%
Micropolitan 0.1% 47.2% 22.0% 8.8%
Noncore 0.0% 16.1% 24.2% 6.2%

II. The global rationale for a “Regional Rural Innovation”
strategy

The OECD New Rural Paradigm (2006)
Old Paradigm
New Paradigm
Objectives Equalization. Focus on farm
income
Competitiveness of rural areas
Key target
sector
Sector based Holistic approach to include
various sectors of rural economies
Main tools Subsidies
Investments
Key actors National governments, farmers Multilevel-governance
Guarantee an adequate attention to rural issues And empower local communities and governments
Rural is not synonymous with agriculture Rural is not synonymous with economic decline

Modernising the rural economy
• NRP and ahead: – Identification toward a set of principles
• Differentiation based on rural characteristics – Low density – sparsely populated
– Long distances
– Lack of critical mass
• Need to enhance competitiveness – Rural areas integrated in global world
• Differentiated but integrated – Rural regions are complex territories
– Non-core urban areas
Promoting Growth in all Regions
Urban to Rural Linkages Project
“Innovation and Modernising the Rural Economy “

Enrique Garcilazo
Regional Development Policy Division Directorate for Public Governance and Territorial Development OECD
NACO WEBINAR
Washington, 15th January 2013
Promoting Growth in all Regions and Rural Development

OECD Territorial Reviews: A series of case studies of regional policy
Among 34 member countries :
18 National Territorial Reviews ( +2 in process)
22 Metropolitan Reviews (+1 in process)
2 National Urban Policy Reviews (+1 in process)
6 Regional reviews (+2 in process)
5 review s on regional innovation systems 9+2 National rural Policy Reviews(+1 in process)
24
Alemania, Mexico (2006) Finlandia, Holanda, Escocia (2007) China, Italia, España (2008) Quebec, Canadá (2009) Inglaterra (2010)

Thematic Reviews -- Rural
Factors of regional competitiveness
(1) Empirical evidence
-- General trends
(2) Case studies
– Field analysis
– Questionnaires,
– Peer reviewers, experts
• Policy implications:
(3) Implementation
Governance
Linking Renewable Energy to Rural
Development (15)
RURAL-URBAN Partnerships Project (16)

OECD Regional Data-Base (RDB)
The RDB includes regional statistics on 5 major topics:
– Demographic , Regional accounts , Labour ,
– Social and environmental indicators , Innovation
To facilitate comparability, regions are:
Classified in 2 Territorial Levels (TLs):
• TL2 Territorial Level 2 (337 regions)
• TL3 Territorial Level 3 (1708 regions)
• New regions: China, Brazil, South-Africa, Chile etc..
Classified by regional type OECD definition: (PU, I, PR)
Extended regional classification (PU, INC, INR, PRC,PRR)
Database can be directly accessed from the OECD
Statistical portal: http://stats.oecd.org
OECD eXplorer: http://stats.oecd.org/OECDregionalstatistics
OECD MDB: www.oecd.org/gov/regional/statisticsindicators

Promoting growth in all regions
Is broader based growth economically viable?
Does growth potential exist in some regions?
Does it matter for national and aggregate growth ?

There is no single/unique path to growth…

Convergence forces in rural regions

Convergence forces in intermediate regions

The most dynamic OECD regions over 1995-2007..
31
140
150
160
170
180
190
200
210
220
1995 1996 1997 1998 1999 2000 2001 2002 2003 2004 2005 2006
pop and GDP growth pop density and GDP growth pop and GDPpc growth
average rank (1== highest) population pop density

Dynamism in rural regions and population trends
-1.0%
0.0%
1.0%
2.0%
3.0%
4.0%
5.0%
6.0%
7.0%
8.0%
9.0%
10.0%
-4.0% -3.0% -2.0% -1.0% 0.0% 1.0% 2.0% 3.0% 4.0%
GD
P p
er
ca
pit
a g
row
th in
PP
P 1
99
5-2
00
7
Population growth, 1995-2007
Intermediate
-2%-1%0%1%2%3%4%5%6%7%8%9%
10%11%12%13%14%15%
-4% -3% -2% -1% 0% 1% 2% 3% 4%
GD
P p
er
ca
pit
a g
row
th in
PP
P 1
99
5-2
00
7
Population growth, 1995-2007
Rural
-2.0%-1.0%0.0%1.0%2.0%3.0%4.0%5.0%6.0%7.0%8.0%9.0%
10.0%11.0%12.0%13.0%14.0%15.0%
-4.0% -3.0% -2.0% -1.0% 0.0% 1.0% 2.0% 3.0% 4.0%
GD
P p
er
ca
pit
a g
row
th in
PP
P 1
99
5-2
00
7
Population growth, 1995-2007
Rural close to a city
-2.0%
-1.0%
0.0%
1.0%
2.0%
3.0%
4.0%
5.0%
6.0%
7.0%
8.0%
9.0%
10.0%
11.0%
12.0%
-3.0% -2.0% -1.0% 0.0% 1.0% 2.0% 3.0% 4.0%
GD
P p
er
ca
pit
a g
row
th in
PP
P 1
99
5-2
00
7
Population growth, 1995-2007
Rural remote

Concentration high levels of GDP pc
0
10000
20000
30000
40000
50000
60000
NA
PLE
S
DEA
GU
BER
LIN
MO
NTR
EAL
VA
NC
OU
VER
LILL
E
TAM
PA
BA
Y
FUK
UO
KA
MA
NC
HES
TER
LEED
S
VA
LEN
CIA
BIR
MIN
GH
AM
AN
KA
RA
SEO
UL
KR
AK
OW
MIA
MI
PH
OEN
IX
OSA
KA
RH
INE-
RU
HR
ST.L
OU
IS
PIT
TSB
UR
GH
TOR
ON
TO
IZM
IR
ISTA
NB
UL
PU
EBLA
MEL
BO
UR
NE
AU
CK
LAN
D
BU
SAN
CO
PEN
HA
GEN
GU
AD
ALA
JAR
A
BA
LTIM
OR
E
SYD
NEY
RA
ND
STA
D-H
OLL
AN
D
TUR
IN
DET
RO
IT
PO
RTL
AN
D
MEX
ICO
CIT
Y
HA
NB
UR
G
BA
RC
ELO
NA
CLE
VEL
AN
D
ZUR
ICH
TOK
YO
DU
BLI
N
AIC
HI
LOS
AN
GEL
ES
FRA
NK
FUR
T
LYO
N
BR
USS
ELS
HEL
SIN
KI
CH
ICA
GO
LISB
ON
OSL
O
SAN
DIE
GO
STU
TTG
AR
T
MA
DR
ID
VIE
NN
A
PH
ILA
DEL
PH
IA
ATH
ENS
ATL
AN
TA
MIL
AN
MO
NTE
RR
EY
MU
NIC
H
RO
ME
PR
AG
UE
LON
DO
N
BU
DA
PES
T
STO
CK
HO
LM
DA
LLA
S
MIN
NEA
PO
LIS
NEW
YO
RK
DEN
VER
SEA
TTLE
HO
UST
ON
WA
RSA
W
PA
RIS
BO
STO
N
SAN
FR
AN
CIS
CO
WA
SHIN
GTO
N
GDP per capita national GDP per capita
21% 79%
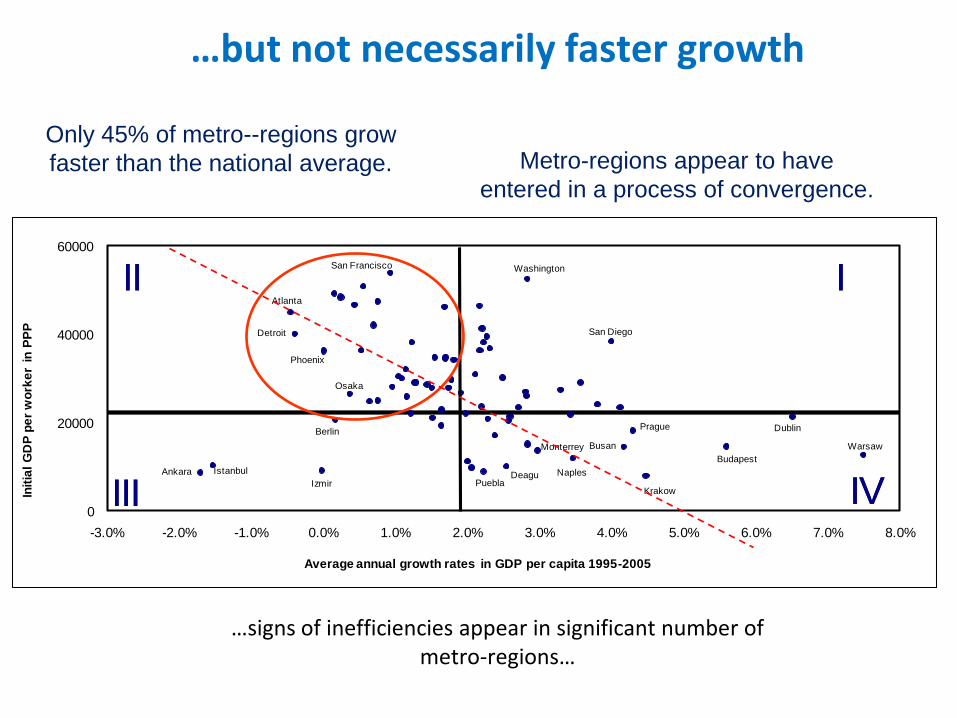
Only 45% of metro--regions grow
faster than the national average.
0
20000
40000
60000
-3.0% -2.0% -1.0% 0.0% 1.0% 2.0% 3.0% 4.0% 5.0% 6.0% 7.0% 8.0%
Init
ial
GD
P p
er
wo
rke
r in
PP
P
Average annual growth rates in GDP per capita 1995-2005
III IVBudapest
Warsaw
Naples
Izmir
Istanbul
II I
Ankara
III IV
DublinPrague
BusanMonterrey
II I
PueblaKrakow
WashingtonSan Francisco
San DiegoDetroit
Atlanta
Phoenix
Berlin
Osaka
Deagu
Metro-regions appear to have
entered in a process of convergence.
…signs of inefficiencies appear in significant number of metro-regions…
…but not necessarily faster growth

Contributions to aggregate growth depend on few hub regions…
…the fat tail is equally important -- if not more -- to aggregate growth… 35

Contributions to growth OECD TL3 regions
36
y = 0.5031x-1.201
0%
1%
2%
3%
4%
5%C
on
trib
uti
on
to
OEC
D g
row
th
TL3 regions
5% 10% 15% 20% 25% 30% 35% 40% 45% 50% 55% 60% 65% 70% 75 % 80% 85% 90% 95%
Tokyo
London West
Gyeonggi-do
SeoulMadrid
RomaMilanoAichiBarcelona
AttikiMiasto Warszaw
Dublin
Chungcheongnam-doGyeonsangbuk-do
Paris
München
Hauts-de-Seine
Stockholms län
Gyeonsangnam-do
Inner London -- East
27% of growth driven by 2.4% (or 20) regions...
...and 73% of growth by the remaining

Lagging regions contribute to national growth
Lagging Regions Contribution to Aggregate Growth
Overall, they contributed to 44% of aggregate OECD growth in 1995-2007.
Austra l ia 29% 71%
Austria 53% 47%
Canada 26% 74%
Czech Republ ic 62% 38%
Finland 35% 65%
France 68% 32%
Germany 27% 73%
Greece -16% 116%
Hungary 34% 66%
Ita ly 26% 74%
Japan 27% 73%
Korea 23% 77%
Mexico 44% 56%
Netherlands 49% 51%
Norway 61% 39%
Poland 44% 56%
Portugal 54% 46%
Slovak Republ ic 67% 33%
Spain 48% 52%
Sweden 58% 42%
Turkey 47% 53%
United Kingdom 57% 43%
United States 51% 49%
average unweighted 43% 57%
average weighted 44% 56%
lagging leading
In eight OECD countries lagging regions contributed more to national growth
than leading regions.
Bottom line: support for lagging regions need not be merely a “social” policy. They contribute a large share of national growth.
37

Analytical approach:
Compare indicators relevant for regional growth b/w
“growing” and “underperforming” group
•Population density •GDP density
•Employment rate •Unemployment rate •Youth unemployment rate •Patent applications •Patent intensity •Business R&D to GDP •Government R&D to GDP •Higher education R&D to GDP
•Primary attainment rate •Tertiary attainment rate •Connectivity in global network
•Productivity
•Infrastructure
Economic mass/thickness of market economies of agglomeration Labour utilisation Innovation related indicators Human capital Geography/NEG

Performance of all “growing” regions associated …
Productivity Human capital Density
Productivity Productivity (GDP per employee) 31,612 29,728 55,832 50,728 72,551 59,824
Infrastucture Motorway density 0.15 0.13 0.26 0.18 0.19 0.24
Primary educational attainment (% of LF) 42% 46% 26% 22% 25% 29%
Teritiary attainment (% of LF) 21% 19% 26% 25% 31% 26%
PISA score mathematics 443 405 476 487 484 478
PISA score reading 459 436 482 485 490 465
Employment rate 57% 55% 71% 68% 71% 66%
Unemployment rate 9% 8% 5% 7% 5% 6%
Long-term unemployment rate 4% 5% 2% 2% 2% 2%
Youth unemployment rate 21% 22% 13% 16% 12% 15%
Participation rate 62% 60% 73% 72% 74% 69%
ln (patent application) 1.7 1.8 4.4 4.1 5.0 4.0
Patent applications per million 20 16 91 74 158 82
ln (patent application copatents) 1.1 1.6 4.0 3.6 4.6 3.6
Co-invention within region 124 90 673 536 2932 1256
Co-inventions within ctry 105 71 294 261 759 466
Co-inventions foreign 16 53 126 112 314 206
R&D expenditure total (as % of GDP) 1.06% 1.03% 1.50% 1.41% 2.21% 1.51%
BERD % GDP 0.35% 0.42% 0.90% 0.86% 1.35% 1.00%
GERD % GDP 0.33% 0.22% 0.23% 0.20% 0.42% 0.16%
High and medium HTM % empl. 3.3% 4.8% 5.2% 6.1% 5.3% 6.4%
KIS (as % of total employment) 22.5% 28.2% 33.3% 32.8% 36.7% 32.2%
Population density 17.51 18.38 19.40 18.63 29.47 23.41
GDP density 1.10 0.99 4.29 3.38 29.14 24.19
Degree of openness 14 15 40 40 65 44
Clustering coefficient 0.034 0.038 0.089 0.093 0.123 0.084
Centrality 0.001 0.001 0.002 0.002 0.007 0.005
Growth factor Indicator
Agglomeration and
connectivity
Innovation
Labour market
Human capital
Regions with large
catching up potential
Regions with catching
up potentialAdvanced regions
Growing
above av.Growing
below av.
Growing
above av.Growing
below av.
Growing
above av.Growing
below av.

Performance of regions with low levels of development…
…infrastructure and innovation related activities (co-invention within regions and with other regions within countries) are critical, in addition to human capital .
Productivity Productivity (GDP per employee) 31,612 29,728 55,832 50,728 72,551 59,824
Infrastucture Motorway density 0.15 0.13 0.26 0.18 0.19 0.24
Primary educational attainment (% of LF) 42% 46% 26% 22% 25% 29%
Teritiary attainment (% of LF) 21% 19% 26% 25% 31% 26%
PISA score mathematics 443 405 476 487 484 478
PISA score reading 459 436 482 485 490 465
Employment rate 57% 55% 71% 68% 71% 66%
Unemployment rate 9% 8% 5% 7% 5% 6%
Long-term unemployment rate 4% 5% 2% 2% 2% 2%
Youth unemployment rate 21% 22% 13% 16% 12% 15%
Participation rate 62% 60% 73% 72% 74% 69%
ln (patent application) 1.7 1.8 4.4 4.1 5.0 4.0
Patent applications per million 20 16 91 74 158 82
ln (patent application copatents) 1.1 1.6 4.0 3.6 4.6 3.6
Co-invention within region 124 90 673 536 2932 1256
Co-inventions within ctry 105 71 294 261 759 466
Co-inventions foreign 16 53 126 112 314 206
R&D expenditure total (as % of GDP) 1.06% 1.03% 1.50% 1.41% 2.21% 1.51%
BERD % GDP 0.35% 0.42% 0.90% 0.86% 1.35% 1.00%
GERD % GDP 0.33% 0.22% 0.23% 0.20% 0.42% 0.16%
High and medium HTM % empl. 3.3% 4.8% 5.2% 6.1% 5.3% 6.4%
KIS (as % of total employment) 22.5% 28.2% 33.3% 32.8% 36.7% 32.2%
Population density 17.51 18.38 19.40 18.63 29.47 23.41
GDP density 1.10 0.99 4.29 3.38 29.14 24.19
Degree of openness 14 15 40 40 65 44
Clustering coefficient 0.034 0.038 0.089 0.093 0.123 0.084
Centrality 0.001 0.001 0.002 0.002 0.007 0.005
Growth factor Indicator
Agglomeration and
connectivity
Innovation
Labour market
Human capital
Regions with large
catching up potential
Regions with catching
up potentialAdvanced regions
Growing
above av.Growing
below av.
Growing
above av.Growing
below av.
Growing
above av.Growing
below av.

As regions move into higher levels of development…
…human capital but in addition to adequate infrastructure, efficient labour markets and innovative activity are critical to enhance their performance .
Productivity Productivity (GDP per employee) 31,612 29,728 55,832 50,728 72,551 59,824
Infrastucture Motorway density 0.15 0.13 0.26 0.18 0.19 0.24
Primary educational attainment (% of LF) 42% 46% 26% 22% 25% 29%
Teritiary attainment (% of LF) 21% 19% 26% 25% 31% 26%
PISA score mathematics 443 405 476 487 484 478
PISA score reading 459 436 482 485 490 465
Employment rate 57% 55% 71% 68% 71% 66%
Unemployment rate 9% 8% 5% 7% 5% 6%
Long-term unemployment rate 4% 5% 2% 2% 2% 2%
Youth unemployment rate 21% 22% 13% 16% 12% 15%
Participation rate 62% 60% 73% 72% 74% 69%
ln (patent application) 1.7 1.8 4.4 4.1 5.0 4.0
Patent applications per million 20 16 91 74 158 82
ln (patent application copatents) 1.1 1.6 4.0 3.6 4.6 3.6
Co-invention within region 124 90 673 536 2932 1256
Co-inventions within ctry 105 71 294 261 759 466
Co-inventions foreign 16 53 126 112 314 206
R&D expenditure total (as % of GDP) 1.06% 1.03% 1.50% 1.41% 2.21% 1.51%
BERD % GDP 0.35% 0.42% 0.90% 0.86% 1.35% 1.00%
GERD % GDP 0.33% 0.22% 0.23% 0.20% 0.42% 0.16%
High and medium HTM % empl. 3.3% 4.8% 5.2% 6.1% 5.3% 6.4%
KIS (as % of total employment) 22.5% 28.2% 33.3% 32.8% 36.7% 32.2%
Population density 17.51 18.38 19.40 18.63 29.47 23.41
GDP density 1.10 0.99 4.29 3.38 29.14 24.19
Degree of openness 14 15 40 40 65 44
Clustering coefficient 0.034 0.038 0.089 0.093 0.123 0.084
Centrality 0.001 0.001 0.002 0.002 0.007 0.005
Growth factor Indicator
Agglomeration and
connectivity
Innovation
Labour market
Human capital
Regions with large
catching up potential
Regions with catching
up potentialAdvanced regions
Growing
above av.Growing
below av.
Growing
above av.Growing
below av.
Growing
above av.Growing
below av.

As regions approach the production possibility frontier…
…in addition to human capital dynamism is mainly associated with innovation-related activities and their connectivity within the global network of regions and agglomeration forces.
Productivity Productivity (GDP per employee) 31,612 29,728 55,832 50,728 72,551 59,824
Infrastucture Motorway density 0.15 0.13 0.26 0.18 0.19 0.24
Primary educational attainment (% of LF) 42% 46% 26% 22% 25% 29%
Teritiary attainment (% of LF) 21% 19% 26% 25% 31% 26%
PISA score mathematics 443 405 476 487 484 478
PISA score reading 459 436 482 485 490 465
Employment rate 57% 55% 71% 68% 71% 66%
Unemployment rate 9% 8% 5% 7% 5% 6%
Long-term unemployment rate 4% 5% 2% 2% 2% 2%
Youth unemployment rate 21% 22% 13% 16% 12% 15%
Participation rate 62% 60% 73% 72% 74% 69%
ln (patent application) 1.7 1.8 4.4 4.1 5.0 4.0
Patent applications per million 20 16 91 74 158 82
ln (patent application copatents) 1.1 1.6 4.0 3.6 4.6 3.6
Co-invention within region 124 90 673 536 2932 1256
Co-inventions within ctry 105 71 294 261 759 466
Co-inventions foreign 16 53 126 112 314 206
R&D expenditure total (as % of GDP) 1.06% 1.03% 1.50% 1.41% 2.21% 1.51%
BERD % GDP 0.35% 0.42% 0.90% 0.86% 1.35% 1.00%
GERD % GDP 0.33% 0.22% 0.23% 0.20% 0.42% 0.16%
High and medium HTM % empl. 3.3% 4.8% 5.2% 6.1% 5.3% 6.4%
KIS (as % of total employment) 22.5% 28.2% 33.3% 32.8% 36.7% 32.2%
Population density 17.51 18.38 19.40 18.63 29.47 23.41
GDP density 1.10 0.99 4.29 3.38 29.14 24.19
Degree of openness 14 15 40 40 65 44
Clustering coefficient 0.034 0.038 0.089 0.093 0.123 0.084
Centrality 0.001 0.001 0.002 0.002 0.007 0.005
Growth factor Indicator
Agglomeration and
connectivity
Innovation
Labour market
Human capital
Regions with large
catching up potential
Regions with catching
up potentialAdvanced regions
Growing
above av.Growing
below av.
Growing
above av.Growing
below av.
Growing
above av.Growing
below av.

Persistence of inequality
Infrastructure
provision
Leaking by linking
The policy headache: isolated sectoral action may have unintended outcomes.
Problem: lack of connectivity
43

with labour mobility
Persistence of inequality
Policy
responses
Human capital formation
Brain drain
44
The policy headache: isolated sectoral action may have unintended outcomes.

The need for a differentiated approach
• Place based polices in the new regional paradigm are
best suited for this task
Integrated approach – diagnosis is critical
Right level of intervention – local labour markets
A match between bottom and top down information
and initiative is critical
Policy design and multilevel governance are key for a
successful implementation
45

Infrastructure provision
Policy responses
Human capital formation
Business environment
Innovation
Regional growth and convergence
Towards a Multidimensional Response
At the regional scale
Many countries are reforming in this direction, but implementation is still difficult.
46
-Horizontal evidence? -Policies ? -Institutions ?

III. Is there a “rural” commitment in current U.S. domestic policy?


“ What policy framework will best integrate rural and urban initiatives and programs, to advantage both ag and non-ag rural constituencies, their communities and regions, and enhance their children’s potential to thrive there in the 21st century?”

1. Greater attention to asset-based development, much more broadly
defined. Placemaking, married to economic development, must be
the new paradigm.
2. The building of regional frameworks, appropriately configured, of
sufficient scale to leverage these geographies and bridge these
constituencies. (While we need rural and urban responses, their
intersection is the future of enlightened public policy.)
3. As the Federal role reduces over time, greater attention to new
governance / new intermediary support by the public sector.
4. Regional innovation policies which specifically target mutually
beneficial competitive advantage, that rural and urban areas share.
(i.e., Regional food systems, bio-energy compacts, natural resource-
based / sustainability assets, “workshed” / “watershed”
approaches, etc.)

5. Attention to the importance of working landscapes:
Arts / heritage / culture
Natural resources / tourism
Bio-energy / biofuels, entrepreneurial agriculture
6. Incentives to bridge innovation / entrepreneurship support
systems, from urban to rural expression
7. Opportunities to address spatial mismatch issues in
workforce / training across broader geographies, via
“place-based” community / technical college
collaborations, both sister schools and research universities.
8. Innovative funding approaches which enhance
collaboration across state and local governments,
particularly in cross-sectoral, regional experimentation.

IV. Rural imperatives, and signs of hope and progress!

Critical Internal Considerations
Wealth Creation and Intergenerational Wealth Retention
Youth Engagement and Retention
Social Inclusion and Social Equity
New Narratives &
Networks
Knowledge Networks & Workforce
Quality of Place
Entrepreneur-ship &
Innovation
Collaborative Leadership

V. Final
Reflections:
Why your work is so critical

Distribution of U.S. Population by Urban and Rural Areas, and Core Based Statistical Areas, 2010
Urbanized Area
Urban Cluster
Rural Total
Metropolitan
219,677,256
10,766,879
32,007,997
262,452,132
Micropolitan
228,950
13,852,786
13,072,477
27,154,213
Noncore
15,917
4,711,483
14,411,793
19,139,193
Total
219,922,123
29,331,148
59,492,267
308,745,538
Urbanized Area
Urban Cluster
Rural Total
Metropolitan 99.9% 36.7% 53.8% 85.0%
Micropolitan 0.1% 47.2% 22.0% 8.8%
Noncore 0.0% 16.1% 24.2% 6.2%


“What lies behind us,
and what lies before us
are tiny matters
compared to what lies within us.”
--Ralph Waldo Emerson

Charles W. Fluharty [email protected] President and CEO
Rural Policy Research Institute 214 Middlebush Hall
University of Missouri Columbia, MO 65211
(573) 882-0316 http://www.rupri.org/