presenter disclosure information
DESCRIPTION
Presenter Disclosure Information. Echocardiographic Tissue Doppler Imaging Is a Powerful Independent Prognosticator of Overall Mortality in the General Population Results From the Fourth Copenhagen City Heart Study (2002-2007). - PowerPoint PPT PresentationTRANSCRIPT
Presenter Disclosure Information
Echocardiographic Tissue Doppler Imaging Is a Powerful Independent
Prognosticator of Overall Mortality in the General Population
Results From the Fourth Copenhagen City Heart Study (2002-2007)
Disclosure information The following relationships exist related to this presentation:
Rasmus Mogelvang – No disclosures
Peter Sogaard – Consulting fees GE Healthcare Modest level
Sune A. Pedersen – No disclosures
Niels T. Olsen – No disclosures
Peter Schnohr – No disclosures
Jan S. Jensen – No disclosures
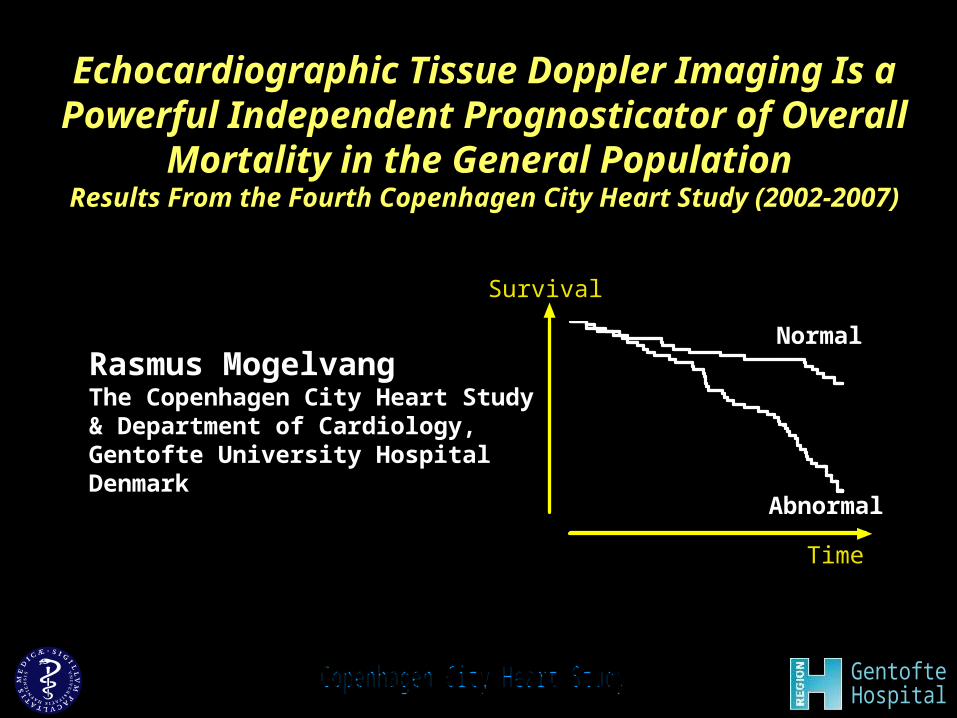
Echocardiographic Tissue Doppler Imaging Is a Powerful Independent Prognosticator of Overall
Mortality in the General Population Results From the Fourth Copenhagen City Heart Study (2002-2007)
Rasmus MogelvangThe Copenhagen City Heart Study& Department of Cardiology,Gentofte University HospitalDenmark
Survival
Time
Normal
Abnormal

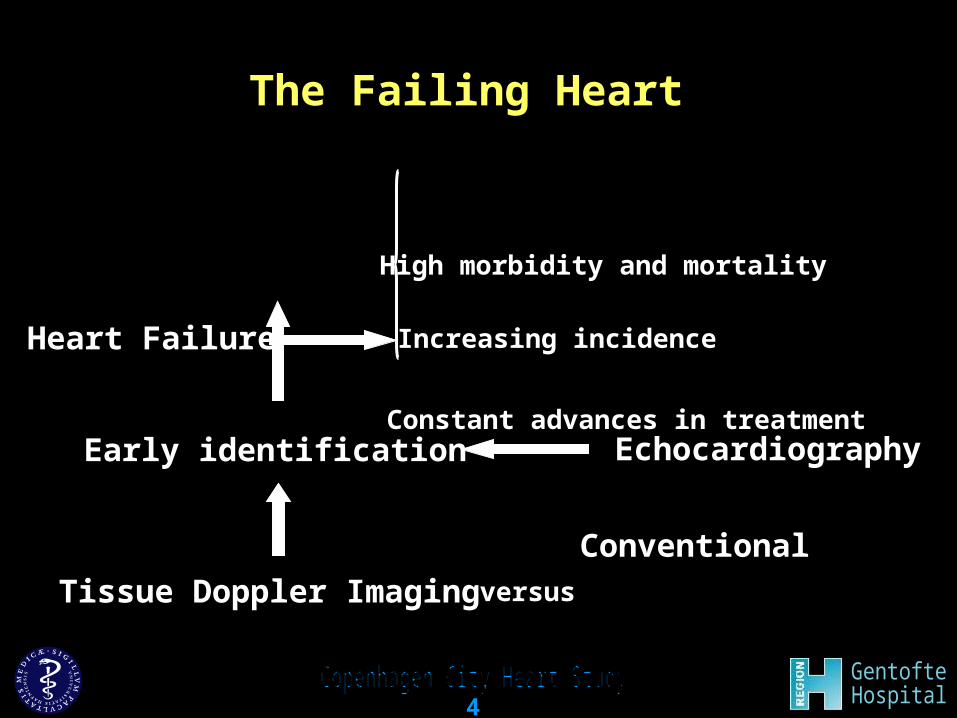
The Failing Heart
Heart Failure High morbidity and mortality
Increasing incidence
3
High morbidity and mortality
Increasing incidence
Constant advances in treatmentEarly identification Echocardiography
Tissue Doppler Imaging
The Failing Heart
Heart Failure
versus
4
Conventional

Methods
1,100 persons from the
Copenhagen City Heart Study
Conventional Echocardiography
&
Tissue Doppler Imaging
Mean Follow-up: 5.1 years
http://www.lib.utexas.edu/maps
Copenhagen
5

Survivors Non-survivors(n=946) (n=90)
Age - years 58 74 P<0.001
Hypertension – % 42 72 P<0.001
Body Mass Index – kg/m2 25.6 25.7 P=0.91
Heart rate – beats per minute 69 71 P=0.10
Male gender – % 41 44 P=0.58
Diabetes - % 7 13 P<0.04
Ischemic heart disease - % 8 21 P<0.001Severe diastolic dysfunction – % 0.7 1.2 P=0.47Left ventricular ejection fraction <50% - % 0.9 3.5 P<0.05 Left ventricular dilatation - % 5.7 5.5 P=1.00
Left ventricular hypertrophy - % 15 37 P<0.001
P-value
Characteristics of the Study Population
6
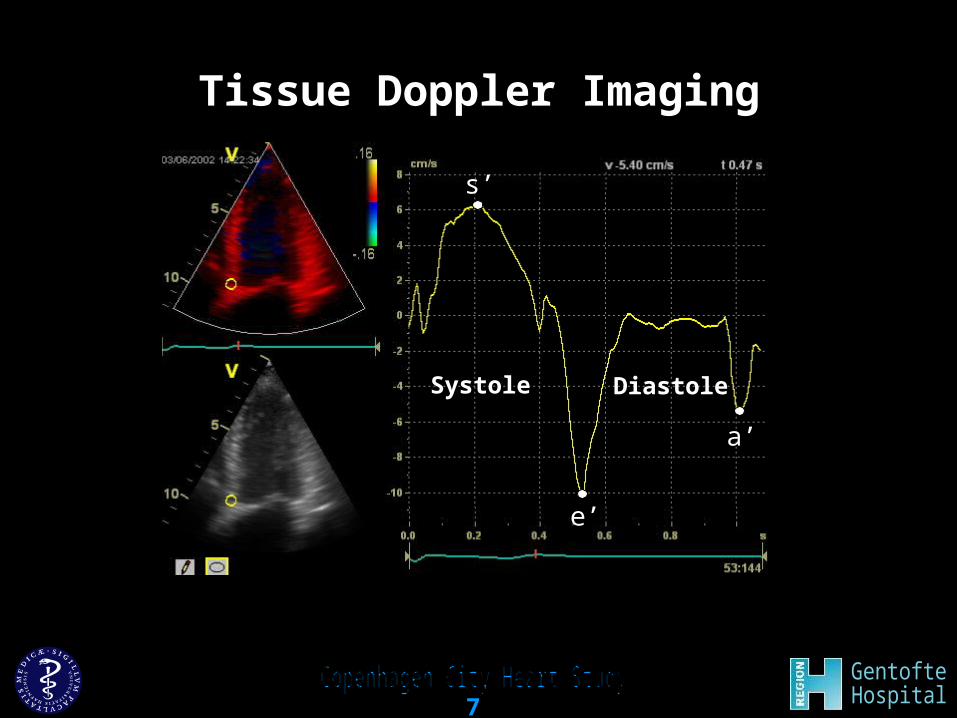
Tissue Doppler Imaging
Systole Diastole
s’
e’
a’
7

Tissue Doppler Imaging
Systole
s’
Diastole
e’
a’
s’
e’
a’
Survivors Non-survivors
s’ – cm/s 6.1 5.3
a’ – cm/s 6.7 6.3
e’ – cm/s 7.2 5.4
8
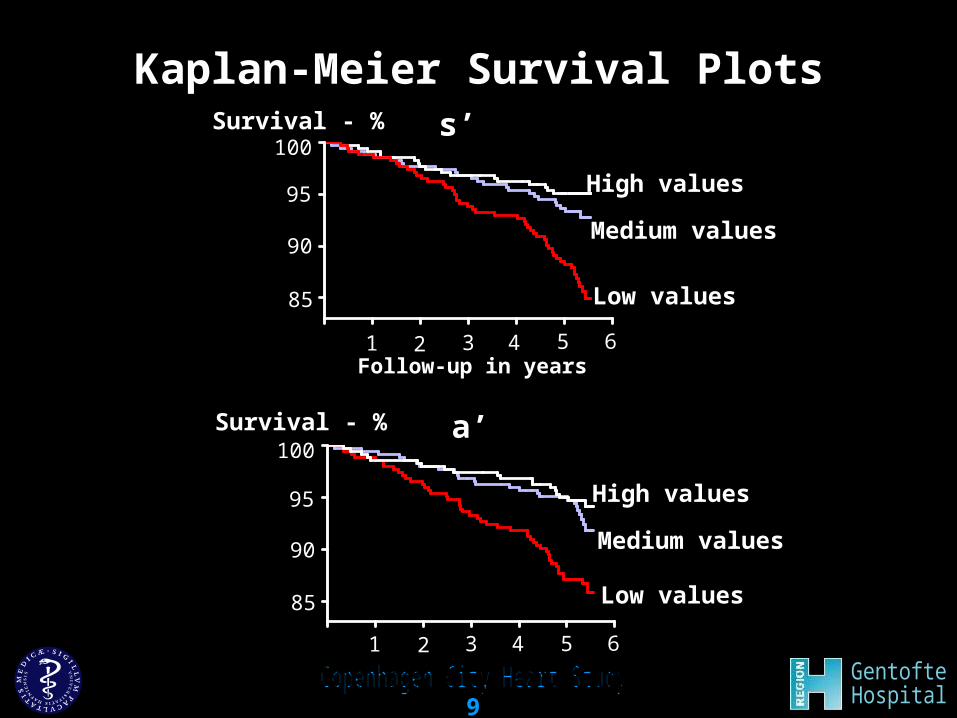
Kaplan-Meier Survival PlotsSurvival - %
100
95
90
85
1 2 3 4 5Follow-up in years
6
High values
Medium values
Low values
s’
Survival - %100
95
90
85
1 2 3 4 5 6
Medium values
Low values
High values
a’
9

Kaplan-Meier Survival PlotsSurvival - %
100
95
90
85
Survival - %100
95
90
85
1 2 3 4 5Follow-up in years
6
High values
Medium values
Medium values
Low values
Low values
High values
s’
a’8 cm/s vs. 3 cm/s RR 3.0
Multivariate Analysis
RR 1.25 per cm/s; P<0.04
RR 1.25 per cm/s; P<0.001
10

Kaplan-Meier Survival Plot for e’
Survival - %100
95
90
85
1 2 3 4 5Follow-up in years
6
High
Medium
Low
e’
values
values
values
80
Multivariate analysis Relative Risk 1.02 (0.90-1.16); P=0.77
11
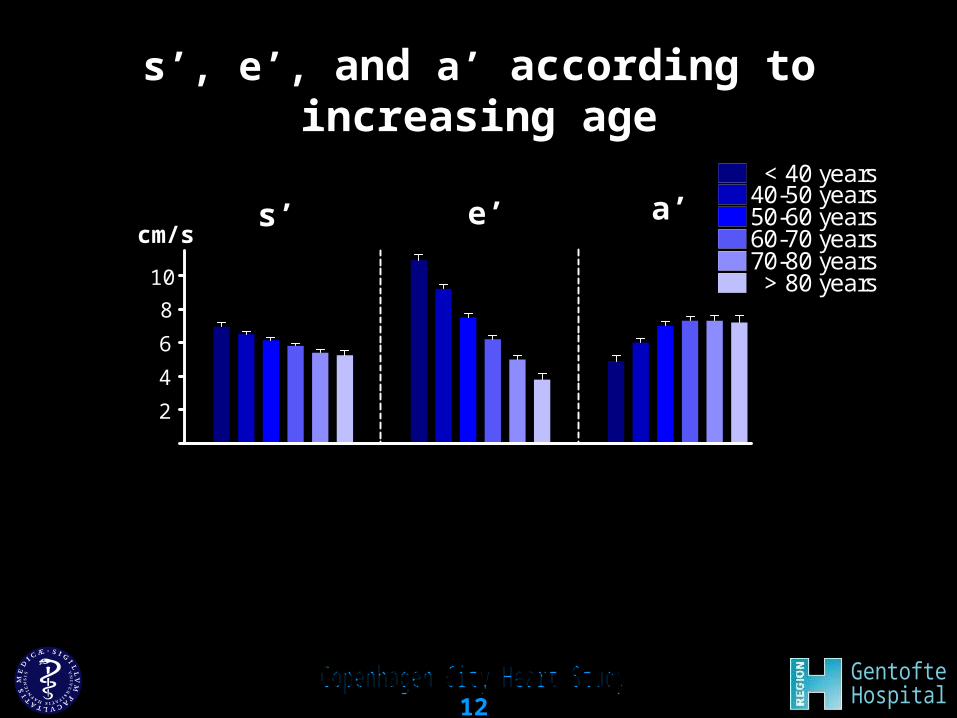
40-50 years50-60 years
< 40 years
60-70 years70-80 years > 80 years10
cm/sa’e’s’
8
6
4
2
s’, e’, and a’ according to increasing age
12
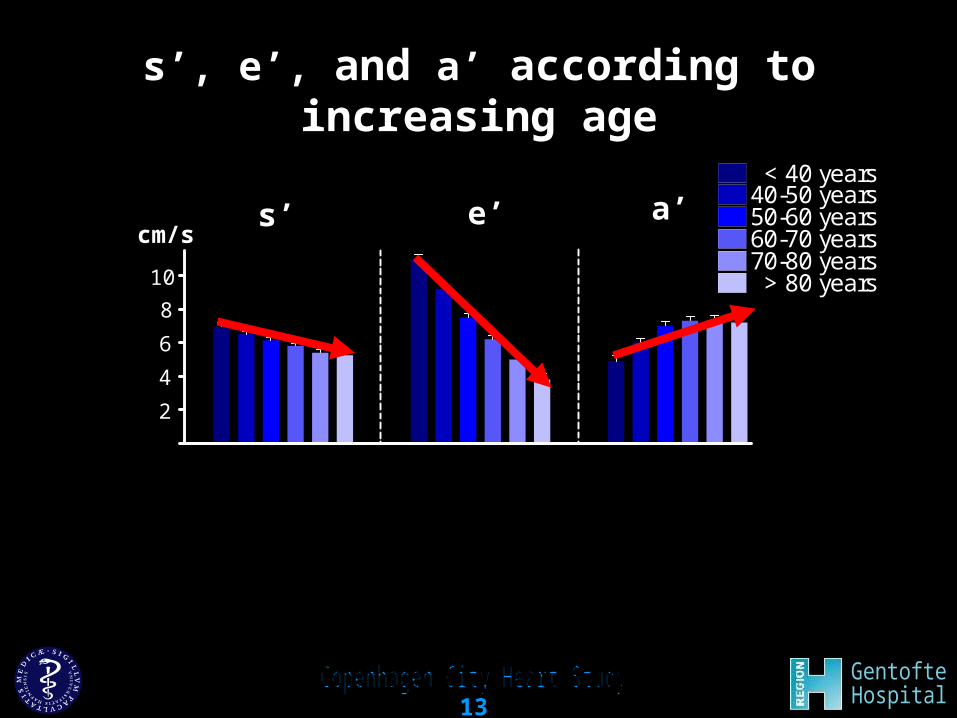
40-50 years50-60 years
< 40 years
60-70 years70-80 years > 80 years10
cm/s
8
6
4
2
a’e’s’
s’, e’, and a’ according to increasing age
13

40-50 years50-60 years
< 40 years
60-70 years70-80 years > 80 years
r=-0.4r=-0.8 r=0.3
10
cm/s
8
6
4
2
a’e’s’
s’, e’, and a’ according to increasing age
14

e’/a’
Systole Diastole
s’
e’
a’
15
e’/a’

Systole Diastole
s’
e’
a’
16
e’/a’
Interdependence of s’, e’, and a’

Interdependence of s’, e’, and a’
Systole Diastole
s’
e’
a’e’/s’
17
e’/a’

Interdependence of s’, e’, and a’
s’
e’
a’e’/s’
e’/a’
(e’/a’)/s’
18
eas-index

Kaplan-Meier Survival Plot for the eas-index
1 2 3 4 5
Follow-up in years
6
1. tertile
Survival - %
100
95
90
85
2. tertile
3. tertile
Adjusted for age and sexMultivariate analysis 3.tertile vs. 1.tertile
Relative Risk 2.6 (1.4-4.7); P<0.003
19

Tissue Doppler imaging is a powerful prognosticator - even in the presence of a normal conventional echocardiographic examination
1
Conclusions
Tissue Doppler imaging is a powerful prognosticator, even in the presence of a normal conventional echocardiographic examination
1
Low values of s’ and a’ were significant predictors of death in the general population
2
2 Low values of s’ and a’ were significant predictors of death
Combining the information of systolic and diastolic performance strengthens the prognostic value of tissue Doppler imaging
3Combining the information of systolic and diastolic performance strengthens the prognostic value of tissue Doppler imaging
Survival
Time
TDI Normal
TDI Abnormal
3