presenting gender pay gap figures to the public: an … · trial design and sample 5 ... this study...
TRANSCRIPT

Presenting gender pay gap figures to the public: an online randomised controlled trial Research report
June 2018
Rony Hacohen and Annabelle Wittels (The Behavioural Insights Team) and Bhavya Mohan (University of San Francisco)

2
Contents Executive Summary 5
Trial design and sample 5 Results and implications 6
1. Introduction 8
Policy background 8 Distinguishing between good and bad: how to define a good outcome on an attitudinal scale 9 Predictiv online platform 9
2. Trial methodology and materials 10
Sample 10 Trial materials 10
The three companies 10
The materials presented in each trial arm 11
Outcome measures 16 Test flow 17
Randomisation 18
3. Results 20
Effect of GPG figures on public attitudes towards employers 20 Effect of GPG figures on public understanding of the GPG (comprehension) 22 Additional exploratory results: willingness to visit the GPG viewing service 24
4. Conclusion 26
Appendix 1: Sample demographics 28
Appendix 2: Attitude questions 29
Appendix 3: Comprehension questions 30
Appendix 4: Balance checks 31
Sample balance 31
Drop out 32
Appendix 5: Analytical strategy 33
Appendix 6: Additional descriptives 35
Descriptives by gender 35 Appendix 7: Screenshots (Coins arm only) 38
Bibliography 47

3
List of figures Figure 1: An illustration of the test flow 19
Figure 2: difference between attitudes towards the high and low performing company, by trial arm 21
Figure 3: The distribution of attitude scores for high, moderate and low GPG companies, by trial arm 22
Figure 4:The number of questions participants answered correctly, by trial arm 23
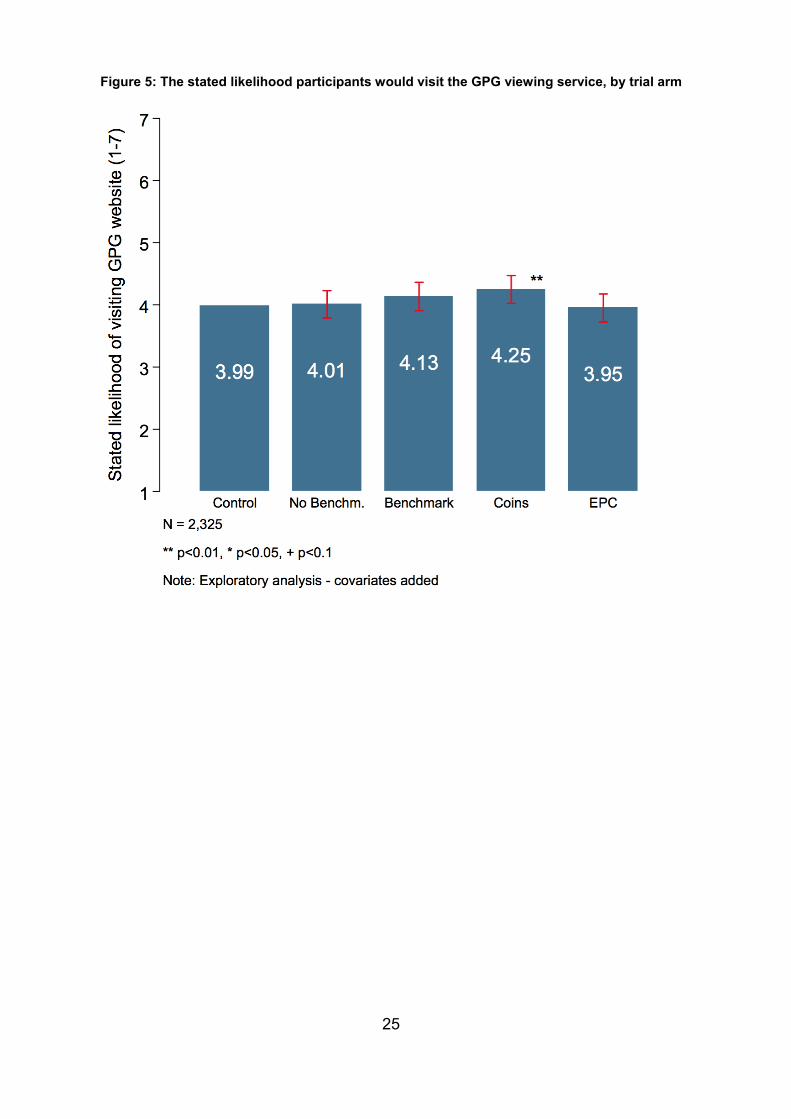
Figure 5: The stated likelihood participants would visit the GPG viewing service, by trial arm 25
Figure 6: Average attitude score towards company with high GPG, by gender 36
Figure 7: Average attitude score towards company with moderate GPG, by gender 36
Figure 8: Average attitude score towards company with low GPG, by gender 37
Figure 9: Average comprehension scores, by gender 37

4
List of tables Table 1: Hourly rates presentation by trial arm (company with moderate GPG) 12
Table 2: The percentage of women in each pay quartile - as presented in the treatment arms (company with moderate GPG) 15
Table 3: Demographic characteristics of the sample 28
Table 4: Average attitudes score of all companies, by trial arm 29
Table 5: The proportion of participants that answered each question correctly, by trial arm 30
Table 6: Overview of completions and drop-outs, by trial arm 32
Table 7: Descriptives 35
5
Executive Summary Transparency can be a powerful mechanism for creating accountability and social change. Drawing on this insight, the government now requires UK employers with 250 or more employees to report their annual gender pay gap (GPG) figures on a government website that is open to the public. But to be effective, transparency needs to be designed well. To enable the public to hold companies to account, the information disclosed needs to be presented in a clear and meaningful way. There is currently no evidence about whether people in the UK understand the GPG figures, or what people’s attitudes are to different sizes of the GPG.
To inform the development of the Government GPG viewing service, which publicly displays the GPG figures of companies, the Government Equalities Office (GEO) commissioned the Behavioural Insights Team (BIT) to test how alternative ways of presenting the GPG figures affect comprehension and public attitudes.1
Trial design and sample This study was an online randomised controlled trial. It was run on Predictiv, an online experimentation platform developed by BIT for running randomised controlled trials. A total of 2,325 adults, drawn from a representative sample of the UK population, participated in the trial.
In this trial we tested how four different ways of presenting the core GPG figures affect public attitudes and comprehension compared to a control condition. The control condition presented the figures in percentages, based on the first version of the GPG viewing service.
The four ways of presenting the figures were: 1. No Benchmark: The GPG was presented as the difference between two vertical
bars in a bar chart. This was tested because graphical representation often improves comprehension.
2. Benchmark: Identical to the No Benchmark arm, but with the addition of information about how the company is performing compared to other companies in the sector. This was tested because social comparisons can be powerful at changing behaviour.
3. Coins: Identical to the Benchmark arm, but the GPG figures were presented in terms of money (pounds and pence) rather than percentages. This was tested because people often find it easier to understand terms that relate to material quantities, rather than more abstract representations such as percentages.
1 We are grateful to Professors Michael Norton (Harvard Business School) and Bhavya Mohan (University of San Francisco) for their advice on the design of this trial.

6
4. EPC: Figures were presented in percentages, and the ranking of the company was reflected in an Energy Performance Certificate style. This was tested because this type of display is concise in conveying comparative information.
Trial design: After random assignment to one of the five trial arms, participants saw the GPG figures of three different hypothetical retail companies with a low GPG (3%), moderate GPG (18%) or high GPG (37%). Participants were then asked questions to measure their comprehension and attitudes.
The primary outcome measure was the difference between people’s attitudes towards companies with high GPGs and low GPGs. The greater the distance between the two attitudes, the more a person is demonstrating that they can distinguish between a well performing company and poorly performing one, which puts the person in the position to hold companies to account. Attitudes towards companies were measured using three attitudinal questions: intention to purchase from the company, willingness to work for the company, and a rating of the company’s overall wage fairness.
The secondary outcome measure was comprehension of key details about the GPG, which was measured using five comprehension questions.
Results and implications The Coins arm, shown below, was the most effective way of presenting information on both outcome measures.

7
In this arm, companies with low GPGs were rated more positively than those with high GPGs, and participants also understood the meaning of the GPG best, suggesting that their attitudes were well-informed.
On the primary outcome measure (attitudes), the Benchmark arm also outperformed the control, while the rest of the arms did not. On the second outcome measure (comprehension), none of the trials arms besides the Coins outperformed the Control arm.
These results mean that, where possible, the GPG should be visually represented as and described to the public in terms of money rather than percentages. This insight that has already been incorporated into the current live version of GPG viewing service.
Our results also show that people need support in identifying what different levels of GPG mean, and that this can be done by providing benchmarking information about how certain companies are performing on their GPG compared to others.

8
1. Introduction Policy background New legislation came into force in April 2018 requiring all UK organisations with 250 employees or more to publish their annual gender pay gap (GPG) figures on a government website that is open to the public. The aim of the legislation is to increase transparency and accountability in organisations in order to ultimately reduce the pay disparities between men and women in the UK.
But how should the information be presented to the public to ensure that the regulations are as effective as possible? Evidence suggests that regulations that require organisations to disclose information to the public are more likely to achieve their objectives if the information disclosed is both meaningful and comprehensible to the public.2 This is primarily because it allows the public to engage with the information and hold companies to account. Even merely eliciting employer fear of reputational damage and public discontent is often enough to spur companies into action, but that requires that employers also believe that the public can understand the information that is being presented.3
Given these insights, and due to a lack of evidence about public comprehension of and attitudes towards the GPG, the Government Equalities Office (GEO) commissioned the Behavioural Insights Team (BIT) to trial how alternative ways of presenting the GPG figures affect comprehension and attitudes. The trial was conducted as part of the Gender and Behavioural Insights programme (GABI) which is a two year research collaboration between BIT and GEO aiming to build the evidence base on how behavioural insights can improve gender equality. Professor Michael Norton (Harvard Business School) and Professor Bhavya Mohan (University of San Francisco) advised BIT on several elements of the trial design, for which we are very grateful.
This report presents the results of an online trial responding to this request. It tested how four different ways of presenting the core GPG figures affect public attitudes and comprehension, compared to a control condition that was based on the beta version of the GPG viewing service. This was the live version of the website when the test was conducted, so this comparison allowed us to examine which of the four different new ways of presenting the GPG figures might improve on the existing approach.
2 Loewenstein, G., Sunstein, C., & Golman, R. (2014). Disclosure: Psychology Changes Everything. Annual Review of Economics, 6(1), 391-419. 3 For instance in the case of mandatory calorie disclosure on menus in the US. This not only led to a change in consumers food choices, but also to a change in the menus of restaurants. see: Zlatevska, N., Neumann, N., & Dubelaar, C. (2017). Mandatory Calorie Disclosure: A Comprehensive Analysis of Its Effect on Consumers and Retailers. Journal of Retailing.

9
Distinguishing between good and bad: how to define a good outcome on an attitudinal scale When designing a trial, it is important to define what would be considered a good outcome before running it. In the case of comprehension, this is straightforward: the higher the comprehension of GPG figures, the better. But what should be considered a good outcome in terms of public attitudes?
In line with the spirit of the original legislation, and for people to hold the right companies to account, we assumed that higher GPGs should elicit a negative response compared to lower GPGs. A desirable outcome in this context would be that people hold more positive attitudes towards companies that have smaller GPGs, and have more negative attitudes towards companies with larger GPGs, and the bigger this difference, the better. On the other hand, an undesirable outcome would be one where people are unable to distinguish between organisations with high vs. low GPGs, and would therefore report similar attitudes towards high-GPG and low-GPG companies.
This logic led us to define our main outcome of interest as the average absolute difference between public attitudes towards companies with high GPGs and low GPGs. In this experiment, that meant the difference in attitudes towards a hypothetical company we presented as having a GPG of 37% and a company presented as having a GPG of 3%, respectively. The bigger this difference, the better the outcome. More details about how this outcome was constructed are given in the next section.
Predictiv online platform In this trial, we used Predictiv, an online end-to-end research platform developed by BIT. It is capable of running a range of short, online behavioural tests, which have been designed and validated by BIT. These include comprehension tests of the style described in this report.
The platform runs tests with a large pool of participants, drawn from a group of over 200,000 adults across the UK and respondents can be targeted on age, gender, location, income and other demographic characteristics. Each online test is a randomised controlled trial, where large numbers of participants are recruited and randomly assigned to see different versions of a treatment before taking the same behavioural test.
Because Predictiv runs in an online environment, it is faster, easier, and often cheaper than other statistically valid research methods. This means that it can quickly run sequential trials, and can test a range of interventions in order to identify those most likely to be effective in the real world.

10
2. Trial methodology and materials
This study was an online randomised controlled trial (RCT). We used an RCT as they allow us to understand the way in which a particular approach causes an effect on an outcome of interest. In the trial, participants were randomly assigned into one of five different trial arms (control and four treatment arms). In each trial arm, the GPG figures were displayed differently, as explained in more detail below.
Sample The sample consisted of 2,325 people who are representative of the UK population in terms of age, median income, location and gender. Participants had access to the study if they were registered on a panel survey website that is connected to one Predictiv’s market research partners.
Trial materials
The three companies
During the test, participants were shown the the GPG figures of three different hypothetical retail companies:
● a large retail company with a low GPG (3%), named Ambrose Ltd. ● a large retail company with a high GPG (37%), named Gover Ltd. ● a large retail company with a moderate GPG (18%), named Starcross Ltd.
This test was conducted before the GPG reporting deadline, which meant we did not have a full dataset we could use to determine what a low, moderate and high GPG is in the current UK context. To make an informed decision about what is likely to be a low, moderate and high GPG, we used national figures from the Office of National Statistics.4 We chose 18% as a moderate GPG as it was close to the national average in the ONS data; we chose 3% as a low GPG simply because it is close to zero and it is objectively not a high number; and we chose 37% as a high GPG because it is roughly double 18%.
4 Office of National Statistics. (2017). Statistical bulletin: Annual Survey of Hours and Earnings: 2017 provisional and 2016 revised results.

11
The materials presented in each trial arm
After participants were randomised into the test, they were shown the three different materials described below.
1. An explanation that the GPG is not the same an unequal pay. All participants apart from those in the control group were shown this explanation. The following wording was used:
Please note that the gender pay gap is not the same as unequal pay. Unequal pay, which is paying men and women differently for performing the same (or similar) work, is unlawful. The gender pay gap is the difference in the average hourly wage of all men and women across a workforce. So if women are doing jobs that are less well paid, or if they are in less senior roles within an organisation, the gender pay gap is usually bigger.
2. The difference in women’s average hourly rates compared to men. This was presented for each of the three companies they saw, and in a different way in each trial arm. Table 1 provides an illustration of the materials in each arm, and the rationale behind testing it.
3. The percentage of women in each pay quartile. This was presented for each company they saw, but only two variations of this were tested, one for the control group and a redesigned one for the treatment arms (Table 2 below).
A full illustration of the test flow from the perspective of the participants including the materials that were presented can be found in the screen shots in Appendix 7.

12
Table 1: Hourly rates presentation by trial arm (company with moderate GPG)
Arm Materials
Control: figures were presented as they were in the beta version of the gender pay gap viewing service website (in percentage form only).
No benchmark: figures were presented as the difference between two vertical bar charts.
This was tested because graphs often improve comprehension5 though the reasons and magnitude of the improvements are sensitive to the setting in which they are applied, and the specific graphical display.6
5 Bauer, M. I., & Johnson-Laird, P. N. (1993). How diagrams can improve reasoning. Psychological science, 4(6), 372-378. 6 Scaife, M., & Rogers, Y. (1996). External cognition: how do graphical representations work?. International journal of human-computer studies, 45(2), 185-213.

13
Arm Materials
Benchmark: In addition to the previous arm, benchmarking information was provided (GPG figures for the sectoral average, and the 100 best performing companies in the sector).
This was tested primarily because social comparisons have been found to be a powerful tool for communicating the relative positioning of people and companies and consequently driving behaviour change.7
Therefore there is an interest to test their impact on public attitudes in the setting of the GPG legislation.
Perhaps equally important is addressing the risk of information overload - in which participants disengage with materials because it is too much for them to process. Therefore testing whether particular ways of formatting and explaining the information can overcome this risk is of practical importance.
7 Loewenstein, G., Sunstein, C., & Golman, R. (2014). Disclosure: Psychology Changes Everything. Annual Review of Economics, 6(1), 391-419.
14
Arm Materials
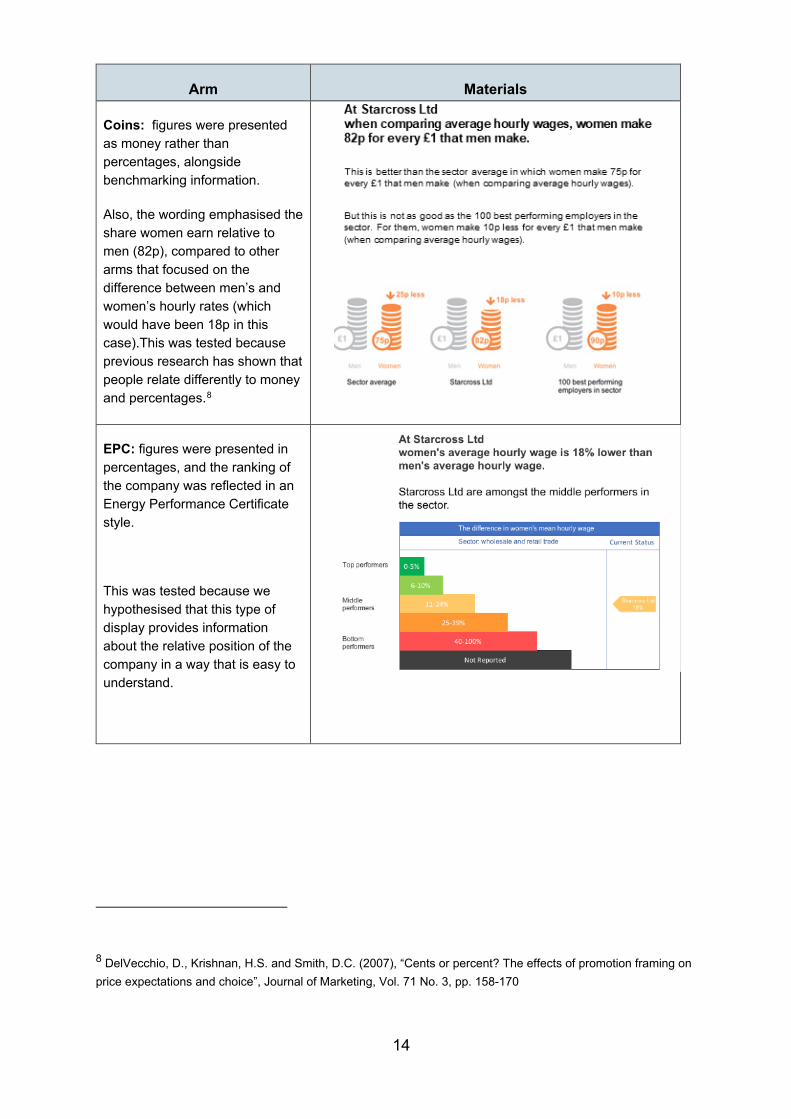
Coins: figures were presented as money rather than percentages, alongside benchmarking information.
Also, the wording emphasised the share women earn relative to men (82p), compared to other arms that focused on the difference between men’s and women’s hourly rates (which would have been 18p in this case).This was tested because previous research has shown that people relate differently to money and percentages.8
EPC: figures were presented in percentages, and the ranking of the company was reflected in an Energy Performance Certificate style.
This was tested because we hypothesised that this type of display provides information about the relative position of the company in a way that is easy to understand.
8 DelVecchio, D., Krishnan, H.S. and Smith, D.C. (2007), “Cents or percent? The effects of promotion framing on price expectations and choice”, Journal of Marketing, Vol. 71 No. 3, pp. 158-170

15
Table 2: The percentage of women in each pay quartile - as presented in the treatment arms (company with moderate GPG)
Arms Materials
Control: figures were presented as they were in the beta version of the gender pay gap viewing service website (in percentage form only).
No benchmark;Benchmark: Coins; EPC: figures were redesigned into a more graphical form in which percentages were expressed as a number of coloured dots out of 10.

16
Outcome measures We measured the effect of the different GPG rate presentation formats on outcome measures of interest, which were quantified using participant responses as explained below.
Primary outcome measure: the difference between people’s attitudes towards companies with high GPGs and low GPGs. We assume that a greater difference in attitudes is desirable because it reflects a better ability to distinguish between a high GPG and a low one.
Attitudes towards a particular company is the measured on a scale of 1-7, using the average of three attitudinal questions:
1. Work intention: How would this information affect your willingness to work for [COMPANY]? [1: substantially decrease; 7: substantially increase]
2. Wage fairness: How fair do you think the wages that [COMPANY] pays its employees are? [1: Not at all fair, 7: Very fair]
3. Purchase intention: Now imagine that you need to buy a necessary household item. Given the information above, how likely are you to purchase a necessary household item from [COMPANY]? [1: not at all likely, 7: very likely]
Secondary outcome measure: comprehension, measured by the number of comprehension questions participants answer correctly (out of five).
In these questions, comprehension of different elements regarding the GPG were tested, including:
● The mathematical meaning of a certain GPG difference (question 1), ● The difference between equal pay and the GPG (question 2) ● Interpretation of pay quartiles in a company (question 3) ● The meaning of a difference in average hourly wages between men and
women, and what can be done to close it (questions 4 and question 5).
The questions are described below and correct answers are underlined. The display of these questions to participants can be seen in Appendix 7.
1. Imagine that on average, male employees at [COMPANY] earn 10,000 pounds a year. Women and men work on average the same hours in this company. How much would the average female employee make a year?
This is an open text question, with a hint that read: “the answer should be between 0 and 10,000”. [Correct answer: 9,700/8,200/6,300]
2. Which of the following statements is true?
a. At [COMPANY], 97%/82%/63% of women earn on average the same hourly rate as men.
17
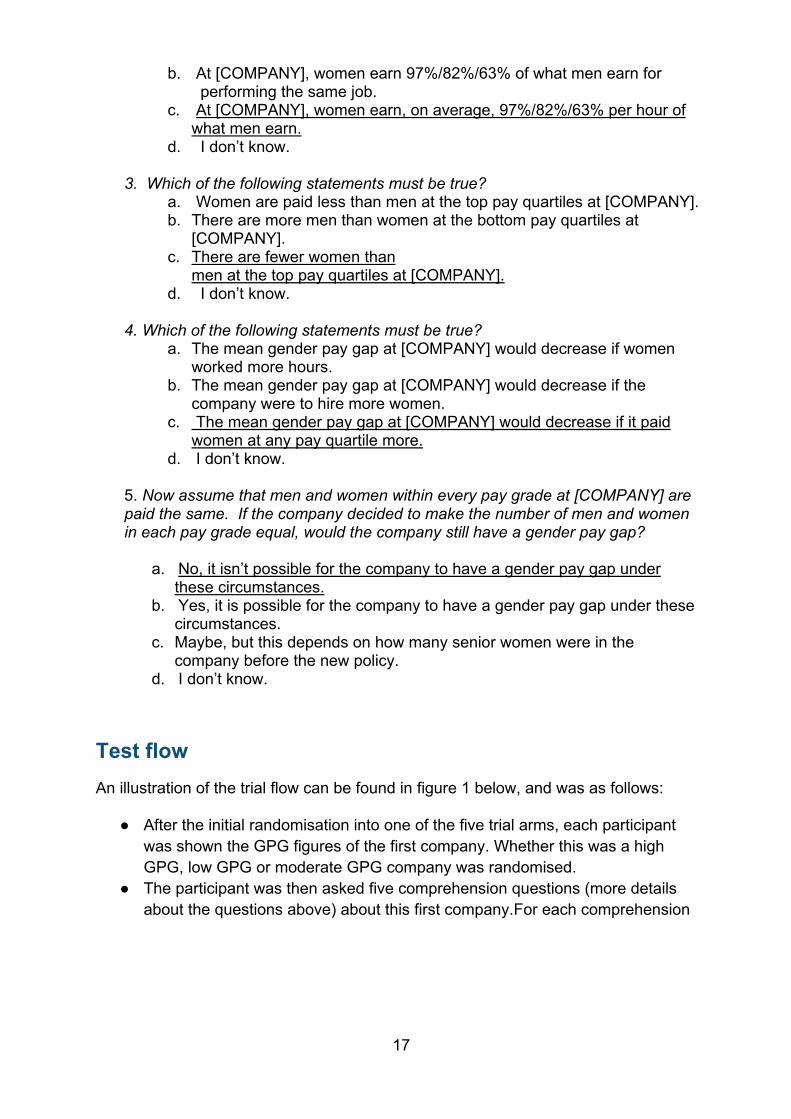
b. At [COMPANY], women earn 97%/82%/63% of what men earn for performing the same job.
c. At [COMPANY], women earn, on average, 97%/82%/63% per hour of what men earn.
d. I don’t know.
3. Which of the following statements must be true? a. Women are paid less than men at the top pay quartiles at [COMPANY]. b. There are more men than women at the bottom pay quartiles at
[COMPANY]. c. There are fewer women than
men at the top pay quartiles at [COMPANY]. d. I don’t know.
4. Which of the following statements must be true?
a. The mean gender pay gap at [COMPANY] would decrease if women worked more hours.
b. The mean gender pay gap at [COMPANY] would decrease if the company were to hire more women.
c. The mean gender pay gap at [COMPANY] would decrease if it paid women at any pay quartile more.
d. I don’t know.
5. Now assume that men and women within every pay grade at [COMPANY] are paid the same. If the company decided to make the number of men and women in each pay grade equal, would the company still have a gender pay gap?
a. No, it isn’t possible for the company to have a gender pay gap under
these circumstances. b. Yes, it is possible for the company to have a gender pay gap under these
circumstances. c. Maybe, but this depends on how many senior women were in the
company before the new policy. d. I don’t know.
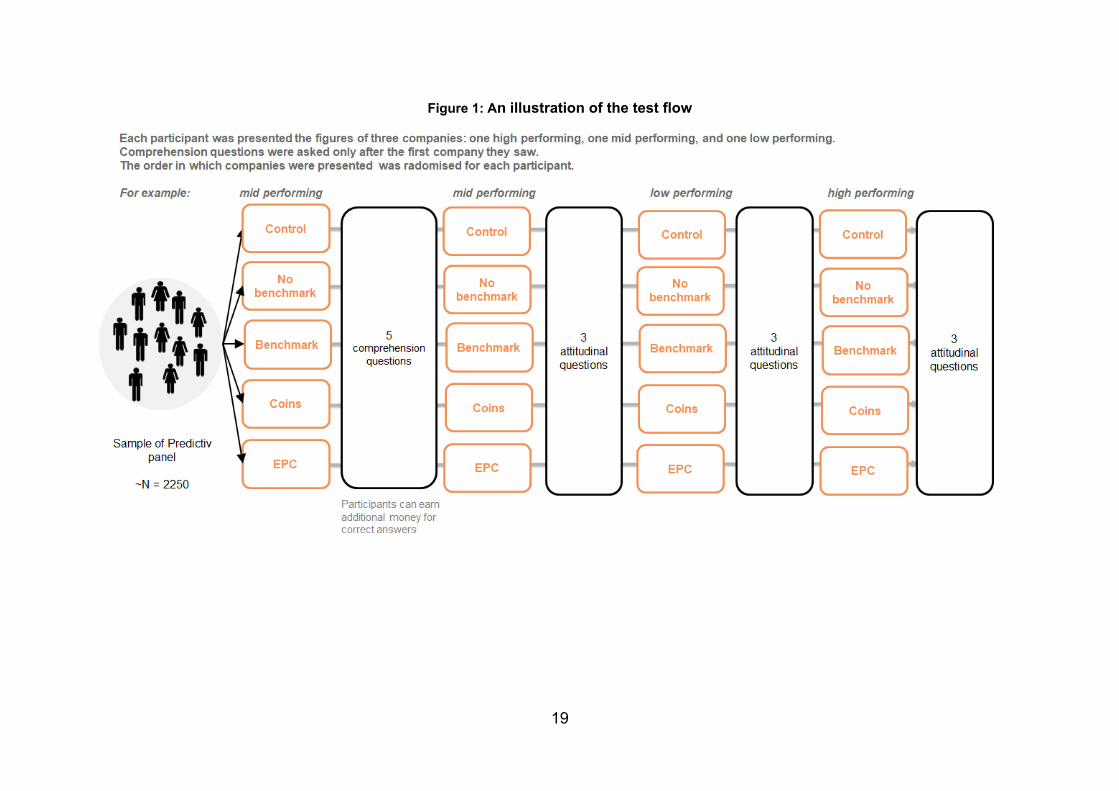
Test flow An illustration of the trial flow can be found in figure 1 below, and was as follows:
● After the initial randomisation into one of the five trial arms, each participant was shown the GPG figures of the first company. Whether this was a high GPG, low GPG or moderate GPG company was randomised.
● The participant was then asked five comprehension questions (more details about the questions above) about this first company.For each comprehension

18
question participants answered correctly, they received a small additional payment.9
● Next, participants were shown the GPG figures of three companies (one was the company they had already seen at the comprehension stage) together with three attitudinal questions for each company. The companies were each presented separately, and in a random order to avoid ordering effects (see more details below under Randomisation).
In addition, an illustration of the test flow from the perspective of the participants, including the materials that were presented, can be found in the screen shots in Appendix 7.
Randomisation
Randomisation was conducted at the individual level through a code embedded on the landing page. Randomisation occurred twice: 1. Participants were randomised into one of five distinct trial arms. 2. The order in which companies (the low, mid or high GPG company) were
presented was randomised for each participant. This was carried out to avoid biasing effect that can occur due to the order in which companies were presented. This biasing effect can be due to: ● Anchoring: a tendency to disproportionately rely on an initial piece of
information received.10 For instance, when someone is presented with the company with the high GPG (37%) first, attitudes towards the next companies seen are likely to be formed based on a mental comparison to a 37% GPG.
● Fatigue: after answering many questions, participants may lose their patience, which may influence the way they answer the attitudinal questions towards the end.
9 This is in addition to a fix payment for completing the test. Incentivisation is mainly introduced to focus the attention of participants and to reduce various sources of response bias. See for instance: Schwarz, N. (1999). Self-reports: How the questions shape the answers. American psychologist, 54(2), 93. The level of payment is in line with other financial compensation for the participant’s time, and is in line with current practice for online economic experiments. See for instance: Amir, O., & Rand, D. G. (2012). Economic games on the internet: The effect of $1 stakes. PloS one, 7(2), e31461. 10 Furnham, A., & Boo, H. C. (2011). A literature review of the anchoring effect. The Journal of Socio-Economics, 40(1), 35-42.
19
Figure 1: An illustration of the test flow

3. Results
Effect of GPG figures on public attitudes towards employers To recap, we defined a positive outcome on participants’ attitudes as a bigger difference in attitudes between the company with the high GPG and the company with the low GPG (such that attitudes were more negative towards the high GPG company and more positive towards the low GPG company), compared to the control condition. In the control condition, the difference between participants’ attitudes towards companies with high GPGs and low GPGs was 1.52 (Figure 2). We find that compared to the control arm, the Coins condition performed best, with a difference in attitudes of 1.86 (an increase of 22% compared to the control arm).11 The result was significant at (p<.01), so we are confident that the changes we observed in our experiment are not due to chance. To interpret this, it is easiest to refer to Figure 3: compared to the control condition, participants who saw the GPG figures represented as coins had more positive attitudes towards the company with the low GPG and more negative attitudes towards companies with high GPG. This suggests that when GPG figures are presented in the coin format, participants are better at distinguishing between the low-GPG and high-GPG companies. The benchmarking condition also performed significantly better than the control arm (p<.05), although the effect was smaller than that of the Coins arm (1.71 instead of 1.86). The effects of the remainder of the trial arms (No Benchmark and EPC) were not statistically different from the control arm.
11 All results and graphs are presented after adjusting (controlling) for covariates. This was done because of a slight imbalance in the distribution of people with low incomes across the trial arms (see more details in the Appendix 4 ). Please note that even without controlling for covariates, the main results regarding the performance of the Coins condition remains statistically significant at a 5% level.

21
Figure 2: difference between attitudes towards the high and low performing company, by trial arm

22
Figure 3: The distribution of attitude scores for high, moderate and low GPG companies, by trial arm
Note on interpretation of Figure 3: Attitude scores are displayed as box-and-whisker plots.
The inner rectangle represents the interquartile range (IQR) of the atitudes score: the middle line represents the median, the top edge represents the third quartile, the bottom edge the first quartile. The “whiskers” coming out of the IQR represent the minimum and
maximum values.
Effect of GPG figures on public understanding of the GPG (comprehension) In the control arm, participants answered on average 2.88 questions out of 5 correctly (Figure 4). One way to contextualise this is by considering how many questions the participants would get right if they just randomly guessed. If they answered randomly, the probability is such that they would get 1.67 answers out of 5 correct. This means that participants’ existing knowledge coupled with the information provided in the control arm constitute a comprehension level that is substantially better than just guessing. When comparing the comprehension levels to the control arm, the Coins arm performed better, with participants answering 3.12 questions correctly. This is an increase of roughly a quarter of a question, and is statistically significant (p<.01).

23
Figure 4:The number of questions participants answered correctly, by trial arm
To understand the meaning of this increase in the total score, it is helpful to look at the increases in comprehension for each of the five questions (Appendix 3). The increases observed in the results came from more participants answering Questions 2, 4 and 5 correctly. There was a:
● 10% increase in the number of participants correctly answering Question 2 about the hourly rates figures. This increase likely represents an increased understanding that the GPG is not the same as equal pay.
● 5.5% and 3.5% increase in the number of participants correctly answering Questions 4 and 5, respectively. These questions were about the meaning of the GPG hourly rate figures and what would reduce them. So these increases are likely to reflect a deeper understanding of the drivers of a GPG in a company.
The No Benchmarking and Benchmarking arms did not result in higher comprehension scores than the control arm, suggesting that the bar graph format (plus the explanation that the GPG is not the same as equal pay) is not effective at improving comprehension.

24
It is also interesting to point out that comprehension in the Benchmarking arm was not lower than in the Control or No Benchmarking arms. This suggests that even though more information was provided in the Benchmarking arm, it did not result in information overload. This might be because it was designed and explained in a way that did not cause additional burden. However, this was not the case in the EPC arm. The EPC arm reduced comprehension compared to the control arm by roughly 0.33 points, or a third of a question, which is significantly different from the control (p<0.01) (Figure 4). The decreased comprehension relative to the control arm is primarily driven by a large drop in comprehension on Question 1, in which participants were asked to calculate how much a women would earn in the company they saw, given the GPG that was presented (Appendix 3). This suggests that the benchmarking information provided in the EPC arm perhaps caused confusion and additional informational burden to participants, in a way that the benchmarking information in the Benchmarking and Coin arms did not. The percentage of participants that answered each questions correctly, by trial arm, can be found in Appendix 3
Additional exploratory results: willingness to visit the GPG viewing service Displaying the figures as money, together with benchmarking information, may be beneficial for engaging users on the GPG viewing service: when asked whether they would be likely to visit the GPG viewing service in the future, participants in the Coins arm were most likely to respond positively (Figure 5). While this is only suggestive evidence,12 it is intuitive because people prefer engaging with materials they can understand.
12 Please note that this is only suggestive evidence for two reasons. The first, we do not measure actual behaviour, but stated intentions. Second, we speculate that this result may have been driven by participants feeling positive about themselves after answering questions more easily which may have led to a more positive answer in this particular question.
25
Figure 5: The stated likelihood participants would visit the GPG viewing service, by trial arm

26
4. Conclusion The UK government was the first in the world to require employers to make public their gender pay gap figures (the difference in hourly wages between men and women). This landmark legislation enables one of the most powerful behavioural mechanisms, transparency, to begin shifting how employers think about and act on their gender pay gaps. But transparency only helps change employer behaviour if people can hold employers to account. This means that the public has to correctly interpret the information they’re given and use it to drive decisions such as what to purchase and where to work. The big question we wanted to answer in this research was ‘How should gender pay gap information be presented to drive change effectively?’ We wanted to find a way to present the information in a way that helps the public identify which companies are doing better than others, understand what the figures mean, and hold the right companies to account. Behavioural science tells us that how a given piece of information is presented (or ‘framed’) can have a big impact on how people react to it. With regard to the gender pay gap figures, we theorised that a few principles could be particularly powerful: making the figures more concrete and relatable (for example by translating them into monetary terms), providing more contextual information on how an employer is doing compared to others (i.e. benchmarking), and using appealing visual representations (such as those used in energy efficiency charts on household appliances). We found that when people were only shown the figure as a percentage (in the control arm) their attitudes were similar towards companies with low and high gender pay gaps. This is best illustrated by the very similar attitudes we found towards companies with an 18% and 37% gender pay gap (Figure 3). In other words, without any comparative information, people would not be well placed to hold the right companies to account. Once we added benchmarking information that was well designed, however, people’s attitudes shifted in a way that reflects a better ability to distinguish between poor and high performing companies. So for transparency mechanisms to work effectively, the public should be provided with information about how each company is doing compared to others.
But it is possible to further improve on benchmarking. When the figures were presented as money, and visually as piles of coins, together with benchmarking information (comparing the company to others), people’s attitudes were most accurate and

27
comprehension was highest. This may be because coins were more concrete and easier to relate to than percentages - a finding that is in line with earlier research.13
Finally, somewhat to our surprise, using a visual representation similar to energy efficiency charts (the ‘EPC’ arm) was the least effective way to present the information and actually performed worse than expressing the gap as a percentage. This suggests that simply moving from numbers to a visual representation may not always help - even if it has been effective in driving behaviours in other contexts. The benefit of testing the different framing options online allowed us to conclude that the EPC approach would not be effective for conveying gender pay gap information.
As a direct result of this research, the current live version of GPG viewing service now shows every employer’s GPG as money in addition to the percentage.14
13 DelVecchio, D., Krishnan, H.S. and Smith, D.C. (2007), “Cents or percent? The effects of promotion framing on price expectations and choice”, Journal of Marketing, Vol. 71 No. 3, pp. 158-170 14 The exact wording on the website is for example: Women’s mean hourly rate is 15.1% lower than men’s. In other words when comparing mean hourly rates, women earn 85P for every £1 that men earn.

28
Appendix 1: Sample demographics
Table 3: Demographic characteristics of the sample
percentage of participants Gender Male 52 Female 48 Age 18-22 11 25-34 18 35-44 17 45-54 18 55-64 21 65+ 15 Education No education 1 Secondary 25 Post-secondary 18 Vocational qual. 18 Prof. qual 6 Undergrad. 24 Postgrad 8 Location North 28 South & East 31 Midlands 15 London 10 Wales, Scotland, N Ireland 16 Income < £10,000 11 £10,000 - £19,999 23 £20,000 - £39,999 37 £40,000 or more 29

29
Appendix 2: Attitude questions Table 4: Average attitudes score of all companies, by trial arm
Q1 (purchase intention) Q2 (wage fairness) Q3 (work intention)
Control 4.08 3.25 3.48
No Benchmark 3.9 3.12 3.62
Benchmark 4.04 3.41 3.46
Coins 4.1 3.47 3.69
EPC 3.98 3.17 3.47
Scores ranges from 1 (Very unlikely, Very unfair, Substantially decrease) to 7 (Very likely, Very fair, Substantially increase)

30
Appendix 3: Comprehension questions Table 5: The proportion of participants that answered each question correctly, by trial arm
Q1 Q2 Q3 Q4 Q5
Control 69.31 58.66 53.65 49.06 57.62
No Benchmark 72.35 68.63 49.8 52.55 57.65
Benchmark 69.19 66.82 48.82 45.97 60.19
Coins 70 68.89 54 54.44 61.11
EPC 38.58 61.41 49.78 48.28 56.47

31
Appendix 4: Balance checks
Sample balance
The final sample is balanced on all targeted variables: age, gender, income, education and location. However, within the income category, there are slight significant differences in the of participants distribution within the low income segment (<£40k).
We found that slightly more participants who earned <£10k were found in the EPC (24.49%) treatment arm and less in the control (14.29%), compared to people earning £10-£20k (15.80% and 21.56%). Therefore all results in this report are covariate-adjusted results. Please note that even without this adjustment, the headline result (the Coins arm performing best) hold.
Figure 6: Distribution of income categories across treatment and control conditions

32
Drop out
Of 284 who dropped out, 40 participants did so after having been exposed to treatment. For drop-out post exposure, OLS (and logistic regressions as robustness checks) indicated that participants aged 35-44 or from the Midlands were more likely to drop out.
Table 6: Overview of completions and drop-outs, by trial arm
Completed Dropped out Percentage completed
Control 480 49 90.74 %
No Benchmark 510 60 89.47 %
Benchmark 422 62 87.19 %
Coins 449 59 88.39 %
EPC 464 54 89.58 %
Total 2,325 284 89.11%

33
Appendix 5: Analytical strategy Primary analysis: attitudes
Reg 1: |𝐴𝐴𝑖𝑖| = 𝛼𝛼 + 𝛽𝛽1𝑇𝑇𝑖𝑖 + 𝜖𝜖𝑖𝑖
We use an OLS regression to test the effect of treatment status (T) on differential attitudes (|A|). To better understand the differences between treatment effects, we use pairwise comparisons. We will use the same model as Reg1 above. The p-value for these tests will be adjusted using the Hochberg Step-up Procedure. The p-value for each of the comparisons is summarised below.
Overview of adjusted p-values 0.1 0.05 0.01
1 C vs T1, T2, T3, T4
0.1 0.05 0.01
2 T1 vs C, T2, T3, T4
0.08 0.04 0.004
3 T2 vs C, T1, T3, T4
0.06 0.03 0.003
4 T3 vs C, T1, T2, T4
0.04 0.02 0.002
5 T4 vs C, T1, T2, T3
0.02 0.01 0.001
We refrain from adjusting for comprehension in this test as comprehension is a posttreatment variable which is likely to have been affected by the treatment. According to Rosenbaum (1984) in such a situation, the treatment effect could be partially observed by the posttreatment variable; however adjusting for it would bias the estimate too. Instead we will present analyses for attitudes and comprehension separately. Secondary analysis 1: comprehension.
1. We will test whether there is a significant relationship between attitudes and comprehension: Reg 2: 𝐶𝐶𝑖𝑖 = 𝛼𝛼 + 𝛽𝛽1|𝐴𝐴𝑖𝑖| + 𝜖𝜖𝑖𝑖
𝐶𝐶𝐶𝐶 is the total comprehension score for participant i

34
𝑃𝑃𝑖𝑖 iis a vector of dummies for the type of graph that was presented to participant i, where the dummy equals one when the presented company is
● first dummy:mid performer in terms of GPG ● second dummy:high performer in terms of GPG
Secondary analysis 2: attitude by company type. In order to test for interaction effects of company type and treatment, we will use an OLS regression to estimate the following model:
Reg 4: 𝐴𝐴𝑖𝑖𝐹𝐹𝑖𝑖𝐹𝐹𝐹𝐹𝐹𝐹 = 𝛼𝛼 + 𝛽𝛽1𝑇𝑇𝑖𝑖 + 𝛽𝛽2𝑃𝑃𝑖𝑖 + 𝛽𝛽3 𝑇𝑇𝑖𝑖 × 𝑃𝑃𝑖𝑖 + 𝜖𝜖𝑖𝑖 𝑃𝑃𝑖𝑖 indicates that type of graph that was presented to participant i, where the company is
● 0: low performer in terms of GPG ● 1: mid performer in terms of GPG ● 2: high performer in terms of GPG
35
Appendix 6: Additional descriptives
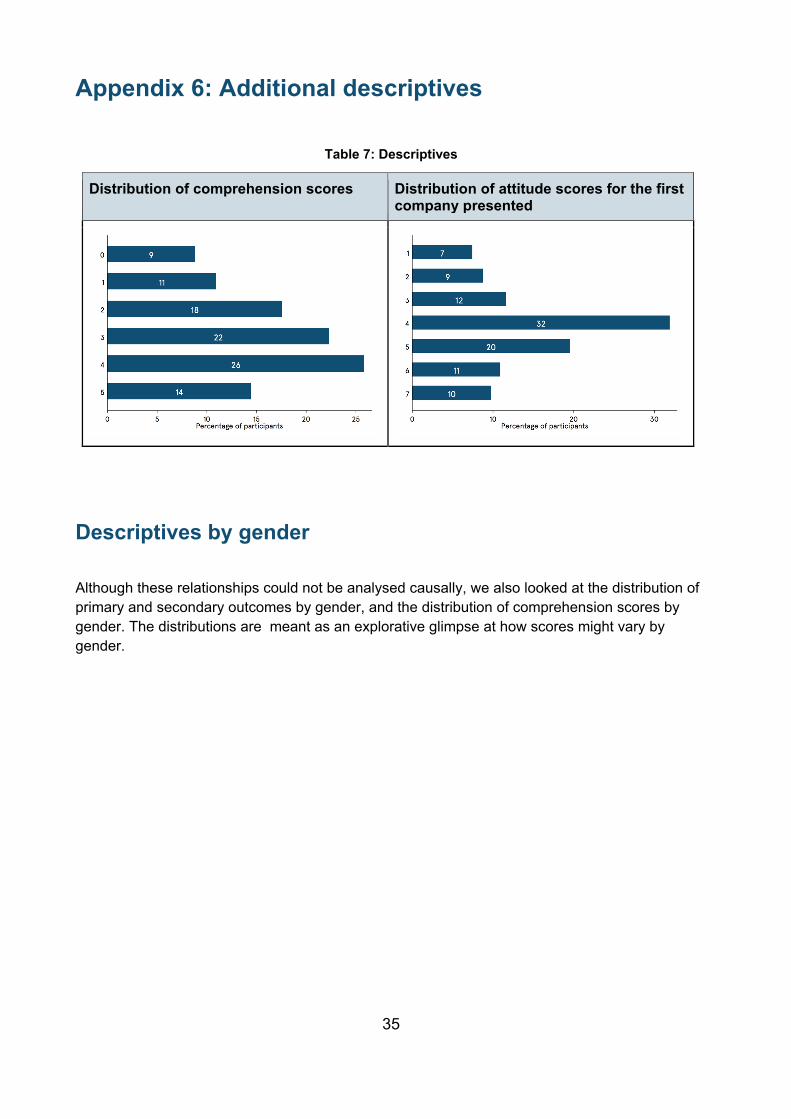
Table 7: Descriptives
Distribution of comprehension scores Distribution of attitude scores for the first company presented
Descriptives by gender Although these relationships could not be analysed causally, we also looked at the distribution of primary and secondary outcomes by gender, and the distribution of comprehension scores by gender. The distributions are meant as an explorative glimpse at how scores might vary by gender.

36
Figure 6: Average attitude score towards company with high GPG, by gender
Figure 7: Average attitude score towards company with moderate GPG, by gender

37
Figure 8: Average attitude score towards company with low GPG, by gender
Figure 9: Average comprehension scores, by gender

38
Appendix 7: Screenshots (Coins arm only)
Screen 1: introduction

39
Screen 2: The GPG is not equal pay (not shown in Control arm)
Screen 3: Instructions to comprehension questions

40
Screen 4: Comprehension questions 1

41
Screen 5: comprehension questions 2

42
Screen 6: comprehension questions 3
Screen 7: Introduction to attitudinal questions

43
Screen 8: Attitudinal questions – first company

44
Screen 9: Attitudinal questions – second company

45
Screen 10: Attitudinal questions – third company
46
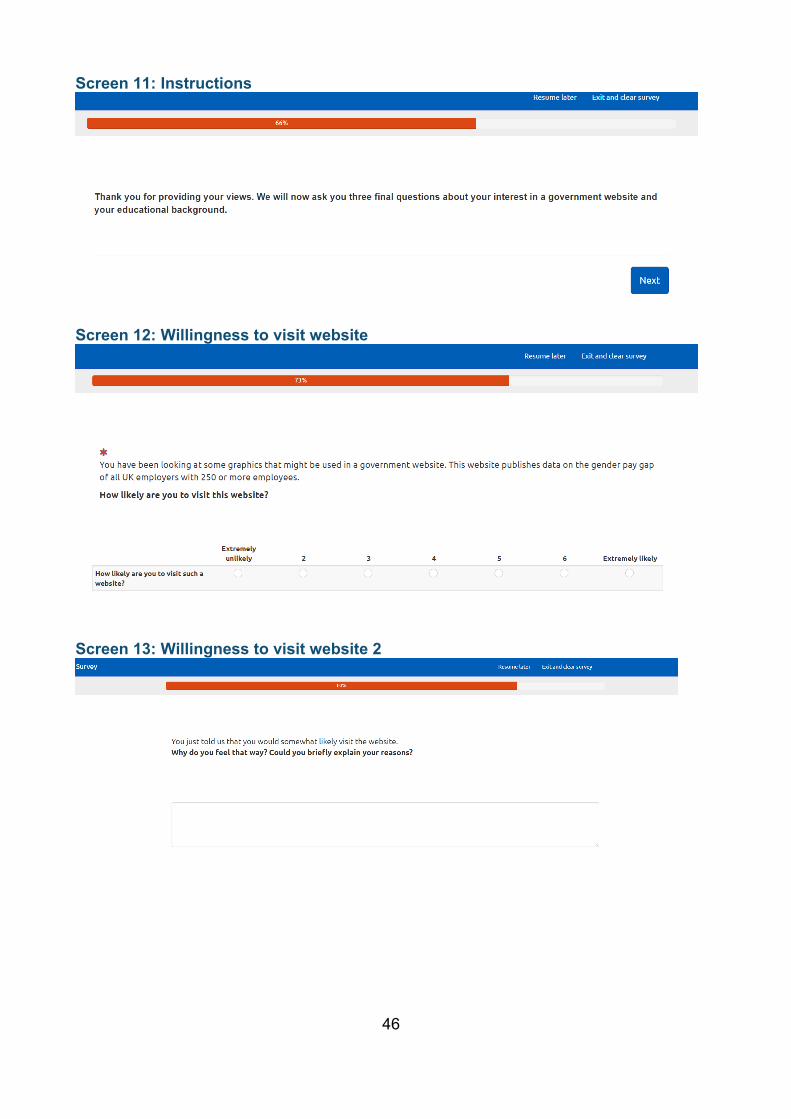
Screen 11: Instructions
Screen 12: Willingness to visit website
Screen 13: Willingness to visit website 2

47
Bibliography Amir, O., & Rand, D. G. (2012). Economic games on the internet: The effect of $1 stakes. PloS one, 7(2), e31461. Bauer, M. I., & Johnson-Laird, P. N. (1993). How diagrams can improve reasoning. Psychological science, 4(6), 372-378. Ben-Shahar, O., & Schneider, C. E. (2014). More than you wanted to know: The Failure of Mandated Disclosure. Princeton University Press.DelVecchio, D., Krishnan, H.S. and Smith, D.C. (2007), “Cents or percent? The effects of promotion framing on price expectations and choice”, Journal of Marketing, Vol. 71 No. 3, pp. 158-170
Fung, A., Graham, M., & Weil, D. (2007). Full disclosure: The perils and promise of transparency. Cambridge University Press.
Furnham, A., & Boo, H. C. (2011). A literature review of the anchoring effect. The Journal of Socio-Economics, 40(1), 35-42.
Elfenbein, D. W., Fisman, R., & McManus, B. (2012). Charity as a substitute for reputation: Evidence from an online marketplace. Review of Economic Studies, 79(4), 1441-1468. Loewenstein, G., Sunstein, C., & Golman, R. (2014). Disclosure: Psychology Changes Everything. Annual Review of Economics, 6(1), 391-419
Mohan, B., Schlager, T., Deshpandé, R., & Norton, M. I. (2018). Consumers Avoid Buying From Firms With Higher CEO‐to‐Worker Pay Ratios. Journal of Consumer Psychology, 28(2), 344-352.
Office of National Statistics. (2017). Statistical bulletin: Annual Survey of Hours and Earnings: 2017 provisional and 2016 revised results. Acessed: https://www.ons.gov.uk/employmentandlabourmarket/peopleinwork/earningsandworkinghours/bulletins/annualsurveyofhoursandearnings/2017provisionaland2016revisedresults Scaife, M., & Rogers, Y. (1996). External cognition: how do graphical representations work?. International journal of human-computer studies, 45(2), 185-213.
Schwarz, N. (1999). Self-reports: How the questions shape the answers. American psychologist, 54(2), 93.
Zlatevska, N., Neumann, N., & Dubelaar, C. (2017). Mandatory calorie disclosure: a comprehensive analysis of its effect on consumers and retailers. Journal of retailing, 1-13.

48
Reference: DFE-RR828
ISBN: 978-1-78105-914-2
The views expressed in this report are the authors’ and do not necessarily reflect those of the Government Equalities Office.
Any enquiries regarding this publication should be sent to us at: www.geo.gov.uk/contactus
This document is available for download at www.gov.uk/government/publications