press conference | february 9, 2011
TRANSCRIPT
Press Conference | February 9, 2011
2 | February 9, 2011 | The 7th Annual AP Report to the Nation
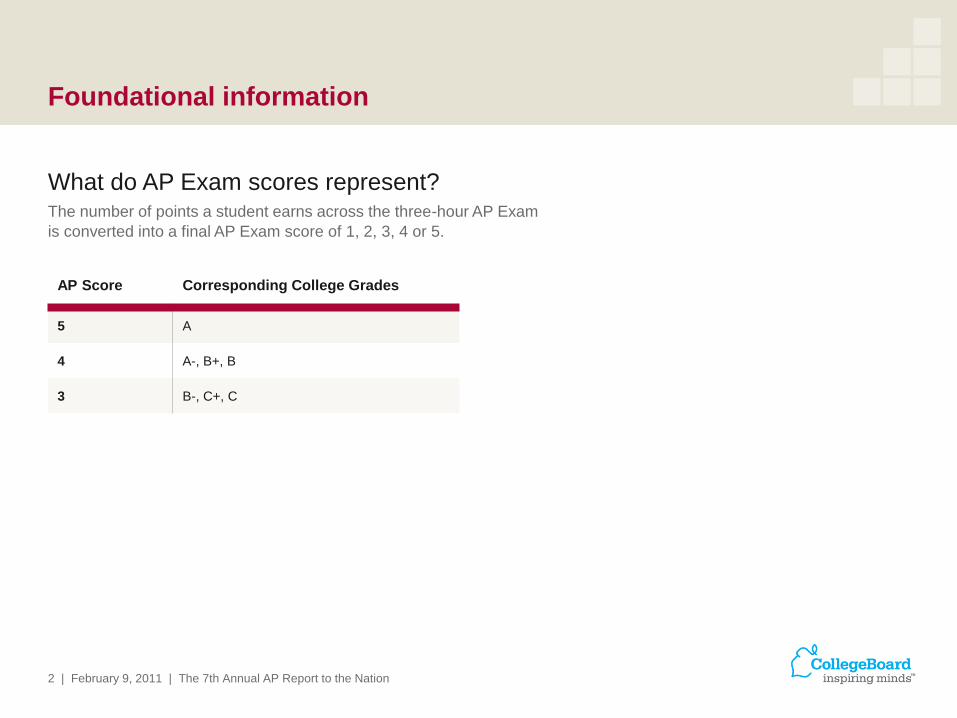
Foundational information
What do AP Exam scores represent? The number of points a student earns across the three-hour AP Exam
is converted into a final AP Exam score of 1, 2, 3, 4 or 5.
AP Score Corresponding College Grades
5 A
4 A-, B+, B
3 B-, C+, C
3 | February 9, 2011 | The 7th Annual AP Report to the Nation
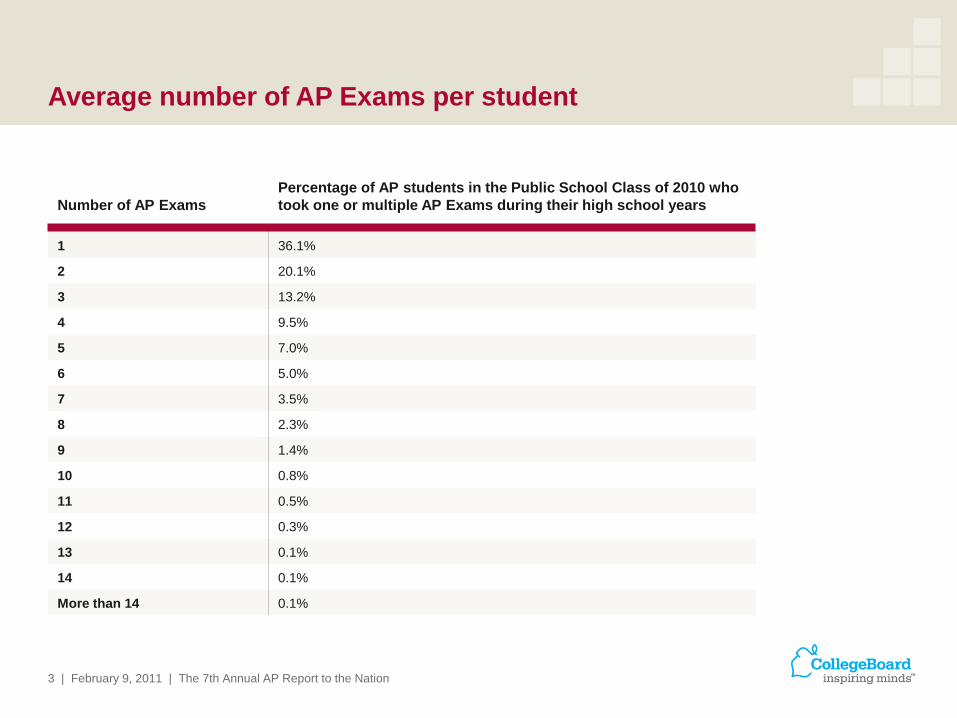
Average number of AP Exams per student
Number of AP Exams
Percentage of AP students in the Public School Class of 2010 who
took one or multiple AP Exams during their high school years
1 36.1%
2 20.1%
3 13.2%
4 9.5%
5 7.0%
6 5.0%
7 3.5%
8 2.3%
9 1.4%
10 0.8%
11 0.5%
12 0.3%
13 0.1%
14 0.1%
More than 14 0.1%
4 | February 9, 2011 | The 7th Annual AP Report to the Nation
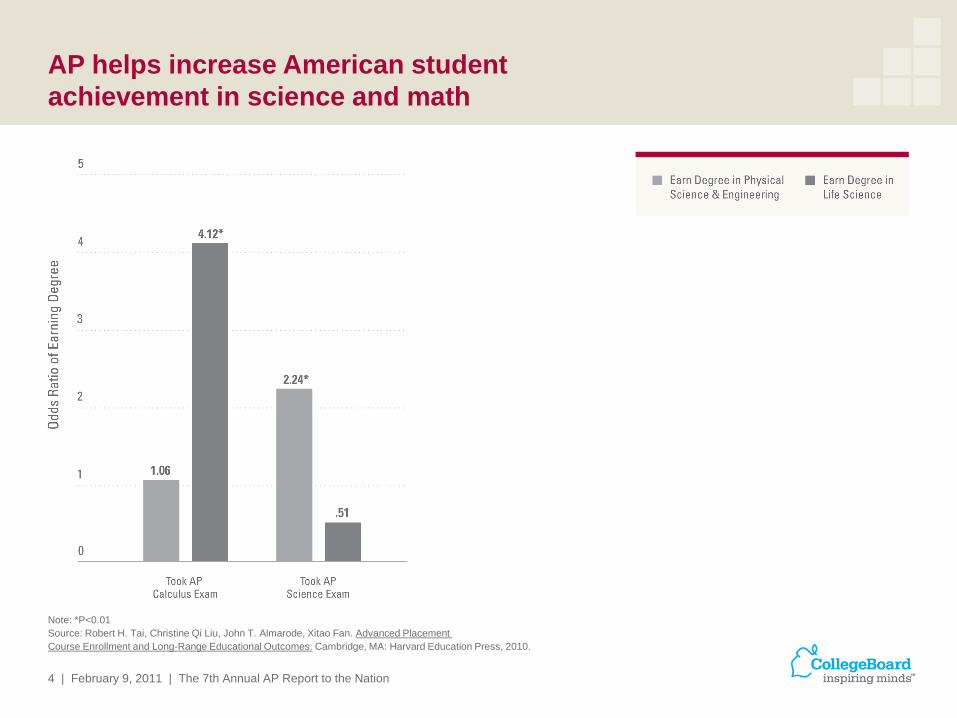
AP helps increase American student
achievement in science and math
Note: *P<0.01
Source: Robert H. Tai, Christine Qi Liu, John T. Almarode, Xitao Fan. Advanced Placement
Course Enrollment and Long-Range Educational Outcomes. Cambridge, MA: Harvard Education Press, 2010.

5 | February 9, 2011 | The 7th Annual AP Report to the Nation
AP helps increase American student
achievement in science and math
Female
Students Who:
African American
Students Who:
Hispanic
Students Who:
Course
Took AP &
Chose Major
Did Not Take
AP & Chose
Major
Took AP &
Chose Major
Did Not Take
AP & Chose
Major
Took AP &
Chose Major
Did Not Take
AP & Chose
Major
Biology 20% 6% 18% 6% 16% 4%
Chemistry 15% 1% 14% 2% 13% 2%
Computer Science A 11% 1% 14% 2% 17% 2%
Calculus AB 11% 4% 21% 9% 23% 8%
Calculus BC 16% 4% 28% 9% 23% 6%
Physics B 16% 3% 31% 7% 25% 8%
Physics C: Mechanics 22% 3% 29% 6% 41% 7%
Physics C: Electricity &
Magnetism
25% 2% 48% 6% 47% 7%
Source: Rick Morgan and John Klaric. AP Students in College: An Analysisof
Five-Year Academic Careers. New York: The College Board, 2007.
6 | February 9, 2011 | The 7th Annual AP Report to the Nation
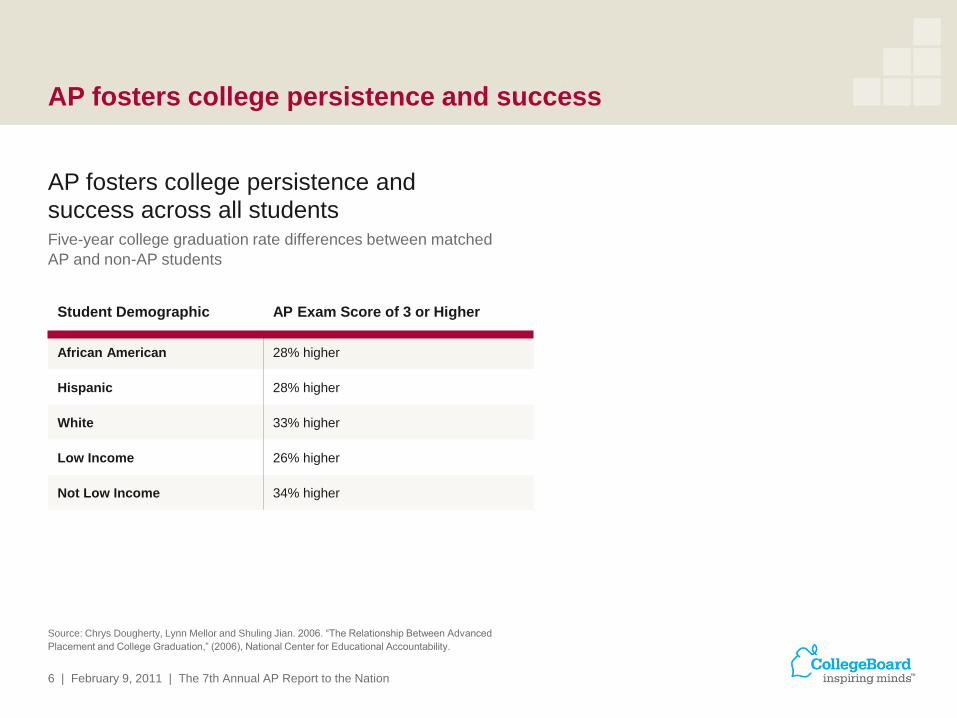
AP fosters college persistence and success
AP fosters college persistence and success across all students Five-year college graduation rate differences between matched
AP and non-AP students
Source: Chrys Dougherty, Lynn Mellor and Shuling Jian. 2006. “The Relationship Between Advanced
Placement and College Graduation,” (2006), National Center for Educational Accountability.
Student Demographic AP Exam Score of 3 or Higher
African American 28% higher
Hispanic 28% higher
White 33% higher
Low Income 26% higher
Not Low Income 34% higher
7 | February 9, 2011 | The 7th Annual AP Report to the Nation
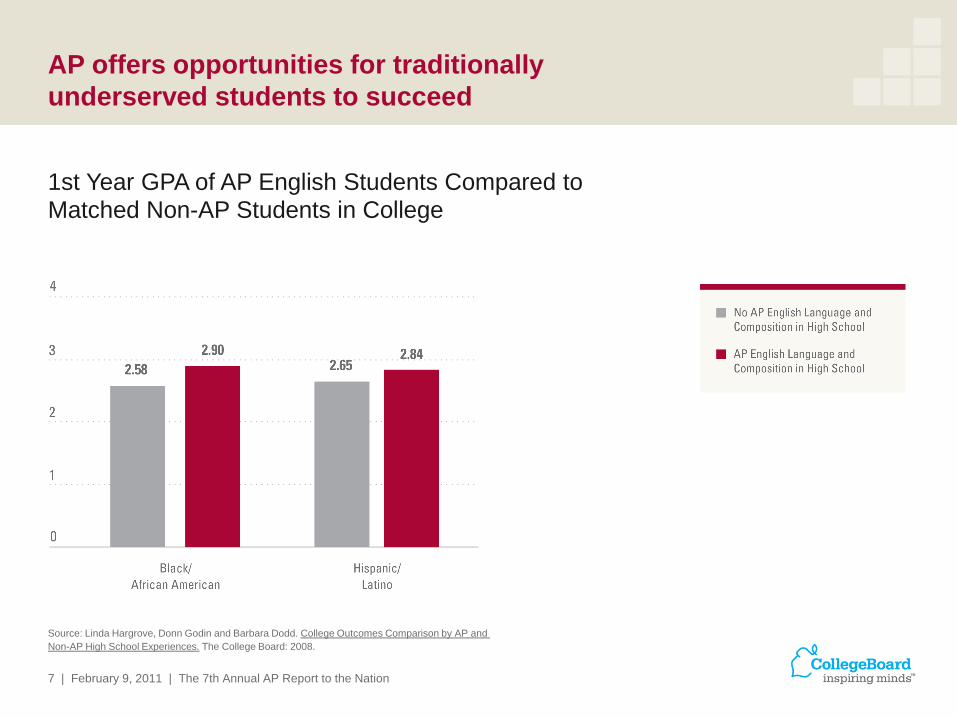
AP offers opportunities for traditionally
underserved students to succeed
1st Year GPA of AP English Students Compared to Matched Non-AP Students in College
Source: Linda Hargrove, Donn Godin and Barbara Dodd. College Outcomes Comparison by AP and
Non-AP High School Experiences. The College Board: 2008.
8 | February 9, 2011 | The 7th Annual AP Report to the Nation
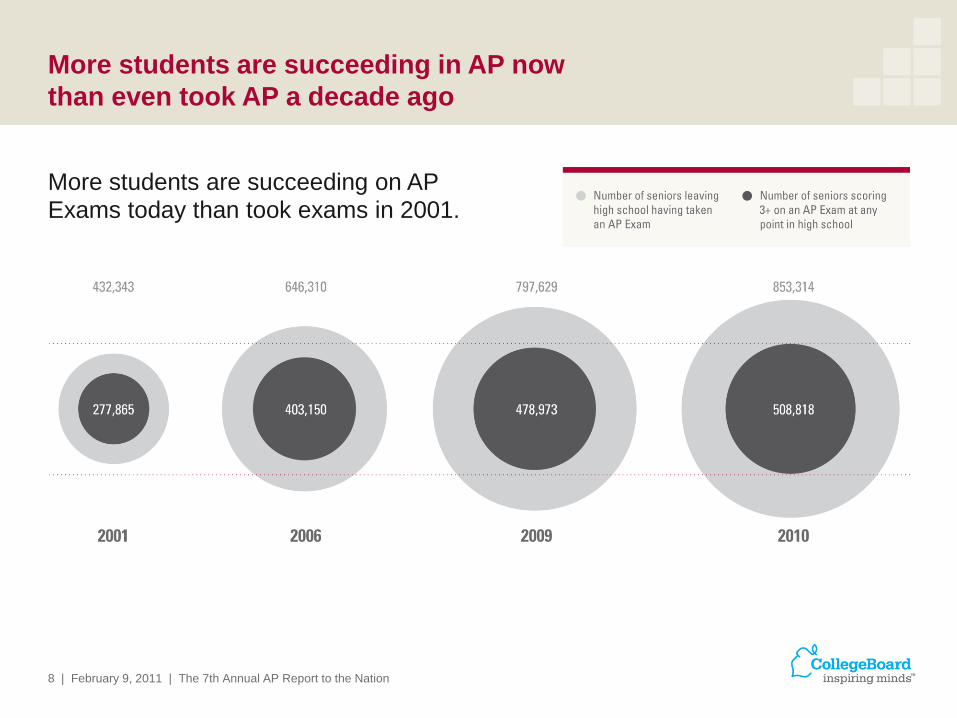
More students are succeeding in AP now
than even took AP a decade ago
More students are succeeding on AP Exams today than took exams in 2001.
9 | February 9, 2011 | The 7th Annual AP Report to the Nation
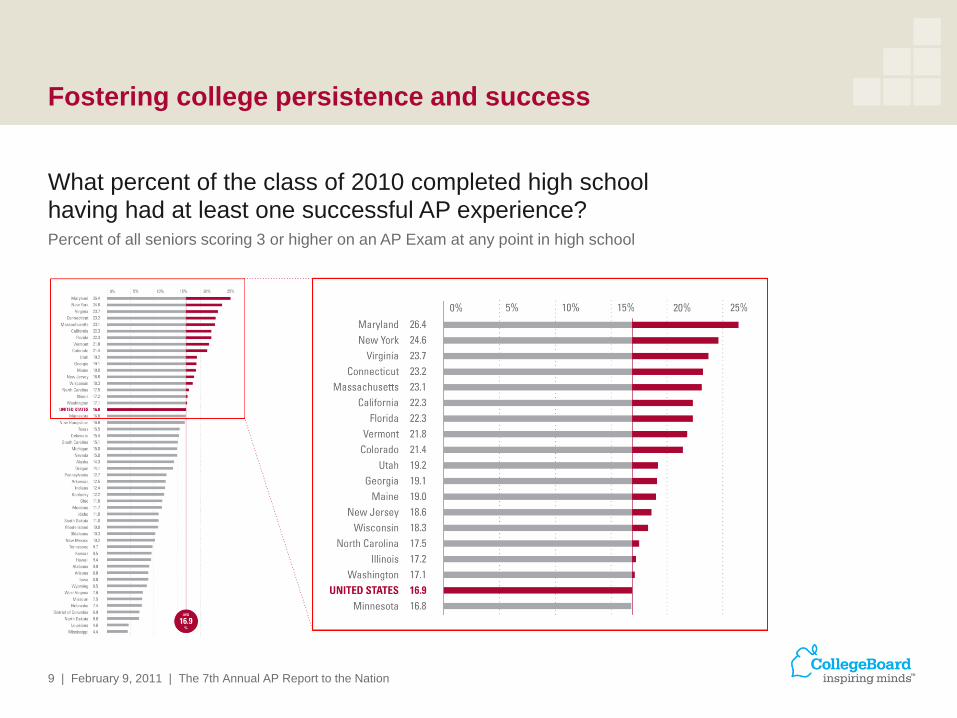
Fostering college persistence and success
What percent of the class of 2010 completed high school having had at least one successful AP experience? Percent of all seniors scoring 3 or higher on an AP Exam at any point in high school
10 | February 9, 2011 | The 7th Annual AP Report to the Nation
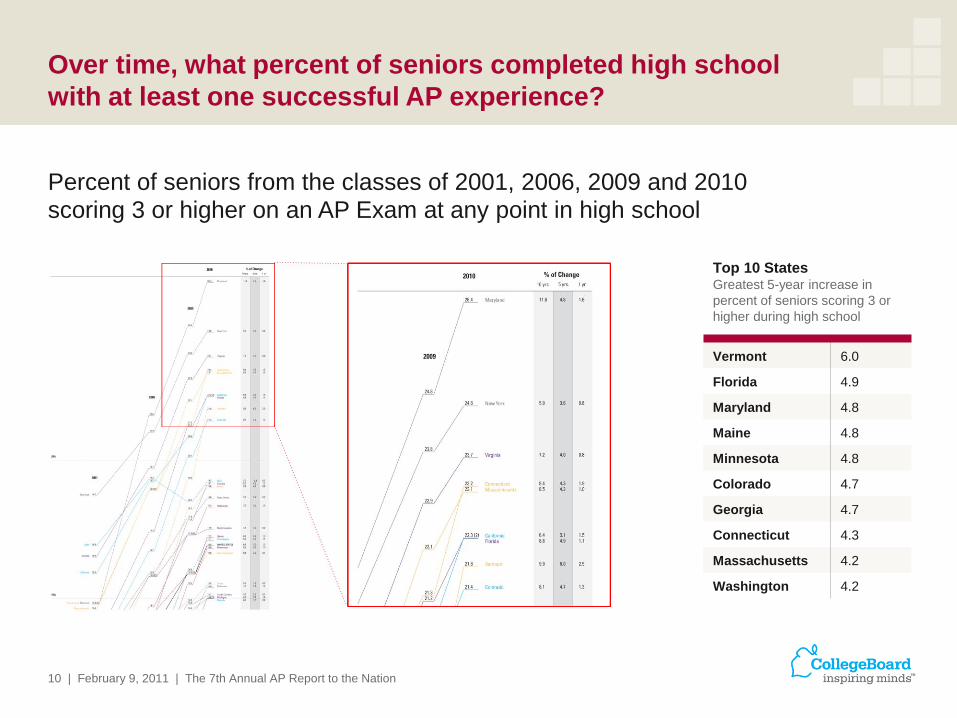
Over time, what percent of seniors completed high school
with at least one successful AP experience?
Percent of seniors from the classes of 2001, 2006, 2009 and 2010 scoring 3 or higher on an AP Exam at any point in high school
Top 10 States Greatest 5-year increase in
percent of seniors scoring 3 or
higher during high school
Vermont 6.0
Florida 4.9
Maryland 4.8
Maine 4.8
Minnesota 4.8
Colorado 4.7
Georgia 4.7
Connecticut 4.3
Massachusetts 4.2
Washington 4.2
11 | February 9, 2011 | The 7th Annual AP Report to the Nation
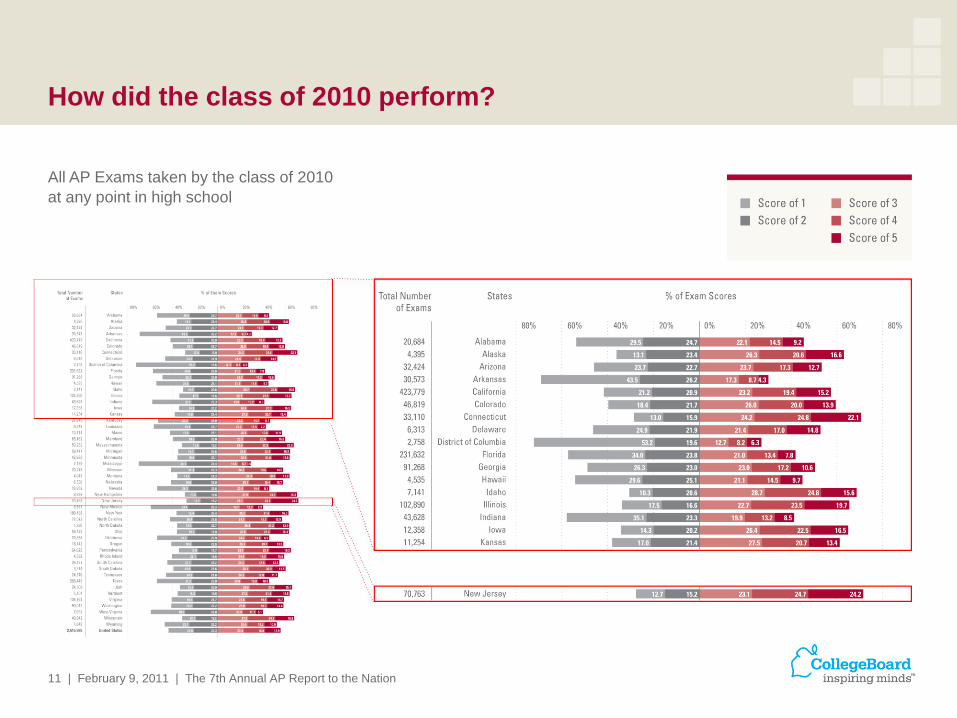
How did the class of 2010 perform?
All AP Exams taken by the class of 2010
at any point in high school
12 | February 9, 2011 | The 7th Annual AP Report to the Nation
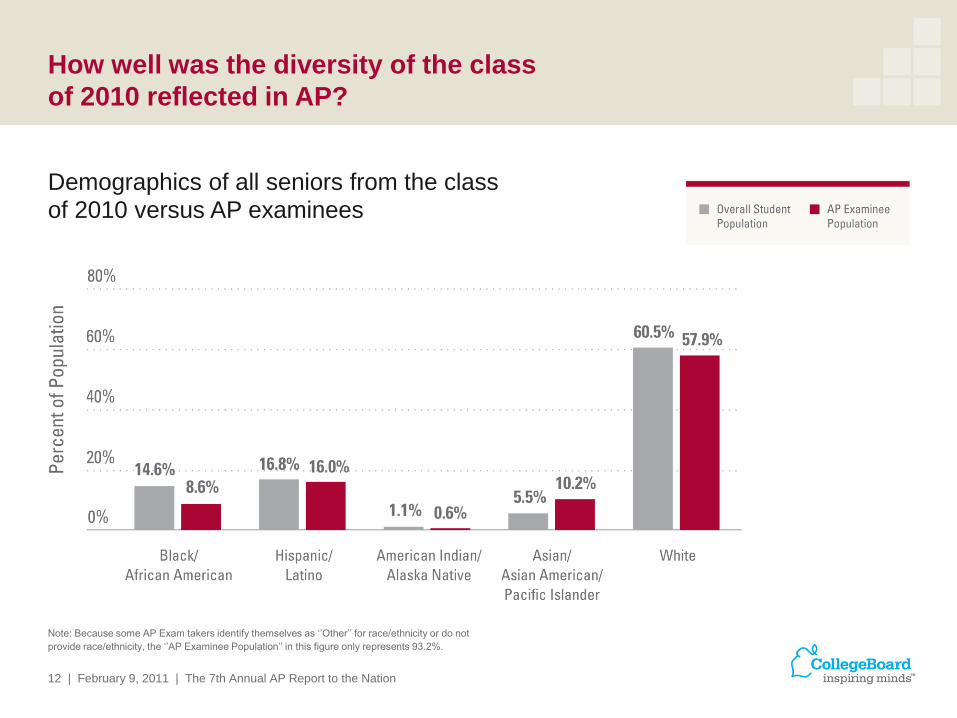
How well was the diversity of the class
of 2010 reflected in AP?
Demographics of all seniors from the class of 2010 versus AP examinees
Note: Because some AP Exam takers identify themselves as „‟Other‟‟ for race/ethnicity or do not
provide race/ethnicity, the „‟AP Examinee Population‟‟ in this figure only represents 93.2%.
13 | February 9, 2011 | The 7th Annual AP Report to the Nation
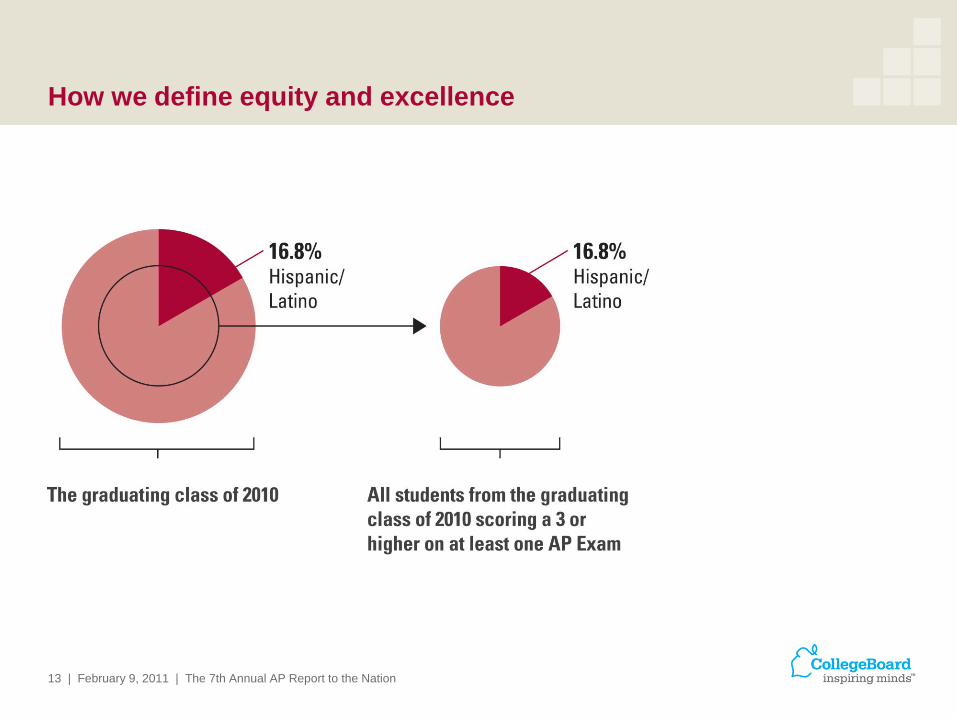
How we define equity and excellence
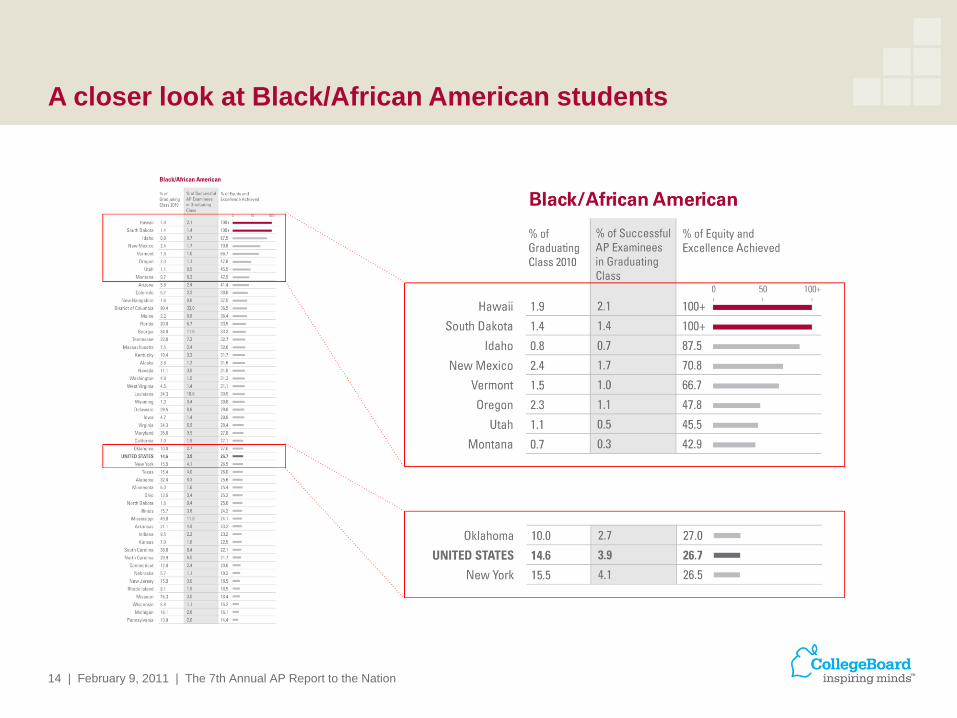
14 | February 9, 2011 | The 7th Annual AP Report to the Nation
A closer look at Black/African American students

15 | February 9, 2011 | The 7th Annual AP Report to the Nation
A closer look at Hispanic/Latino students
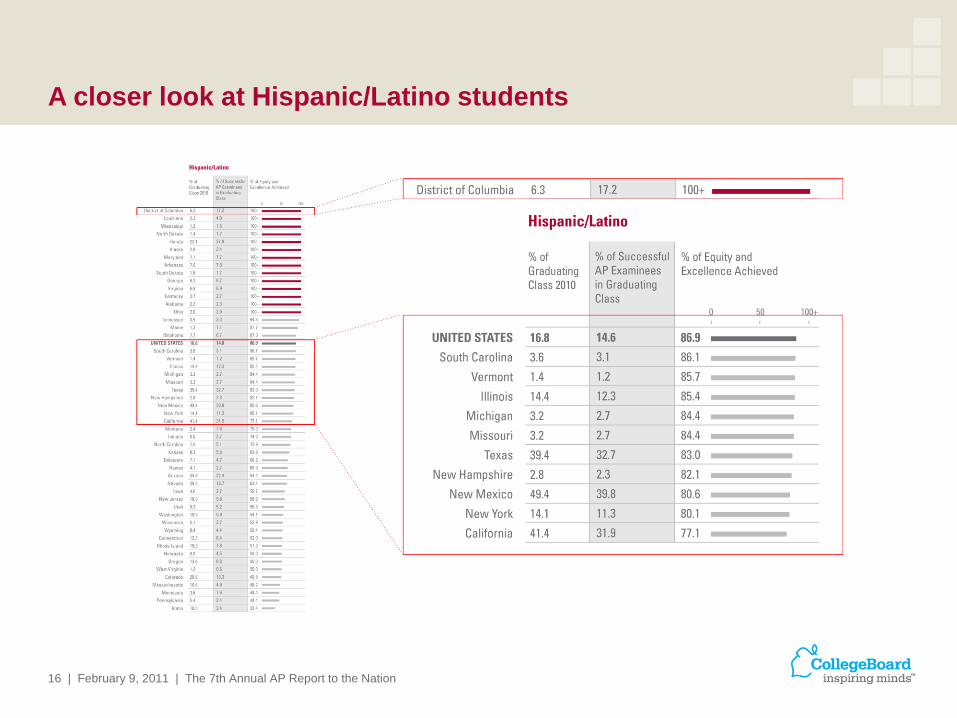
16 | February 9, 2011 | The 7th Annual AP Report to the Nation
A closer look at Hispanic/Latino students
17 | February 9, 2011 | The 7th Annual AP Report to the Nation
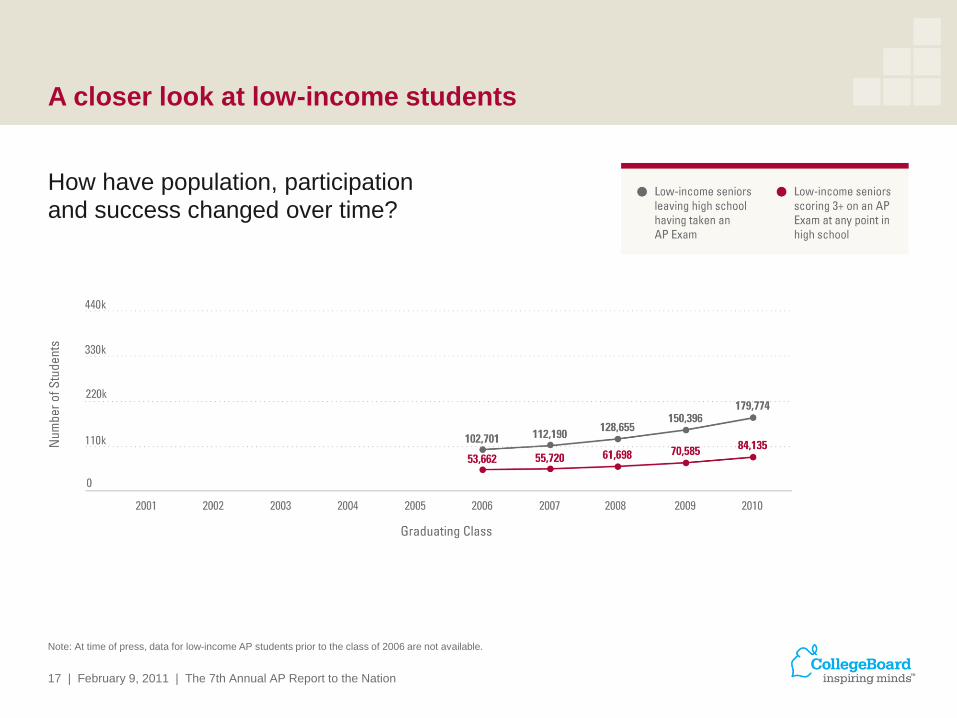
A closer look at low-income students
How have population, participation and success changed over time?
Note: At time of press, data for low-income AP students prior to the class of 2006 are not available.
18 | February 9, 2011 | The 7th Annual AP Report to the Nation
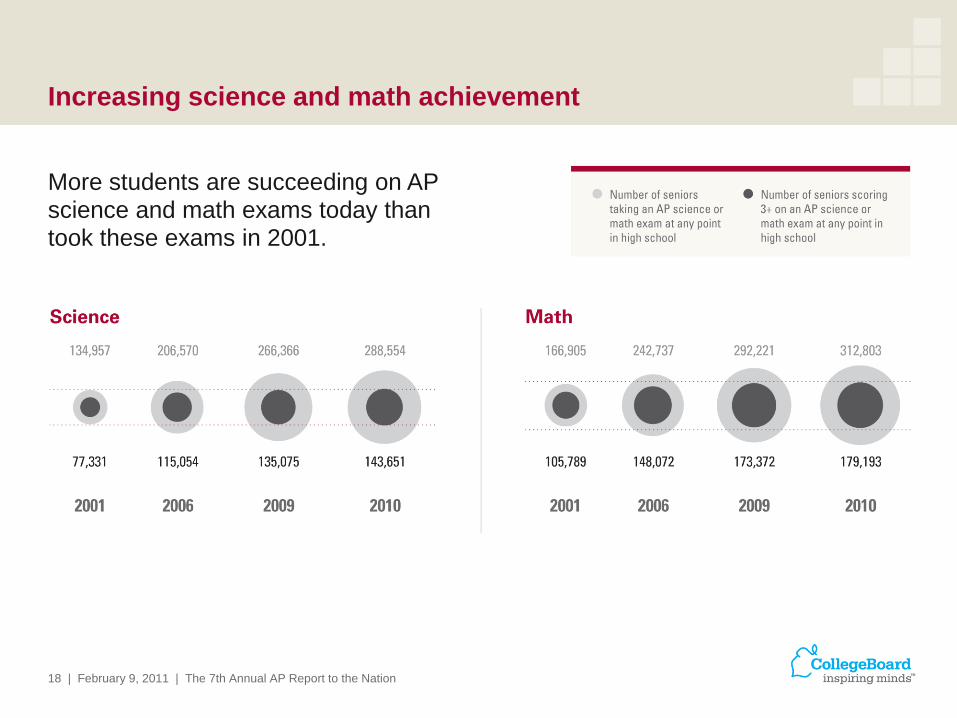
Increasing science and math achievement
More students are succeeding on AP science and math exams today than took these exams in 2001.
19 | February 9, 2011 | The 7th Annual AP Report to the Nation
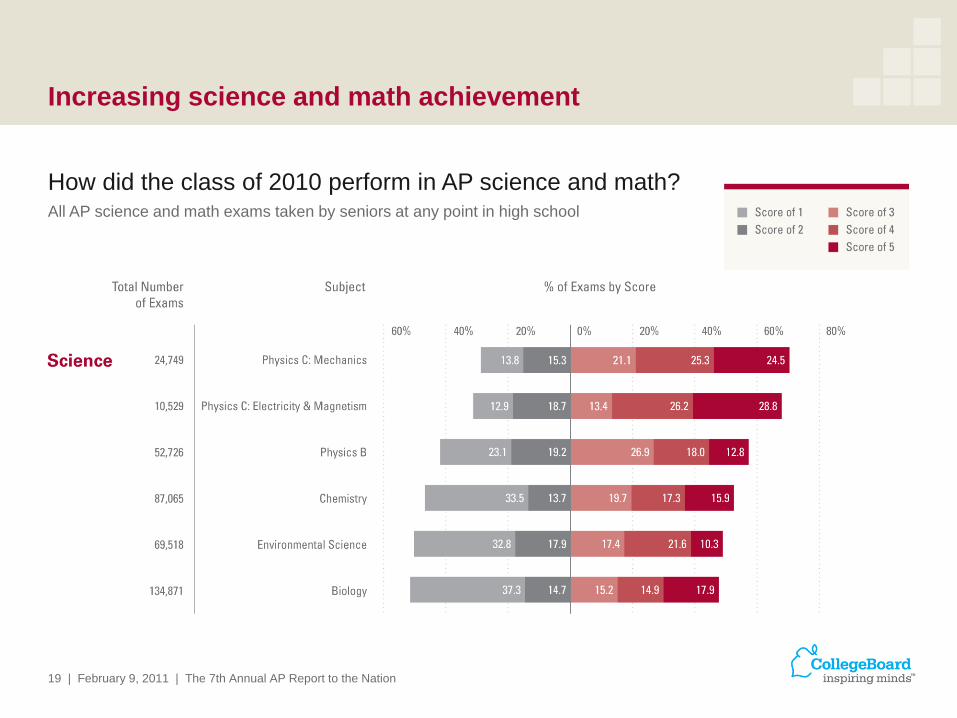
Increasing science and math achievement
How did the class of 2010 perform in AP science and math? All AP science and math exams taken by seniors at any point in high school

20 | February 9, 2011 | The 7th Annual AP Report to the Nation
Schools with the largest numbers of Black/African American
and Hispanic/Latino students experiencing success in AP
Exemplary Programs by State
California - Eagle Rock High School (Los Angeles)
Florida - Barbara Goleman Senior High School (Miami)
- Coral Reef Senior High School (Miami)
- Cypress Bay High School (Weston)
- Design and Architecture Senior High (Miami)
- Miami Killian Senior High School (Miami)
Georgia - Southwest DeKalb High School (Decatur)
Illinois - Homewood-Flossmoor Community High School
(Flossmoor)
Maryland - Eleanor Roosevelt High School (Greenbelt)
- Paint Branch High School (Burtonsville)
Texas - Michael E. DeBakey High School for Health
Professions (Houston)
- Science Academy of South Texas (Mercedes)
- United High School (Laredo)
- Valley View High School (Pharr)
21 | February 9, 2011 | The 7th Annual AP Report to the Nation
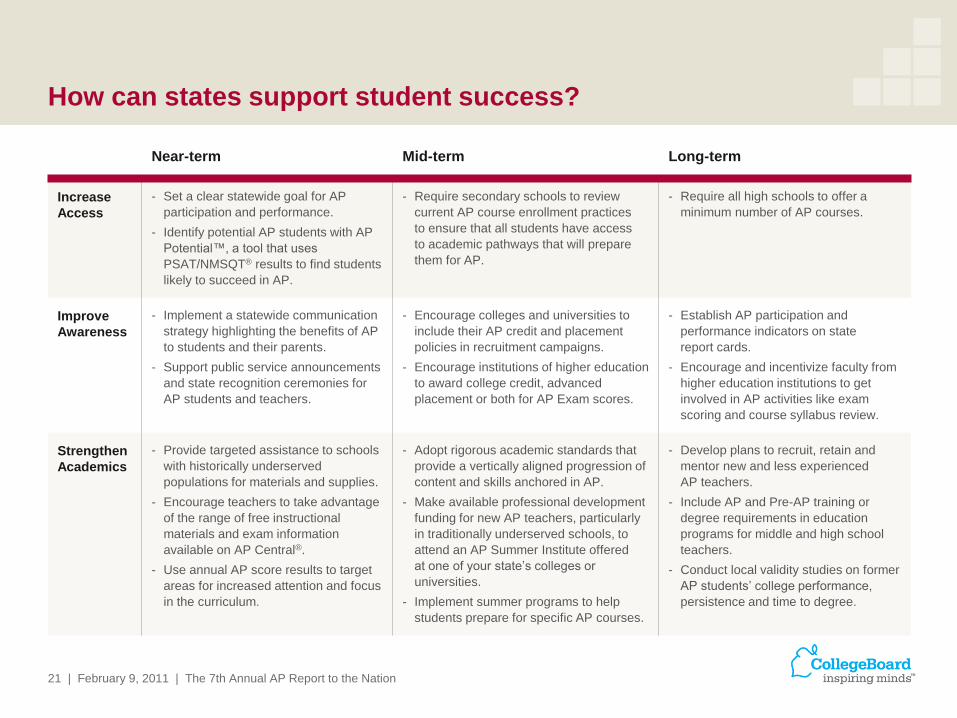
Near-term Mid-term Long-term
Increase
Access
- Set a clear statewide goal for AP
participation and performance.
- Identify potential AP students with AP
Potential™, a tool that uses
PSAT/NMSQT® results to find students
likely to succeed in AP.
- Require secondary schools to review
current AP course enrollment practices
to ensure that all students have access
to academic pathways that will prepare
them for AP.
- Require all high schools to offer a
minimum number of AP courses.
Improve
Awareness
- Implement a statewide communication
strategy highlighting the benefits of AP
to students and their parents.
- Support public service announcements
and state recognition ceremonies for
AP students and teachers.
- Encourage colleges and universities to
include their AP credit and placement
policies in recruitment campaigns.
- Encourage institutions of higher education
to award college credit, advanced
placement or both for AP Exam scores.
- Establish AP participation and
performance indicators on state
report cards.
- Encourage and incentivize faculty from
higher education institutions to get
involved in AP activities like exam
scoring and course syllabus review.
Strengthen
Academics
- Provide targeted assistance to schools
with historically underserved
populations for materials and supplies.
- Encourage teachers to take advantage
of the range of free instructional
materials and exam information
available on AP Central®.
- Use annual AP score results to target
areas for increased attention and focus
in the curriculum.
- Adopt rigorous academic standards that
provide a vertically aligned progression of
content and skills anchored in AP.
- Make available professional development
funding for new AP teachers, particularly
in traditionally underserved schools, to
attend an AP Summer Institute offered
at one of your state‟s colleges or
universities.
- Implement summer programs to help
students prepare for specific AP courses.
- Develop plans to recruit, retain and
mentor new and less experienced
AP teachers.
- Include AP and Pre-AP training or
degree requirements in education
programs for middle and high school
teachers.
- Conduct local validity studies on former
AP students‟ college performance,
persistence and time to degree.
How can states support student success?
22 | February 9, 2011 | The 7th Annual AP Report to the Nation
College Board Office of Communications
Tel: 212-713-8052
E-mail: [email protected]
For more information or follow-up questions