press release 1 t08 en
TRANSCRIPT
1May 6th, 2008
TIM Participações S.A.
1Q08’s Results

2
Highlights
Market Overview
Commercial Strategy
Financial Performances
1Q08 Main HighlightsResults Perspectives
ClientBase
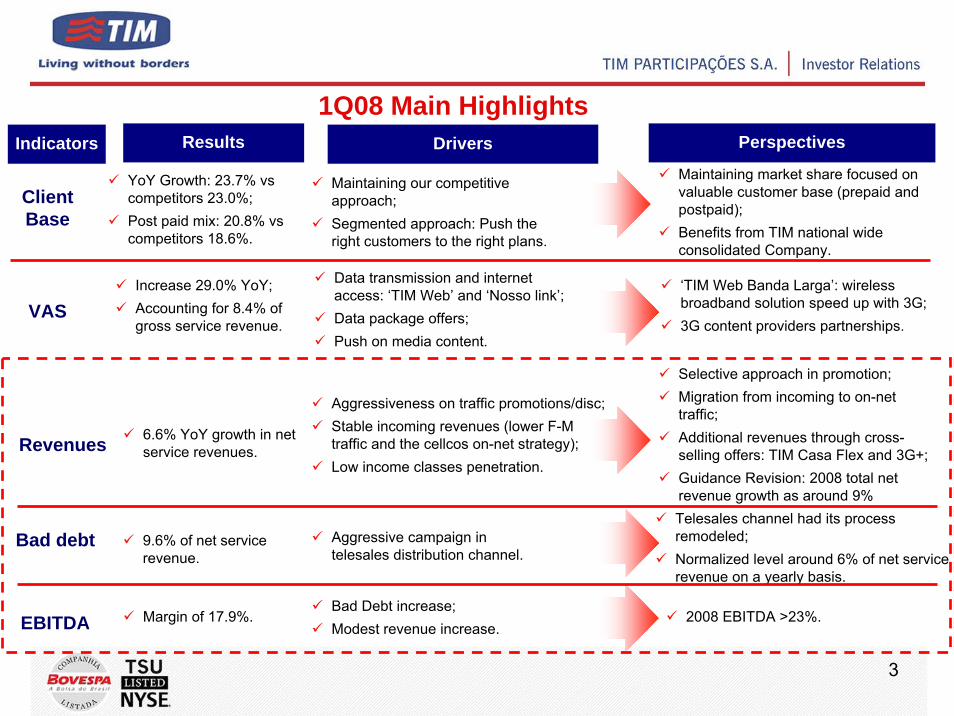
DriversIndicatorsMaintaining market share focused on valuable customer base (prepaid and postpaid);Benefits from TIM national wide consolidated Company.
YoY Growth: 23.7% vscompetitors 23.0%;Post paid mix: 20.8% vscompetitors 18.6%.
Maintaining our competitive approach;Segmented approach: Push the right customers to the right plans.
Revenues 6.6% YoY growth in net service revenues.
Selective approach in promotion;Migration from incoming to on-net traffic; Additional revenues through cross-selling offers: TIM Casa Flex and 3G+;Guidance Revision: 2008 total netrevenue growth as around 9%
Aggressiveness on traffic promotions/disc;Stable incoming revenues (lower F-M traffic and the cellcos on-net strategy); Low income classes penetration.
VASIncrease 29.0% YoY;Accounting for 8.4% of gross service revenue.
Data transmission and internet access: ‘TIM Web’ and ‘Nosso link’;Data package offers;Push on media content.
‘TIM Web Banda Larga’: wireless broadband solution speed up with 3G;3G content providers partnerships.
Bad debt 9.6% of net service revenue.
Aggressive campaign in telesales distribution channel.
Telesales channel had its process remodeled;Normalized level around 6% of net service revenue on a yearly basis.
EBITDA Margin of 17.9%. 2008 EBITDA >23%.Bad Debt increase;Modest revenue increase.
3

4
Highlights
Market Overview
Commercial Strategy
Financial Performances
1Q08 Brazilian market at a glance
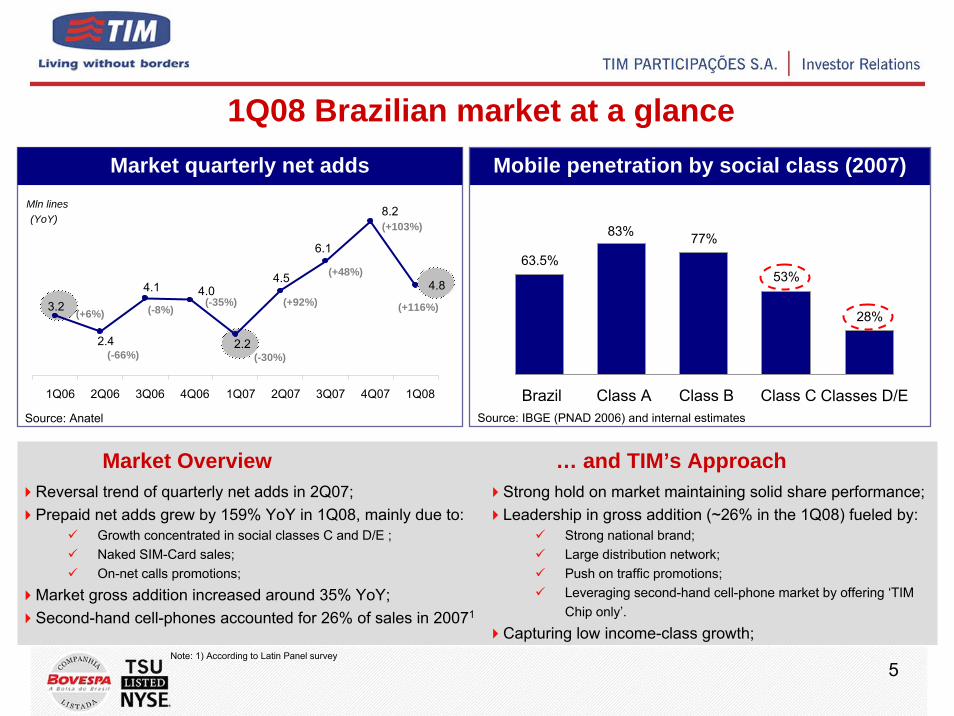
83%
63.5%77%
53%
28%
Brazil Class A Class B Class C Classes D/E
Market Overview … and TIM’s ApproachReversal trend of quarterly net adds in 2Q07;Prepaid net adds grew by 159% YoY in 1Q08, mainly due to:
Growth concentrated in social classes C and D/E ;Naked SIM-Card sales;On-net calls promotions;
Market gross addition increased around 35% YoY;Second-hand cell-phones accounted for 26% of sales in 20071
Strong hold on market maintaining solid share performance;Leadership in gross addition (~26% in the 1Q08) fueled by:
Strong national brand;Large distribution network;Push on traffic promotions;Leveraging second-hand cell-phone market by offering ‘TIM Chip only’.
Capturing low income-class growth; Note: 1) According to Latin Panel survey
(+6%)
(-66%)
(-8%)(-35%)
(-30%)
(+92%)
(+48%)
(+103%)
(+116%)
Mln lines(YoY)
Market quarterly net adds Mobile penetration by social class (2007)
4.8
3.2
2.4
4.1 4.0
2.2
4.5
8.2
6.1
1Q06 2Q06 3Q06 4Q06 1Q07 2Q07 3Q07 4Q07 1Q08
Source: IBGE (PNAD 2006) and internal estimatesSource: Anatel
5
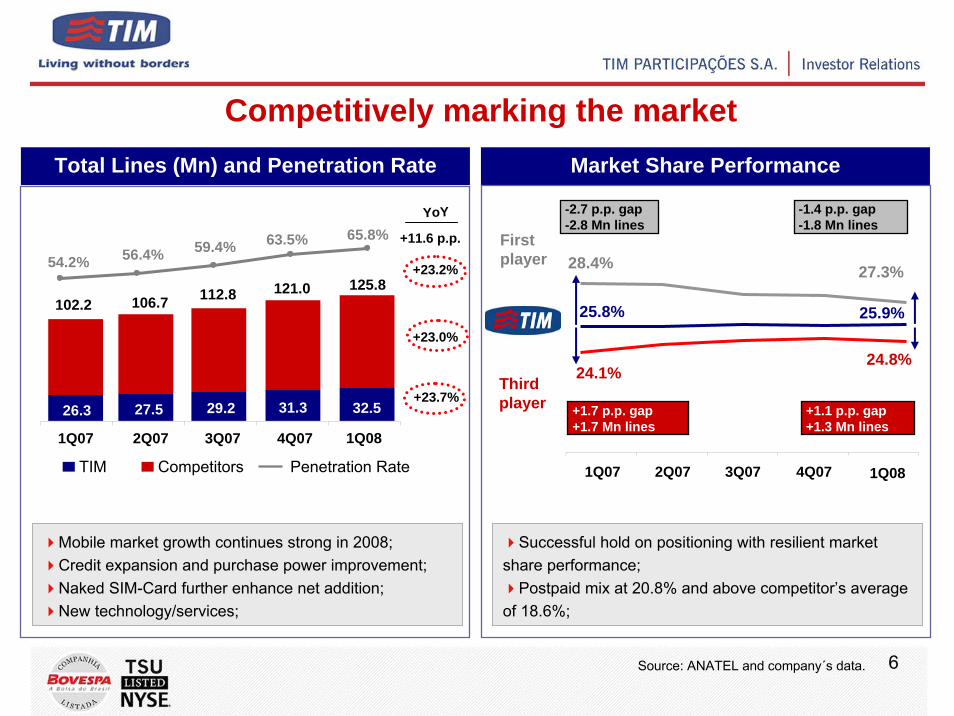
6Source: ANATEL and company´s data.
Competitively marking the marketTotal Lines (Mn) and Penetration Rate
TIM Penetration Rate
Mobile market growth continues strong in 2008;Credit expansion and purchase power improvement;Naked SIM-Card further enhance net addition;New technology/services;
YoY
+11.6 p.p.
+23.2%
+23.0%
Competitors
+23.7%
Market Share Performance
Firstplayer
Thirdplayer
-1.4 p.p. gap-1.8 Mn lines
-2.7 p.p. gap-2.8 Mn lines
Successful hold on positioning with resilient market share performance;
Postpaid mix at 20.8% and above competitor’s average of 18.6%;
26.3 27.5 29.2 31.3
102.2 106.7 112.8 121.0
54.2% 56.4% 59.4% 63.5% 65.8%
1Q07 2Q07 3Q07 4Q07
1Q07 2Q07 3Q07 4Q07
1Q08
125.8
32.5
1Q08
28.4% 27.3%
25.8%
24.1%24.8%
25.9%
+1.1 p.p. gap+1.3 Mn lines
+1.7 p.p. gap+1.7 Mn lines

7
Highlights
Market Overview
Commercial Strategy
Financial Performances
8
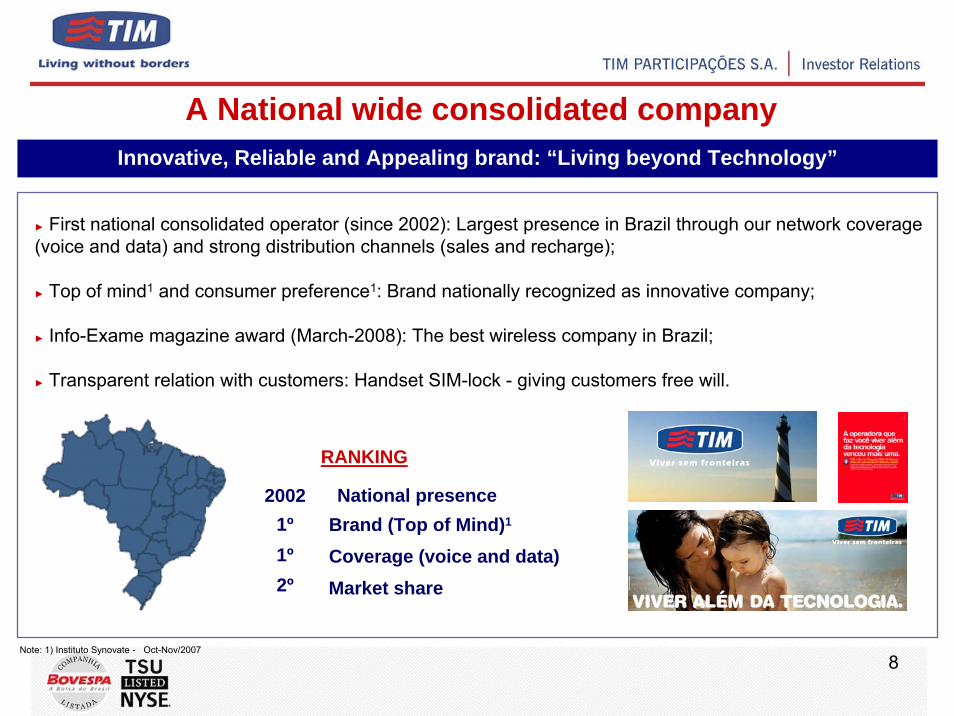
A National wide consolidated company
National presence
RANKING
2002
Note: 1) Instituto Synovate - Oct-Nov/2007
Innovative, Reliable and Appealing brand: “Living beyond Technology”
► First national consolidated operator (since 2002): Largest presence in Brazil through our network coverage (voice and data) and strong distribution channels (sales and recharge);
► Top of mind1 and consumer preference1: Brand nationally recognized as innovative company;
► Info-Exame magazine award (March-2008): The best wireless company in Brazil;
► Transparent relation with customers: Handset SIM-lock - giving customers free will.
Brand (Top of Mind)11º
2º Market share
1º Coverage (voice and data)
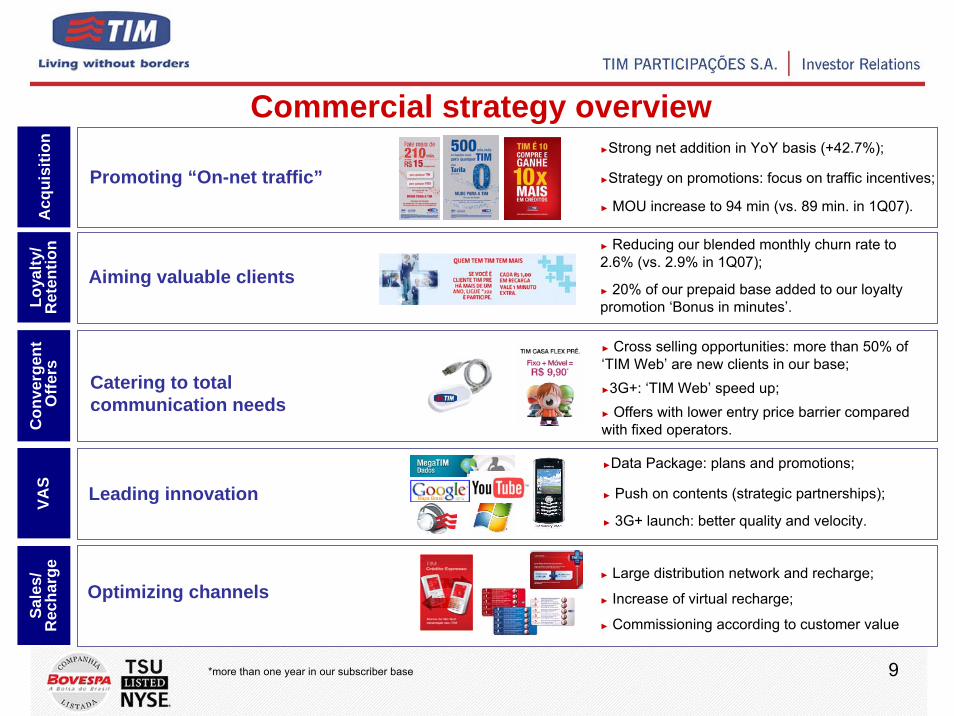
Promoting “On-net traffic”
Aiming valuable clients
Commercial strategy overview
Acq
uisi
tion
►Strong net addition in YoY basis (+42.7%);
►Strategy on promotions: focus on traffic incentives;
► MOU increase to 94 min (vs. 89 min. in 1Q07).
Loya
lty/
Ret
entio
n ► Reducing our blended monthly churn rate to 2.6% (vs. 2.9% in 1Q07);
► 20% of our prepaid base added to our loyaltypromotion ‘Bonus in minutes’.
*more than one year in our subscriber base
Catering to total communication needs
Con
verg
ent
Offe
rs
► Cross selling opportunities: more than 50% of ‘TIM Web’ are new clients in our base;►3G+: ‘TIM Web’ speed up; ► Offers with lower entry price barrier compared with fixed operators.
Leading innovationVAS
►Data Package: plans and promotions;
► Push on contents (strategic partnerships);
► 3G+ launch: better quality and velocity.
Optimizing channels
Sale
s/R
echa
rge
► Large distribution network and recharge;
► Increase of virtual recharge;
► Commissioning according to customer value
9
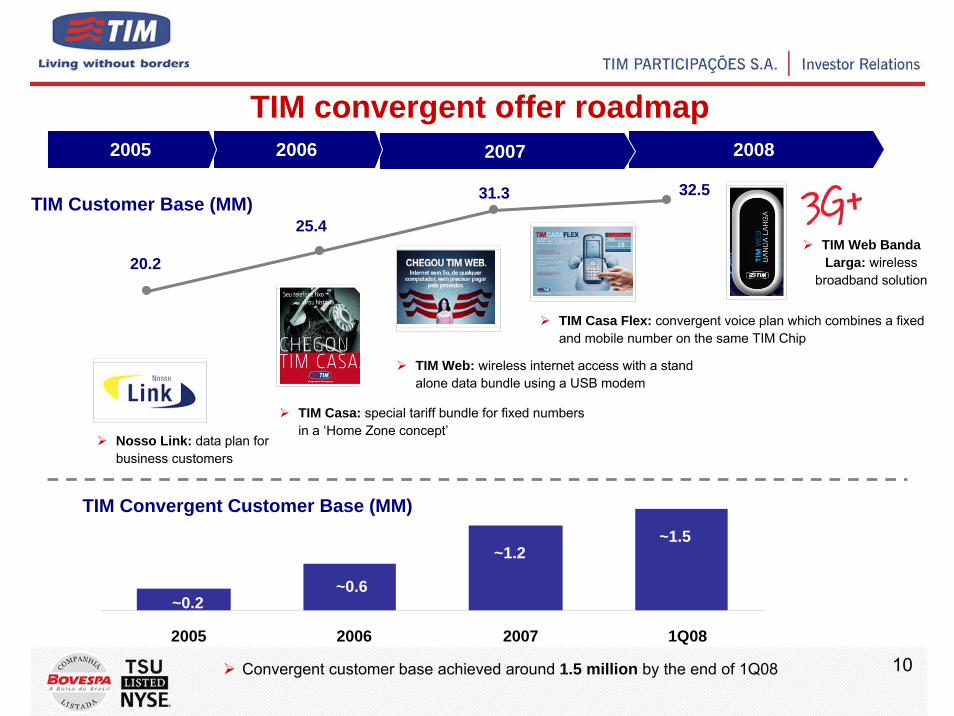
200820072006
TIM Web: wireless internet access with a stand alone data bundle using a USB modem
TIM convergent offer roadmap
10
2005
Convergent customer base achieved around 1.5 million by the end of 1Q08
TIM Casa Flex: convergent voice plan which combines a fixed and mobile number on the same TIM Chip
TIM Web Banda Larga: wireless
broadband solution
TIM Casa: special tariff bundle for fixed numbers in a ‘Home Zone concept’
Nosso Link: data plan for business customers
~0.2
~1.5~1.2
~0.6
2005 2006 2007 1Q08
20.2
25.4
31.3 32.5TIM Customer Base (MM)
TIM Convergent Customer Base (MM)
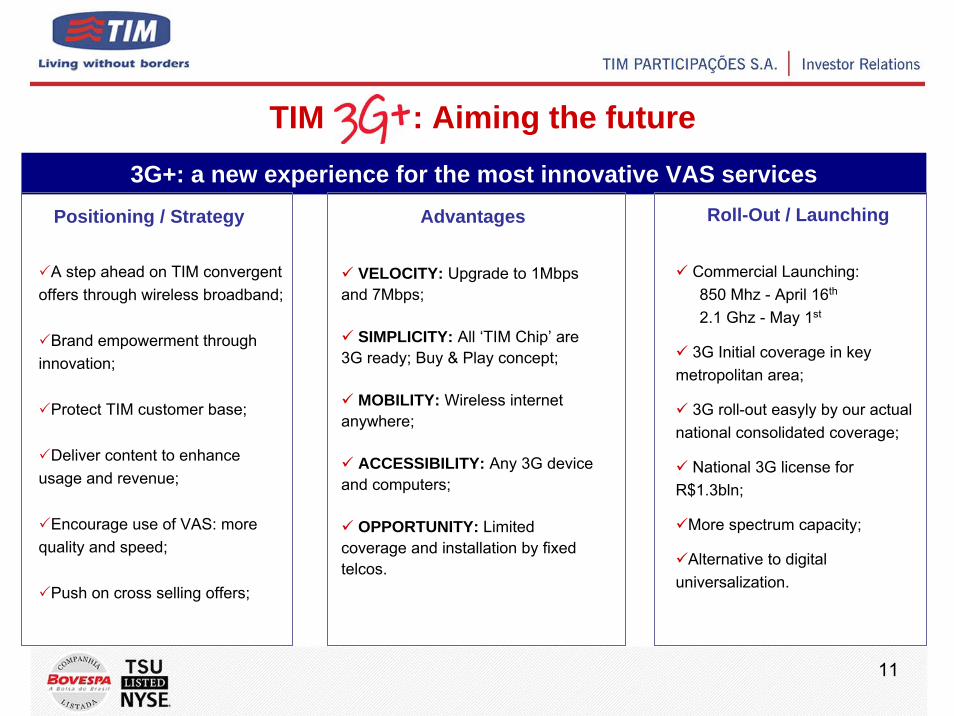
TIM : Aiming the future3G+: a new experience for the most innovative VAS services
A step ahead on TIM convergent offers through wireless broadband;
Brand empowerment through innovation;
Protect TIM customer base;
Deliver content to enhance usage and revenue;
Encourage use of VAS: more quality and speed;
Push on cross selling offers;
Positioning / Strategy Advantages
Commercial Launching:850 Mhz - April 16th
2.1 Ghz - May 1st
3G Initial coverage in key metropolitan area;
3G roll-out easyly by our actualnational consolidated coverage;
National 3G license for R$1.3bln;
More spectrum capacity;
Alternative to digital universalization.
Roll-Out / Launching
VELOCITY: Upgrade to 1Mbps and 7Mbps;
SIMPLICITY: All ‘TIM Chip’ are 3G ready; Buy & Play concept;
MOBILITY: Wireless internet anywhere;
ACCESSIBILITY: Any 3G device and computers;
OPPORTUNITY: Limited coverage and installation by fixed telcos.
11
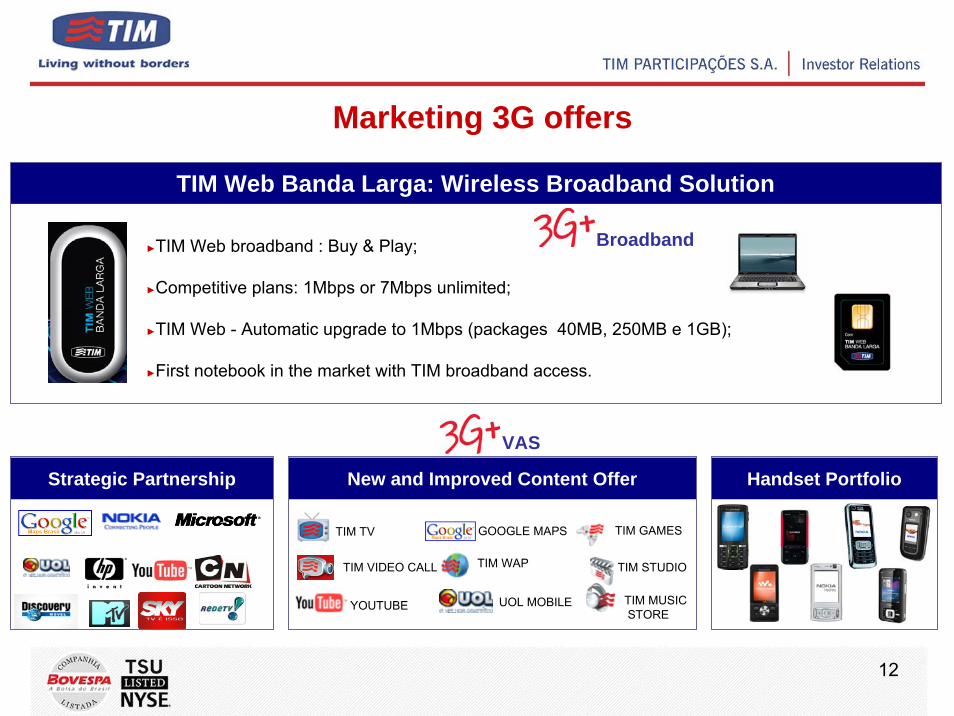
Marketing 3G offers
►TIM Web broadband : Buy & Play;
►Competitive plans: 1Mbps or 7Mbps unlimited;
►TIM Web - Automatic upgrade to 1Mbps (packages 40MB, 250MB e 1GB);
►First notebook in the market with TIM broadband access.
TIM Web Banda Larga: Wireless Broadband Solution
Strategic Partnership
Broadband
TIM TV
TIM MUSICSTORE
TIM WAP TIM STUDIO
TIM GAMES
TIM VIDEO CALL
YOUTUBE
GOOGLE MAPS
UOL MOBILE
New and Improved Content Offer Handset Portfolio
VAS
12

13
Highlights
Market Overview
Commercial Strategy
Financial Performances
14
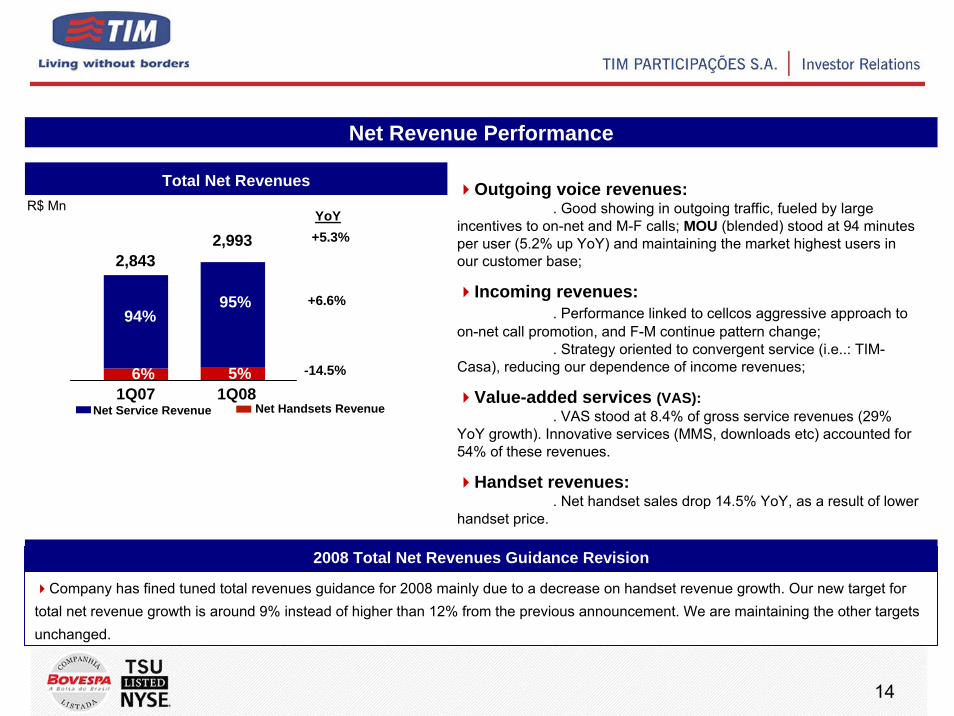
Net Revenue Performance
Net Service Revenue Net Handsets Revenue
94%
6%
95%
5%1Q07 1Q08
R$ Mn
2,9932,843
YoY+5.3%
+6.6%
-14.5%
Total Net Revenues Outgoing voice revenues: . Good showing in outgoing traffic, fueled by large
incentives to on-net and M-F calls; MOU (blended) stood at 94 minutes per user (5.2% up YoY) and maintaining the market highest users in our customer base;
Incoming revenues: . Performance linked to cellcos aggressive approach to
on-net call promotion, and F-M continue pattern change;. Strategy oriented to convergent service (i.e..: TIM-
Casa), reducing our dependence of income revenues;
Value-added services (VAS): . VAS stood at 8.4% of gross service revenues (29%
YoY growth). Innovative services (MMS, downloads etc) accounted for54% of these revenues.
Handset revenues: . Net handset sales drop 14.5% YoY, as a result of lower
handset price.
Company has fined tuned total revenues guidance for 2008 mainly due to a decrease on handset revenue growth. Our new target for total net revenue growth is around 9% instead of higher than 12% from the previous announcement. We are maintaining the other targets unchanged.
2008 Total Net Revenues Guidance Revision
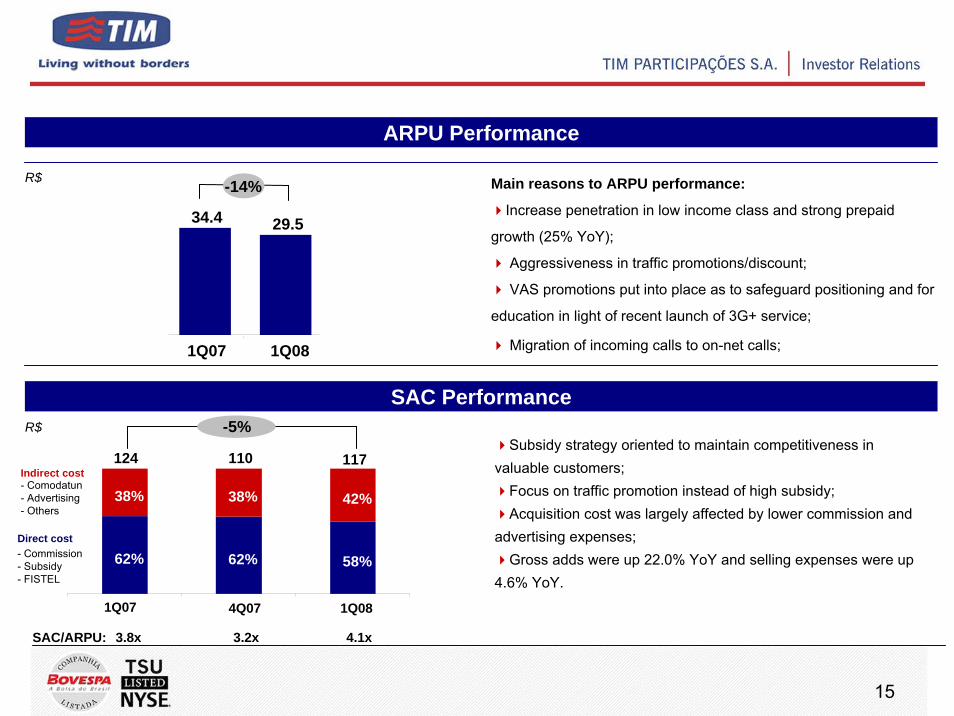
ARPU Performance
R$ Main reasons to ARPU performance:
Increase penetration in low income class and strong prepaid
growth (25% YoY);
Aggressiveness in traffic promotions/discount;
VAS promotions put into place as to safeguard positioning and for
education in light of recent launch of 3G+ service;
Migration of incoming calls to on-net calls;
-14%
34.4 29.5
1Q07 1Q08
Subsidy strategy oriented to maintain competitiveness in valuable customers;
Focus on traffic promotion instead of high subsidy;Acquisition cost was largely affected by lower commission and
advertising expenses;Gross adds were up 22.0% YoY and selling expenses were up
4.6% YoY.
SAC Performance
SAC/ARPU: 3.8x 3.2x 4.1x
4Q07 1Q08
-5%
62% 62% 58%
38% 38% 42%
1Q07
124 110 117
R$
Indirect cost
- Commission- Subsidy- FISTEL
Direct cost
- Comodatun- Advertising- Others
15
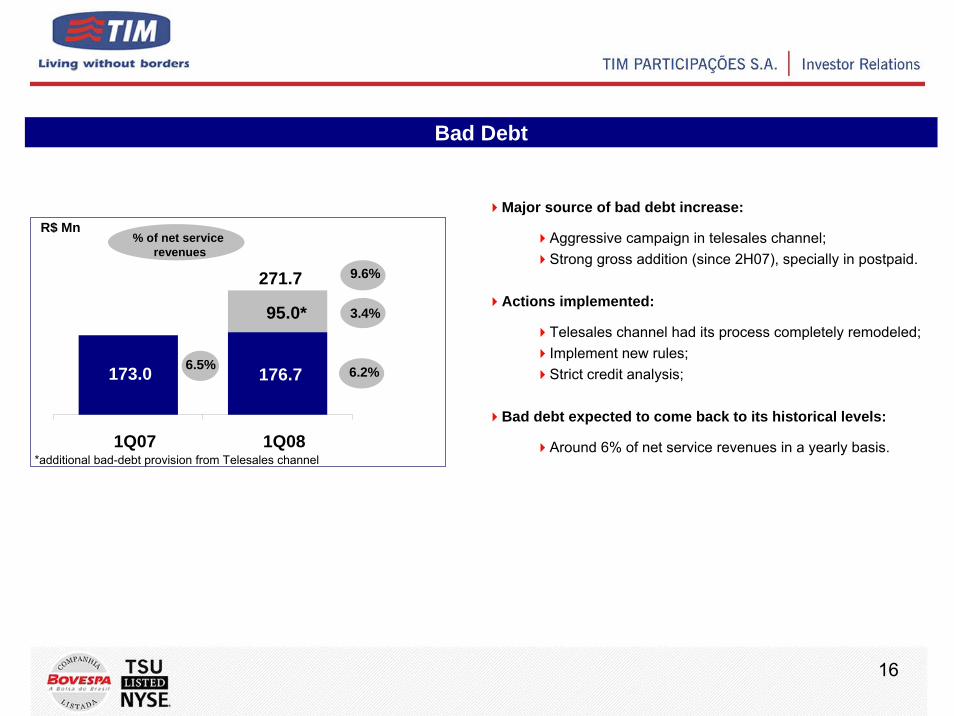
176.7
95.0*
173.0
271.7
1Q07 1Q08
R$ Mn
16
Major source of bad debt increase:
Aggressive campaign in telesales channel;Strong gross addition (since 2H07), specially in postpaid.
Actions implemented:
Telesales channel had its process completely remodeled;Implement new rules;Strict credit analysis;
Bad debt expected to come back to its historical levels:
Around 6% of net service revenues in a yearly basis.
Bad Debt
*additional bad-debt provision from Telesales channel
6.2%
3.4%
9.6%
6.5%
% of net service revenues
-14.5%
17
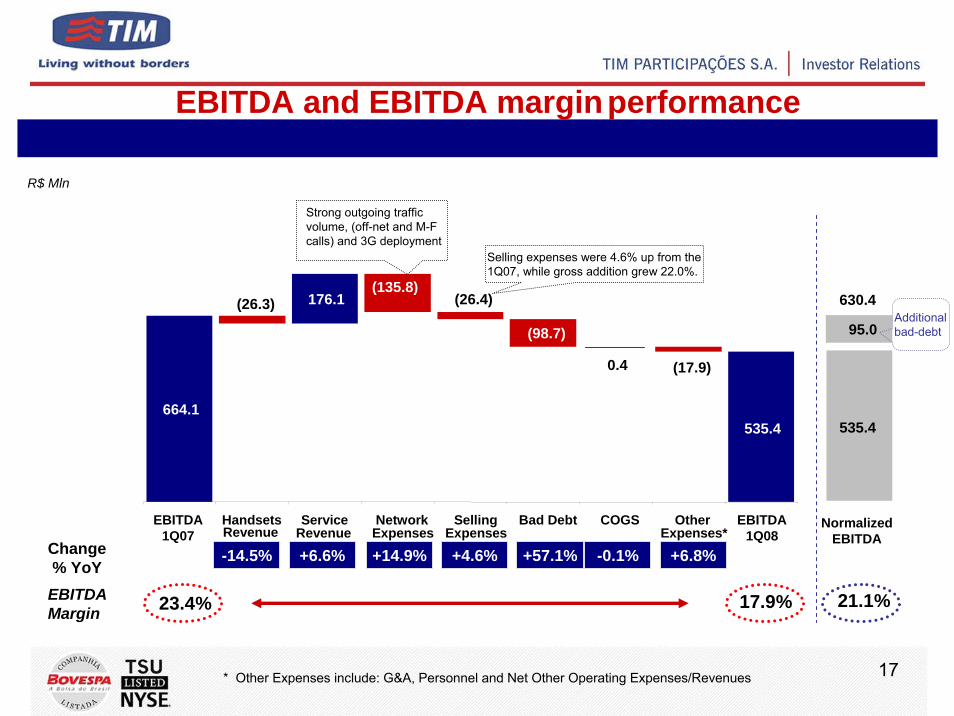
EBITDA and EBITDA marginperformance
R$ Mln
Change% YoY
17.9%23.4%
* Other Expenses include: G&A, Personnel and Net Other Operating Expenses/Revenues
+6.6% +14.9% +4.6% +57.1% -0.1% +6.8%
664.1
(26.3) 176.1(135.8)
(26.4)
(98.7)
0.4 (17.9)
535.4
EBITDA1Q07
HandsetsRevenue
ServiceRevenue
NetworkExpenses
SellingExpenses
Bad Debt COGS OtherExpenses*
EBITDA Margin
EBITDA1Q08
630.4
NormalizedEBITDA
21.1%
535.4
95.0Additional bad-debt
Strong outgoing traffic volume, (off-net and M-F calls) and 3G deployment
Selling expenses were 4.6% up from the 1Q07, while gross addition grew 22.0%.
18
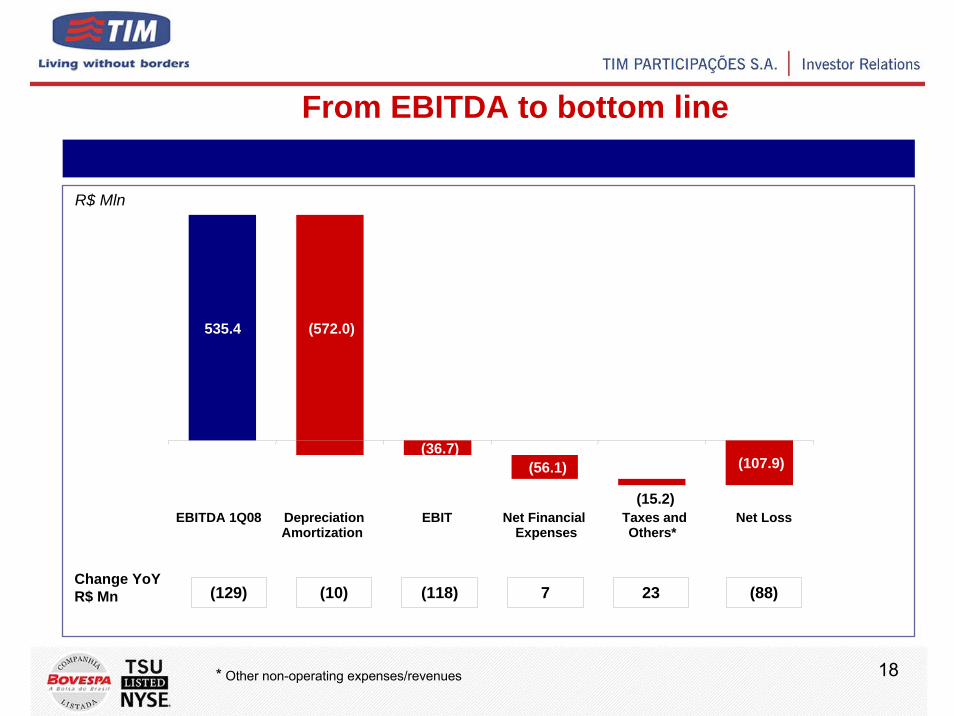
From EBITDA to bottom line
* Other non-operating expenses/revenues
R$ Mln
(129) (10) (118) 7 23 (88)Change YoYR$ Mn
535.4 (572.0)
(36.7)(56.1) (107.9)
(15.2)EBITDA 1Q08 Depreciation
AmortizationEBIT Net Financial
ExpensesTaxes andOthers*
Net Loss
19
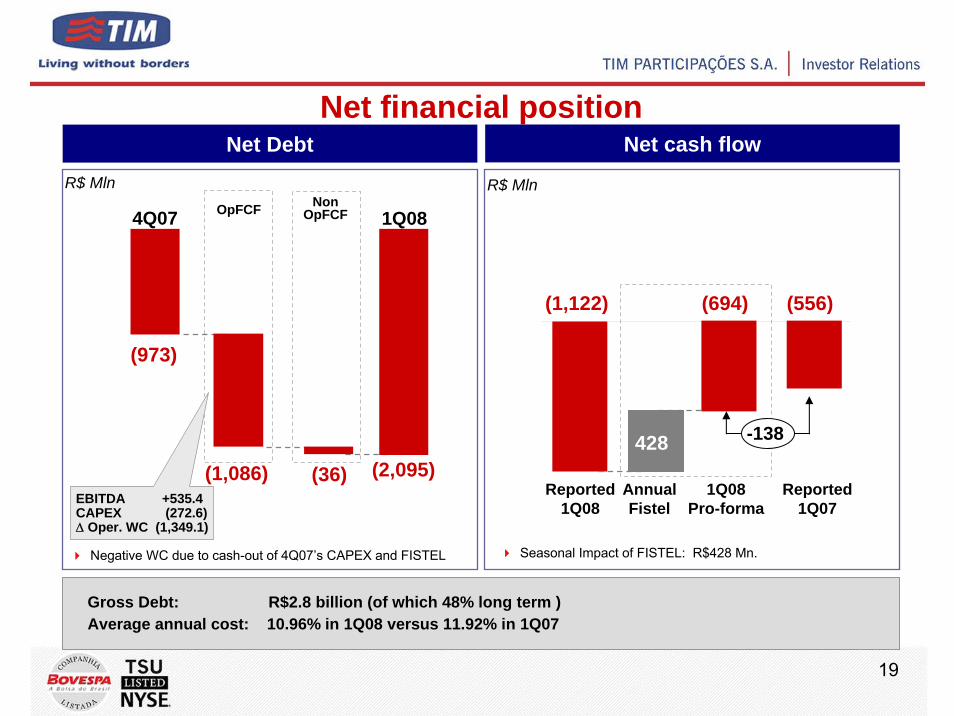
Net financial positionNet cash flow
Gross Debt: R$2.8 billion (of which 48% long term )Average annual cost: 10.96% in 1Q08 versus 11.92% in 1Q07
OpFCF4Q07
(2,095)(36)
R$ MlnNon
OpFCF 1Q08
(973)
(1,086)EBITDA +535.4CAPEX (272.6)Δ Oper. WC (1,349.1)
Net Debt
R$ Mln
Reported1Q08
Seasonal Impact of FISTEL: R$428 Mn.
(1,122)
428
1Q08Pro-forma
(556)
Annual Fistel
(694)
Reported1Q07
-138
Negative WC due to cash-out of 4Q07’s CAPEX and FISTEL
20
Statements in this presentation, as well as oral statements made by the management of TIM Participações S.A. (the “Company”, or “TIM”), that are not historical fact constitute “forward looking statements” that involve factors that could cause the actual results of theCompany to differ materially from historical results or from any results expressed or implied by such forward looking statements. The Company cautions users of this presentation not to place undue reliance on forward looking statements, which may be based on assumptions and anticipated events that do not materialize.
“Safe Harbor” Statements
Investor RelationsAvenida das Américas, 3434 - Bloco 01
6° andar – Barra da Tijuca
22640-102 Rio de Janeiro, RJ
Phone: +55 21 4009-3742 / 4009-3751 / 4009-3446
Fax: + 55 21 4009-3990
Visit our Website:
http://www.timpartri.com.br