prestressed vs. steel beams: expected service life · containing steel and prestressed beam...
TRANSCRIPT
Prestressed vs. Steel Beams: Expected Service Life
Prepared for
Michigan Department of Transportation Bridge Operations Unit
by
Brandon Boatman
Michigan Department of Transportation Bridge Inspector Co-op
Michigan State University
Undergraduate Student
State of Michigan
Department of Transportation Construction & Technology Division
Lansing, MI 48090
December 2, 2010
Introduction 1.1 History Beams designed for a bridge superstructure are typically constructed with either steel or concrete. Concrete beams are typically prestressed, meaning that the steel rebar within the concrete is put into tension before the concrete is poured into the fixture. This strengthens the concrete’s ability to resist tension through the rebar. Prestressed concrete is typically known to be more cost effective and has a higher speed of erection as compared to steel beams. Also, concrete doesn’t need a paint system for protection, reducing maintenance costs. Steel beams also have advantages over concrete, including less susceptibility to freeze thaw conditions. Steel performs much better than concrete in tension and there is also much less variability in the failure properties of steel. Currently service lives are unknown for either steel or prestressed concrete beams and will be evaluated further within this study using transition probabilities and deterioration curves. 1.2 Objectives The objectives of this study are as follows:
• Estimate service life of steel beams.
• Estimate service life of prestressed beams.
• Estimate service life of prestressed box beams.
• Estimate service life of prestressed I-beams.
The ultimate objective of this study is to accurately predict and compare the service life of steel and prestressed beams separately. Expected service life is the time until “poor condition”. Poor condition is defined as a superstructure rating of 4 or below on the Bridge Safety Inspection Report (BSIR), and indicates the need for rehabilitation. If a known approximate service life was available for different superstructures then future rehabilitations and preventive maintenance can be planned and budgeted accordingly. 1.3 Markov Model Markov models use transition matrices that describe the probability that a bridge element in a known condition state at a known time will change to some other condition state in the next time period. This process assumes that the probability of changing from one state to another is a function only of the condition state and time period in which the superstructure is currently located. Therefore, the past performance of a superstructure has no impact on the predicted rate of change in future performance [1]. This report reviews Markov transition probabilities for superstructure condition ratings for bridges
1
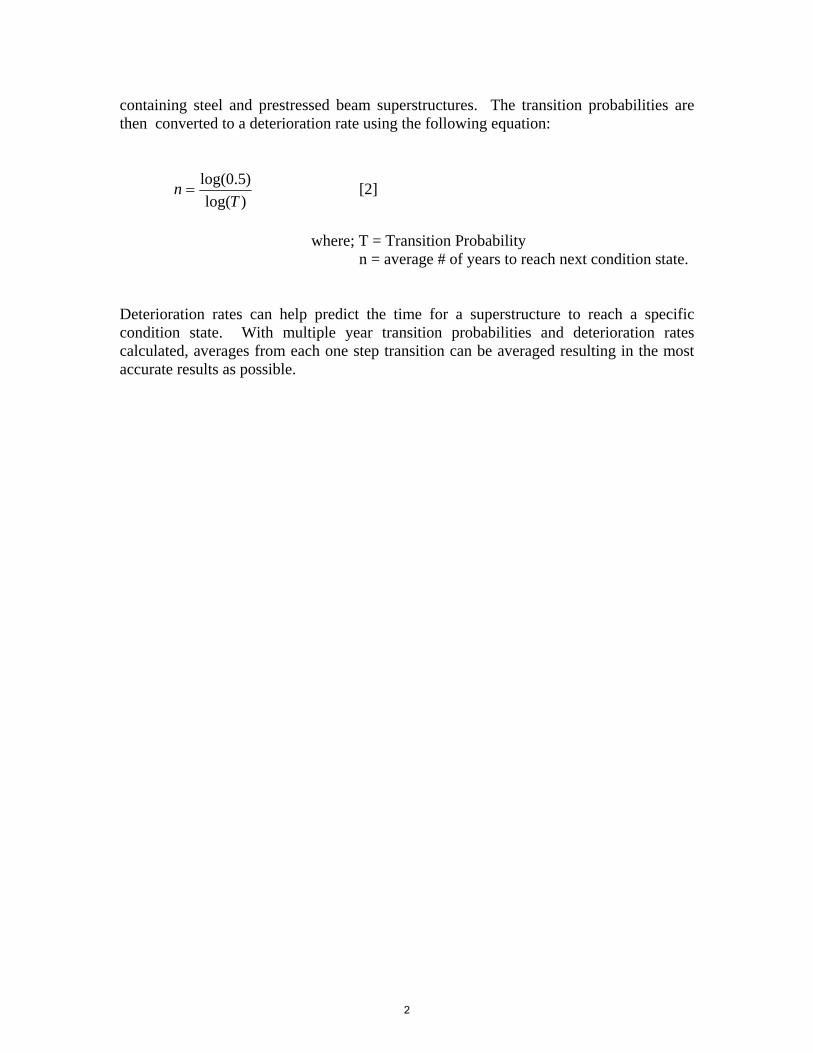
containing steel and prestressed beam superstructures. The transition probabilities are then converted to a deterioration rate using the following equation:
)log()5.0log(
Tn = [2]
where; T = Transition Probability
n = average # of years to reach next condition state. Deterioration rates can help predict the time for a superstructure to reach a specific condition state. With multiple year transition probabilities and deterioration rates calculated, averages from each one step transition can be averaged resulting in the most accurate results as possible.
2

Results 2.1 Data Set Data was pulled containing the following information: Bridge ID, NBI superstructure rating, and bridge type. Bridge type notes the type of superstructure for the given bridge. Steel, prestressed, box beams, and I-beams are all noted under bridge type allowing for uncomplicated data separation. The bridge types were then separated and resulted in the following:
• Steel Beams: 2,647 bridges. • Prestressed Beams: 1,198 bridges • Prestressed Box Beams: 390 bridges • Prestressed I-Beams: 800 bridges
2.2 Transition Probabilities and Deterioration Curves Transition probabilities were calculated using NBI superstructure ratings from 2004 to 2010. These ratings were analyzed from year to year intervals, resulting in a transition probability for each year. For instance; in 2004, 941 bridges containing a steel beam superstructure held a rating of a 7, in 2005 856 remained a 7, 67 fell to a 6, and 17 lowered to a 5. The transition probabilities result a 91% probability that a steel beam superstructure will remain at a 7, 7% will lower to a 6, and 2% will lower to a 5. This was done for each superstructure rating, creating a transition probability matrix. This process was then repeated for 2005-2006, 06-07, 07-08, 08-09, and 09-10 resulting in six different probability matrices (Appendix Tables 5-1 thru 5-24). The probabilities were then averaged based on the six different matrices, resulting in an average transition probability matrix. Deterioration rates were calculated using the equation previously mentioned (Section 1.3). The deterioration rates were then plotted along the x-axis with deck surface ratings assigned to the y-axis (Appendix Fig 5-1 thru 5-24). 2.2.1 Steel Beams Table 2-1 displays the average transition probability from 2004-2010 for bridges containing a steel beam superstructure. The numbers located along the left side and highlighted in bright green represent the previous year deck surface rating. The numbers located along the top and highlighted in bright green represent the following year deck surface ratings and highlighted in blue are the average transition probabilities. For instance; there is a 69% chance that a 9 will remain a 9 the following year, 22% chance to decrease to an 8, and a 8% chance to decrease to a 7. Deterioration rates are in bold and highlighted light green.
3

Table 2-1: Transition Probability Matrix for Steel Beams
Figure 2-1 displays the NBI superstructure ratings plotted against deterioration rates calculated in Table 2-1. According to Figure 2-1; on average a steel beam will take 32 years to reach a rating of 5 and 47 years to attain a rating of 4, a 4 being equivalent to poor condition.
Deterioration Curve Steel Beams
28
1932
4763
0123456789
0 10 20 30 40 50 60 70
Years
NB
I Rat
ing
Figure 2-1: Steel Beam Deterioration Curve
Poor Condition
4

2.2.2 Prestressed Beams
Table 2-2 displays the average transition probability from 2004-2010 for prestressed beam superstructures. Again, transition probabilities are highlighted in blue and the deterioration rates are in bold and highlighted light green.
Table 2-2: Transition Probability Matrix for Prestressed Beams
Figure 2-2 displays the NBI superstructure ratings plotted against deterioration rates calculated in Table 2-2. According to Figure 2-2; on average a prestressed beam will take 32 years to attain a rating of a 5 and 45 years to reach a rating of 4, equivalent to poor condition.
Deterioration Curve Prestressed Beams
210
2132
4552
0123456789
0 10 20 30 40 50 60 70
Years
Supe
rstr
uctu
re R
atin
g
Figure 2-2: Prestressed Beam Deterioration Curve
Poor Condition
5
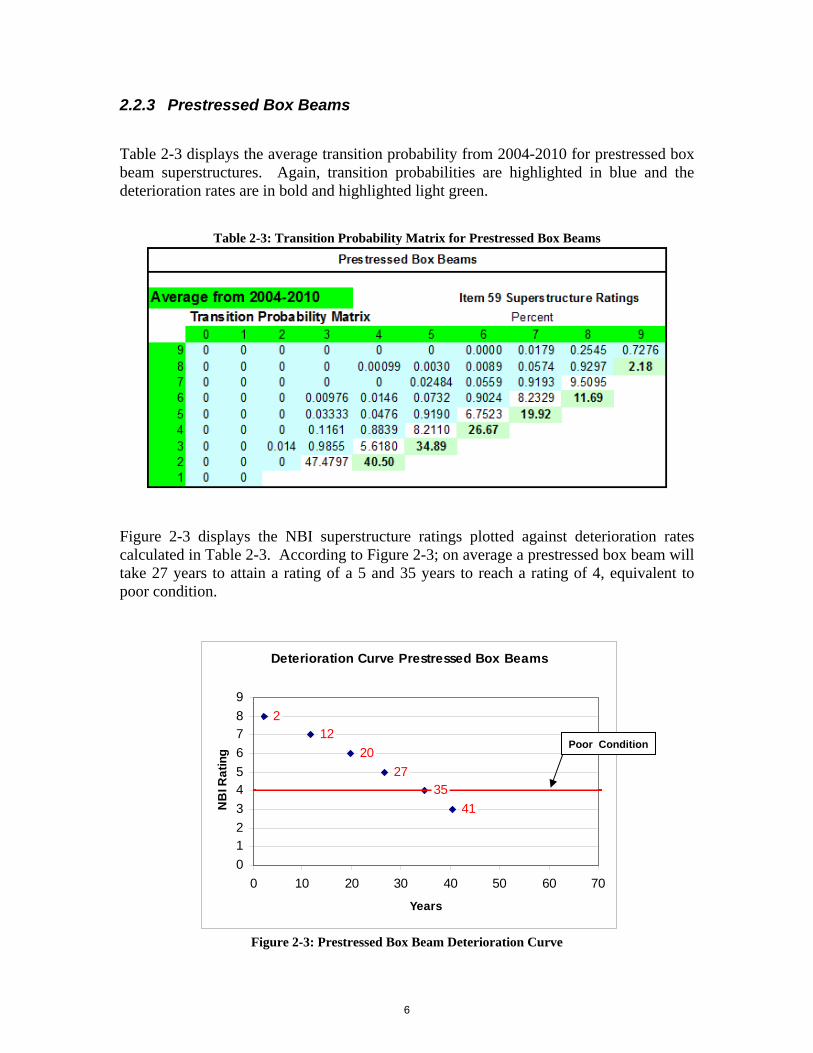
2.2.3 Prestressed Box Beams
Table 2-3 displays the average transition probability from 2004-2010 for prestressed box beam superstructures. Again, transition probabilities are highlighted in blue and the deterioration rates are in bold and highlighted light green.
Table 2-3: Transition Probability Matrix for Prestressed Box Beams
Figure 2-3 displays the NBI superstructure ratings plotted against deterioration rates calculated in Table 2-3. According to Figure 2-3; on average a prestressed box beam will take 27 years to attain a rating of a 5 and 35 years to reach a rating of 4, equivalent to poor condition.
Deterioration Curve Prestressed Box Beams
212
2027
3541
0123456789
0 10 20 30 40 50 60 70
Years
NB
I Rat
ing
Figure 2-3: Prestressed Box Beam Deterioration Curve
Poor Condition
6

2.2.4 Prestressed I-Beams Table 2-4 displays the average transition probability from 2004-2010 for prestressed I-beam superstructures. Again, transition probabilities are highlighted in blue and the deterioration rates are in bold and highlighted light green.
Table 2-4: Transition Probability Matrix for Prestressed I-Beams
Figure 2-4 displays the NBI superstructure ratings plotted against deterioration rates calculated in Table 2-4. According to Figure 2-4; on average a prestressed I-beam will take 34 years to attain a rating of a 5 and 52 years to reach a rating of 4, equivalent to poor condition.
Deterioration Curve Prestressed I-Beams
29
2034
5260
0123456789
0 10 20 30 40 50 60 70
Years
NB
I Rat
ing
Figure 2-4: Prestressed I-Beam Deterioration Curve
Poor Condition
7

2.3 Comparing Deterioration Curves
Prestressed Beam vs. Steel Beam
0
1
2
3
4
5
6
7
8
9
0 10 20 30 40 50 60 70
Years
Supe
rstr
uctu
re R
atin
g
SteelPrestressed
Figure 2-5: Prestressed Beams vs. Steel Beams Deterioration Curves
Figure 2-5 displays the deterioration curves of both prestressed beams and steel beams within the same plot. Notice how similar the deterioration curves are until poor condition is reached.
8

Box Beam vs. I-Beam
0
1
2
3
4
5
6
7
8
9
0 10 20 30 40 50 60 70
Years
Supe
rstr
uctu
re R
atin
g
BoxI Beam
Figure 2-6: Box Beams vs. I-Beams Deterioration Curves
Figure 2-6 displays the deterioration curves of both prestressed box beams and prestressed I-beams within the same plot.
9
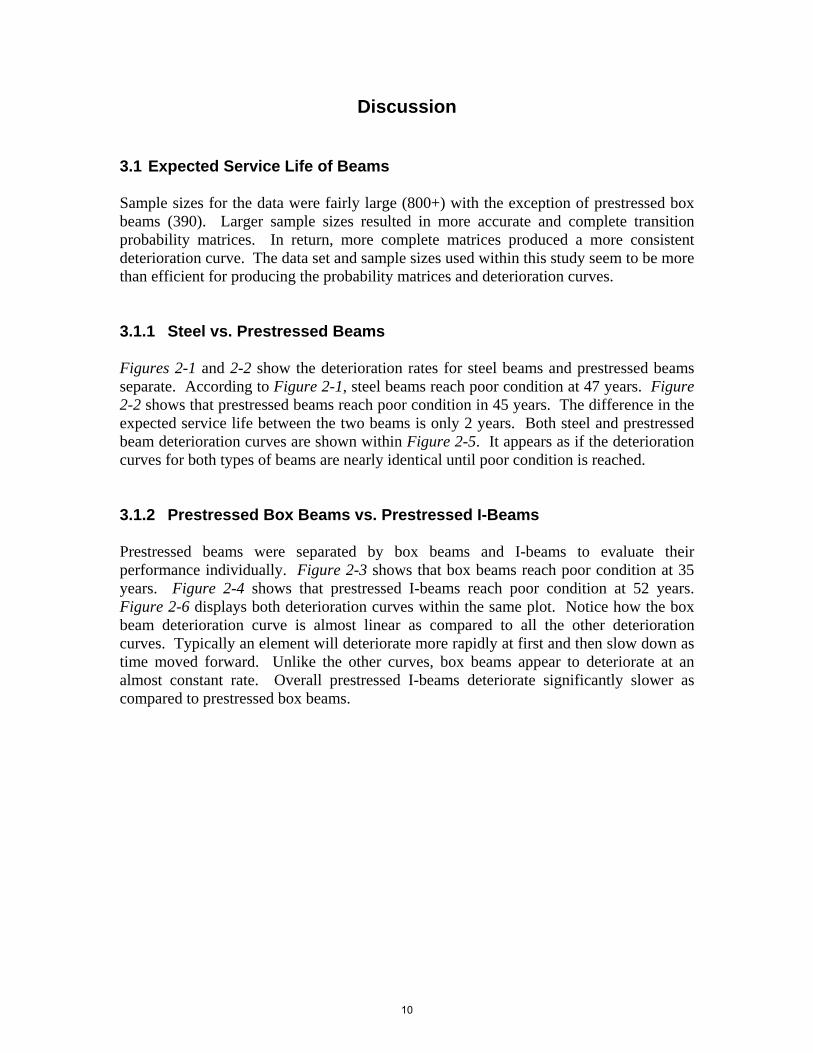
Discussion
3.1 Expected Service Life of Beams Sample sizes for the data were fairly large (800+) with the exception of prestressed box beams (390). Larger sample sizes resulted in more accurate and complete transition probability matrices. In return, more complete matrices produced a more consistent deterioration curve. The data set and sample sizes used within this study seem to be more than efficient for producing the probability matrices and deterioration curves. 3.1.1 Steel vs. Prestressed Beams Figures 2-1 and 2-2 show the deterioration rates for steel beams and prestressed beams separate. According to Figure 2-1, steel beams reach poor condition at 47 years. Figure 2-2 shows that prestressed beams reach poor condition in 45 years. The difference in the expected service life between the two beams is only 2 years. Both steel and prestressed beam deterioration curves are shown within Figure 2-5. It appears as if the deterioration curves for both types of beams are nearly identical until poor condition is reached. 3.1.2 Prestressed Box Beams vs. Prestressed I-Beams Prestressed beams were separated by box beams and I-beams to evaluate their performance individually. Figure 2-3 shows that box beams reach poor condition at 35 years. Figure 2-4 shows that prestressed I-beams reach poor condition at 52 years. Figure 2-6 displays both deterioration curves within the same plot. Notice how the box beam deterioration curve is almost linear as compared to all the other deterioration curves. Typically an element will deteriorate more rapidly at first and then slow down as time moved forward. Unlike the other curves, box beams appear to deteriorate at an almost constant rate. Overall prestressed I-beams deteriorate significantly slower as compared to prestressed box beams.
10

Conclusion The study has yielded the following conclusions:
• The service life of a steel beam is estimated to be 47 years.
• The service life of a prestressed beam is estimated to be 45 years.
• The service life of a prestressed box beam is estimated to be 35 years.
• The service life of a prestressed I-beam is estimated to be 52 years.
Prestressed I-beams appear to have the longest service life of the group. Prestressed box
beams service life is approximately 17 years less than that of prestressed I-beams. Steel
beams and prestressed beams deteriorate almost identically and have an overall service
life of 45 to 47 years.
11
References [1] Devaraj, Dinesh, and Fu, Gongkang. Methodology of Homogeneous and Non-Homogeneous Markov Chains for Modeling Bridge Element Deterioration. Detroit, MI: Wayne State University Press, 1998. Print [2] Juntunen, Dave. BMS: Domestic Scan on Bridge Management. Lansing, MI: Michigan Department of Transportation, 19 Nov 2009. Powerpoint.
12
Brid
ge C
ondi
tion
Cha
nge
Mat
rix20
04-2
005
Wen
t up
Sam
ple
Siz
e0
12
34
56
78
90
389
88
222
270
84
3423
220
941
71
1767
856
3268
36
956
618
5640
15
422
375
3390
45
855
443
442
01
00
148
2467
Tran
sitio
n Pr
obab
ility
Mat
rixP
erce
nt
Unr
ated
0
12
34
56
78
99
00
00
00
00.
2105
260.
2105
260.
5789
478
00
00
00
0.01
4815
0.12
5926
0.85
9259
1.26
8237
70
00
00.
0010
630.
0180
660.
0712
010.
9096
714.
5696
616
00
00
0.01
3177
0.08
1991
0.90
4832
7.32
1506
5.83
7899
50
00
0.00
9975
0.05
4863
0.93
5162
6.93
1028
13.1
594
40
00
0.05
5556
0.94
4444
10.3
4002
20.0
9043
30
00
112
.126
7730
.430
452
#DIV
/0!
#DIV
/0!
#DIV
/0!
#DIV
/0!
42.5
5722
1#D
IV/0
!#D
IV/0
!#D
IV/0
!
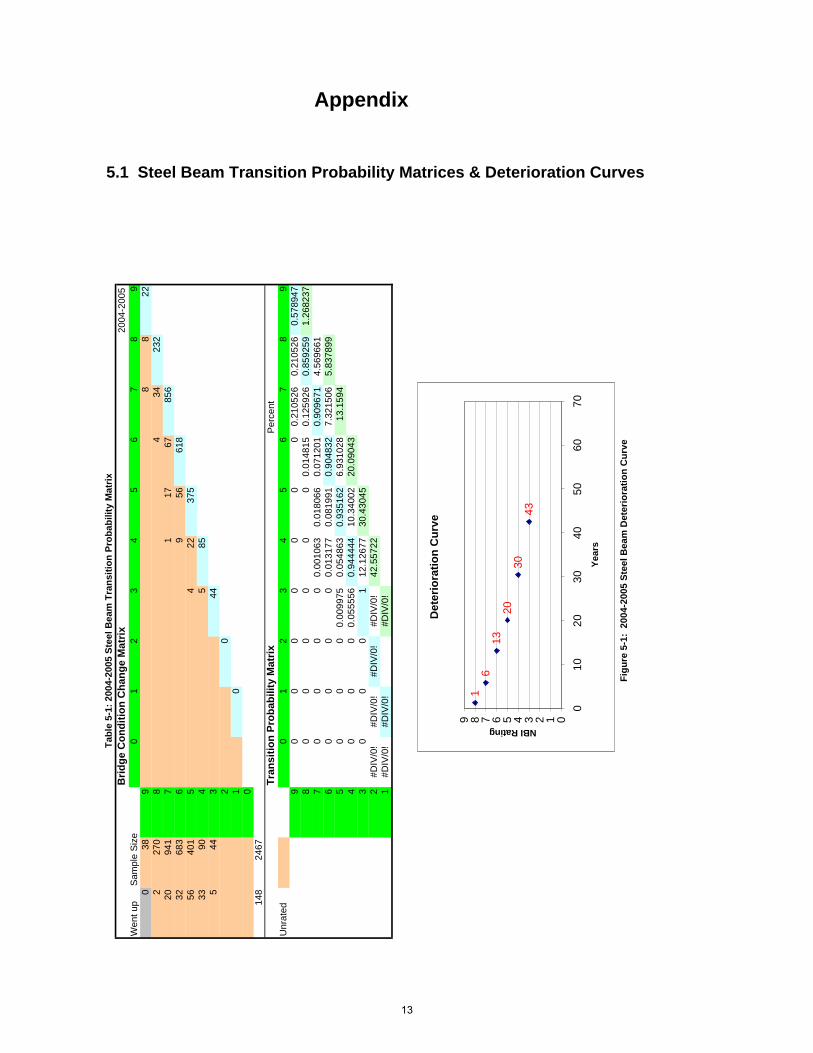
Appendix
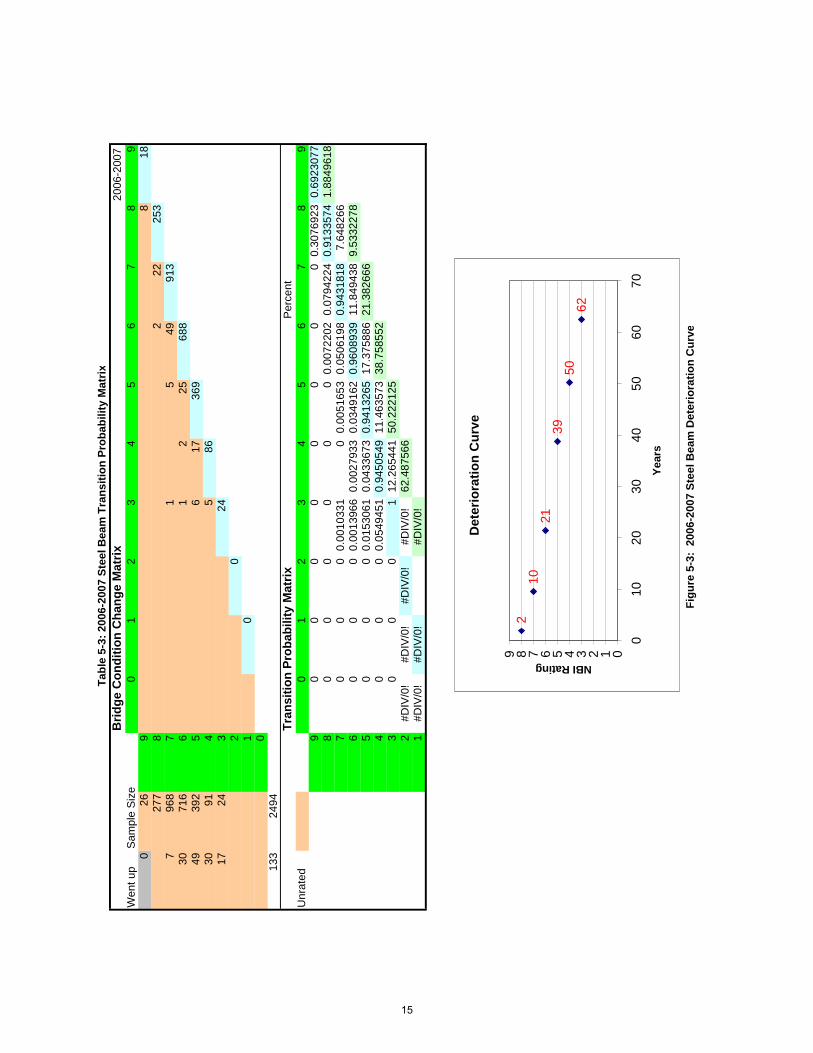
5.1 Steel Beam Transition Probability Matrices & Deterioration Curves
Tabl
e 5-
1: 2
004-
2005
Ste
el B
eam
Tra
nsiti
on P
roba
bilit
y M
atrix
Figu
re 5
-1:
2004
-200
5 St
eel B
eam
Det
erio
ratio
n C
urve
Det
erio
ratio
n C
urve
16
1320
3043
0123456789
010
2030
4050
6070
Year
s
NBI Rating
13
Brid
ge C
ondi
tion
Cha
nge
Mat
rix20
05-2
006
Wen
t up
Sam
ple
Siz
e0
12
34
56
78
90
349
29
2328
18
241
238
1193
67
311
5287
041
685
63
822
652
4541
45
315
396
2098
44
9422
313
312
01
00
139
2479
Tran
sitio
n Pr
obab
ility
Mat
rixP
erce
nt
Unr
ated
0
12
34
56
78
99
00
00
00
00.
0588
235
0.26
4705
90.
6764
706
80
00
00
00.
0071
174
0.14
5907
50.
8469
751
1.77
3361
37
00
00
0.00
3205
10.
0117
521
0.05
5555
60.
9294
872
4.17
3473
76
00
00.
0043
796
0.01
1678
80.
0321
168
0.95
1824
89.
4792
904
5.94
6834
95
00
00.
0072
464
0.03
6231
90.
9565
217
14.0
3863
15.4
2612
54
00
00.
0408
163
0.95
9183
715
.593
244
29.4
6475
53
00
01
16.6
3312
545
.057
999
2#D
IV/0
!#D
IV/0
!#D
IV/0
!#D
IV/0
!61
.691
124
1#D
IV/0
!#D
IV/0
!#D
IV/0
!
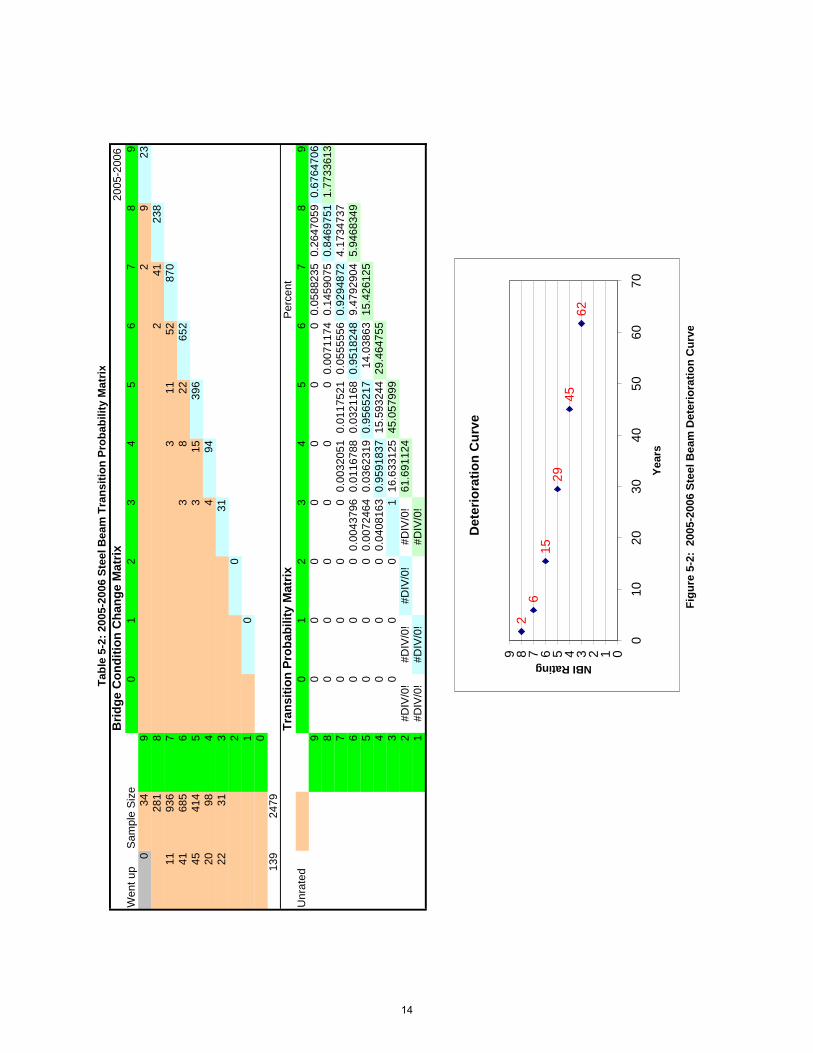
Tabl
e 5-
2: 2
005-
2006
Ste
el B
eam
Tra
nsiti
on P
roba
bilit
y M
atri x
Figu
re 5
-2:
2005
-200
6 St
eel B
eam
Det
erio
ratio
n C
urve
Det
erio
ratio
n C
urve
26
1529
4562
0123456789
010
2030
4050
6070
Year
s
NBI Rating
14
Brid
ge C
ondi
tion
Cha
nge
Mat
rix20
06-2
007
Wen
t up
Sam
ple
Siz
e0
12
34
56
78
90
269
818
277
82
2225
37
968
71
549
913
3071
66
12
2568
849
392
56
1736
930
914
586
1724
324
20
10
013
324
94Tr
ansi
tion
Prob
abili
ty M
atrix
Per
cent
U
nrat
ed
01
23
45
67
89
90
00
00
00
00.
3076
923
0.69
2307
78
00
00
00
0.00
7220
20.
0794
224
0.91
3357
41.
8849
618
70
00
0.00
1033
10
0.00
5165
30.
0506
198
0.94
3181
87.
6482
666
00
00.
0013
966
0.00
2793
30.
0349
162
0.96
0893
911
.849
438
9.53
3227
85
00
00.
0153
061
0.04
3367
30.
9413
265
17.3
7588
621
.382
666
40
00
0.05
4945
10.
9450
549
11.4
6357
338
.758
552
30
00
112
.265
441
50.2
2212
52
#DIV
/0!
#DIV
/0!
#DIV
/0!
#DIV
/0!
62.4
8756
61
#DIV
/0!
#DIV
/0!
#DIV
/0!
Tabl
e 5-
3: 2
006-
2007
Ste
el B
eam
Tra
nsiti
on P
roba
bilit
y M
atri x
Figu
re 5
-3:
2006
-200
7 St
eel B
eam
Det
erio
ratio
n C
urve
Det
erio
ratio
n C
urve
210
2139
5062
0123456789
010
2030
4050
6070
Year
s
NBI Rating
15

Brid
ge C
ondi
tion
Cha
nge
Mat
rix20
07-2
008
Wen
t up
Sam
ple
Siz
e0
12
34
56
78
90
229
23
172
275
81
1426
011
980
72
15
4293
040
740
63
2970
842
372
52
1535
536
714
467
928
328
20
10
014
024
88Tr
ansi
tion
Prob
abili
ty M
atrix
Per
cent
U
nrat
ed
01
23
45
67
89
90
00
00
00
0.09
0909
10.
1363
636
0.77
2727
38
00
00
00
0.00
3636
40.
0509
091
0.94
5454
52.
6883
977
70
00
0.00
2040
80.
0010
204
0.00
5102
0.04
2857
10.
9489
796
12.3
5788
56
00
00
0.00
4054
10.
0391
892
0.95
6756
813
.236
086
15.0
4628
35
00
00.
0053
763
0.04
0322
60.
9543
011
15.6
7990
228
.282
369
40
00
0.05
6338
0.94
3662
14.8
1841
643
.962
271
30
00
111
.953
4458
.780
687
2#D
IV/0
!#D
IV/0
!#D
IV/0
!#D
IV/0
!70
.734
126
1#D
IV/0
!#D
IV/0
!#D
IV/0
!
Figu
re 5
-4:
2007
-200
8 St
eel B
eam
Det
erio
ratio
n C
urv e
Tabl
e 5-
4: 2
007-
2008
Ste
el B
eam
Tra
nsiti
on P
roba
bilit
y M
atrix
Det
erio
ratio
n C
urve
315
2844
59
0123456789
010
2030
4050
6070
Year
s
NBI Rating
16

Brid
ge C
ondi
tion
Cha
nge
Mat
rix20
08-2
009
Wen
t up
Sam
ple
Siz
e0
12
34
56
78
90
349
826
279
81
2625
23
1007
76
4395
838
738
62
232
702
2637
95
58
366
2167
41
6619
173
116
20
10
010
725
21Tr
ansi
tion
Prob
abili
ty M
atrix
Per
cent
U
nrat
ed
01
23
45
67
89
90
00
00
00
00.
2352
941
0.76
4705
98
00
00
00.
0035
842
00.
0931
90.
9032
258
2.58
3824
97
00
00
00.
0059
583
0.04
2701
10.
9513
406
6.81
0069
16
00
00.
0027
10.
0027
10.
0433
604
0.95
1219
513
.895
427
9.39
3894
50
00
0.01
3192
60.
0211
082
0.96
5699
213
.860
055
23.2
8932
14
00
00.
0149
254
0.98
5074
619
.859
317
37.1
4937
63
00
0.05
8823
50.
9411
765
46.0
9341
957
.008
693
2#D
IV/0
!#D
IV/0
!#D
IV/0
!11
.433
427
103.
1021
11
#DIV
/0!
#DIV
/0!
114.
5355
4
Tabl
e 5-
5: 2
008-
2009
Ste
el B
eam
Tra
nsiti
on P
roba
bilit
y M
atri x
Figu
re 5
-5:
2008
-200
9 St
eel B
eam
Det
erio
ratio
n C
urve
Det
erio
ratio
n C
urve
39
2337
57
0123456789
010
2030
4050
6070
Year
s
NBI Rating
17

Brid
ge C
ondi
tion
Cha
nge
Mat
rix20
09-2
010
Wen
t up
Sam
ple
Siz
e0
12
34
56
78
90
289
35
201
275
825
250
1710
247
764
953
4671
26
12
2568
447
377
51
637
023
534
152
717
317
12
01
00
142
2486
Tran
sitio
n Pr
obab
ility
Mat
rixP
erce
nt
Unr
ated
0
12
34
56
78
99
00
00
00
00.
1071
429
0.17
8571
40.
7142
857
80
00
00
00
0.09
0909
10.
9090
909
2.06
0042
77
00
00
00.
0068
359
0.06
250.
9306
641
7.27
2540
96
00
00.
0014
045
0.00
2809
0.03
5112
40.
9606
742
9.64
6215
89.
3325
836
50
00
0.00
2652
50.
0159
151
0.98
1432
417
.276
852
18.9
7879
94
00
00.
0188
679
0.98
1132
136
.983
271
36.2
5565
13
00
01
36.3
8912
773
.238
922
2#D
IV/0
!#D
IV/0
!#D
IV/0
!#D
IV/0
!10
9.62
805
1#D
IV/0
!#D
IV/0
!#D
IV/0
!
Tabl
e 5-
6: 2
009-
2010
Ste
el B
eam
Tra
nsiti
on P
roba
bilit
y M
atrix
Figu
re 5
-6:
2009
-201
0 St
eel B
eam
Det
erio
ratio
n C
urve
Det
erio
ratio
n C
urve
29
1936
0123456789
010
2030
4050
6070
Year
s
NBI Rating
18
Brid
ge C
ondi
tion
Cha
nge
Mat
rix20
04-2
005
Wen
t up
Sam
ple
Siz
e0
12
34
56
78
90
132
910
4973
438
08
521
354
326
67
313
1823
26
164
61
115
147
1110
05
27
9111
524
844
619
319
12
01
10
043
1113
Tran
sitio
n Pr
obab
ility
Mat
rixP
erce
nt
Unr
ated
0
12
34
56
78
99
00
00
00
00.
0757
580.
3712
120.
5530
38
00
00
00
0.01
3158
0.05
5263
0.93
1579
1.17
018
70
00
00.
0112
780.
0488
720.
0676
690.
8721
89.
7799
466
00
00.
0060
980.
0060
980.
0914
630.
8963
415.
0683
8710
.950
135
00
00.
020.
070.
916.
3339
3816
.018
514
00
00.
1538
460.
8461
547.
3496
1522
.352
453
00
01
4.14
9238
29.7
0207
2#D
IV/0
!#D
IV/0
!#D
IV/0
!#D
IV/0
!33
.851
31
#DIV
/0!
#DIV
/0!
#DIV
/0!
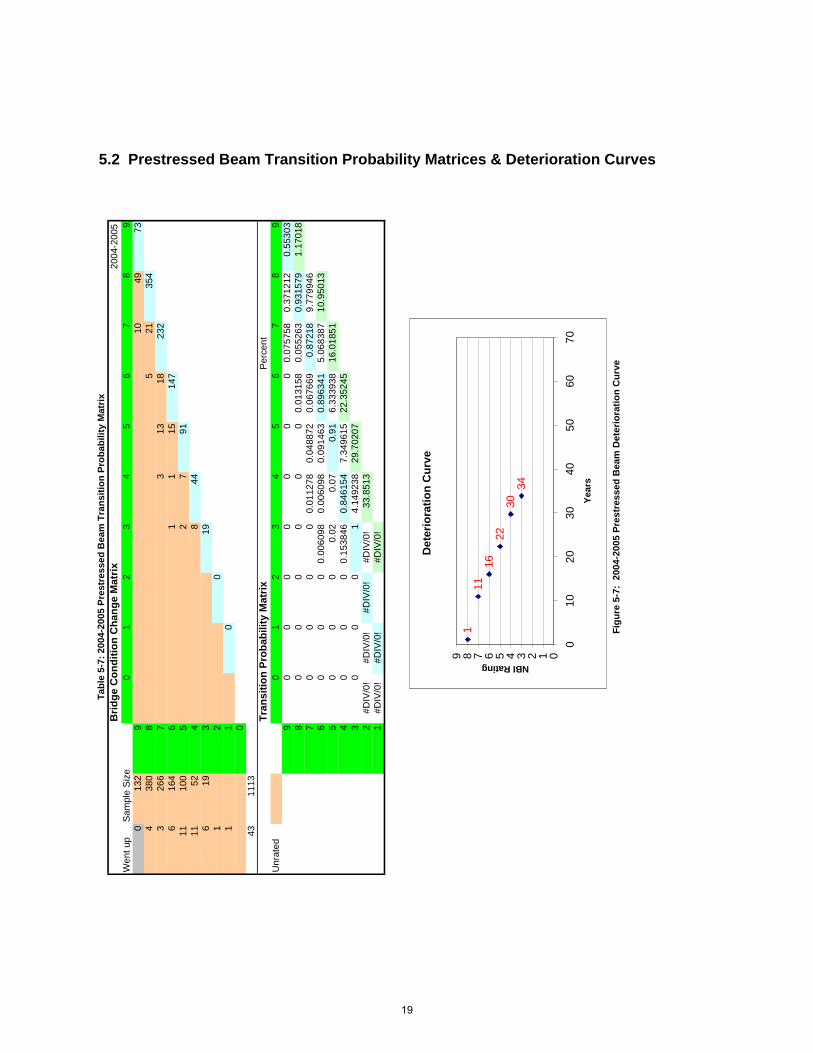
Tabl
e 5-
7: 2
004-
2005
Pre
stre
ssed
Bea
m T
rans
ition
Pro
babi
lity
Mat
ri x
Figu
re 5
-7:
2004
-200
5 Pr
estr
esse
d B
eam
Det
erio
ratio
n C
urve
5.2 Prestressed Beam Transition Probability Matrices & Deterioration Curves
Det
erio
ratio
n C
urve
111
1622
3034
0123456789
010
2030
4050
6070
Year
s
NBI Rating
19

Brid
ge C
ondi
tion
Cha
nge
Mat
rix20
05-2
006
Wen
t up
Sam
ple
Siz
e0
12
34
56
78
90
999
125
734
414
81
3038
327
07
14
1525
06
173
62
114
156
1211
45
14
109
749
49
408
223
222
01
00
3711
41Tr
ansi
tion
Prob
abili
ty M
atrix
Per
cent
U
nrat
ed
01
23
45
67
89
90
00
00
00
0.01
0101
0.25
2525
30.
7373
737
80
00
00
00.
0024
155
0.07
2463
80.
9251
208
2.27
5146
97
00
00
0.00
3703
70.
0148
148
0.05
5555
60.
9259
259
8.90
586
00
00.
0115
607
0.00
5780
30.
0809
249
0.90
1734
19.
0064
683
11.1
8094
75
00
00.
0087
719
0.03
5087
70.
9561
404
6.70
1244
720
.187
415
40
00
0.18
3673
50.
8163
265
15.4
5459
226
.888
663
00
01
3.41
5513
442
.343
251
2#D
IV/0
!#D
IV/0
!#D
IV/0
!#D
IV/0
!45
.758
765
1#D
IV/0
!#D
IV/0
!#D
IV/0
!
Tabl
e 5-
8: 2
005-
2006
Pre
stre
ssed
Bea
m T
rans
ition
Pro
babi
lity
Mat
rix
Figu
re 5
-8:
2005
-200
6 Pr
estr
esse
d B
eam
Det
erio
ratio
n C
urve
Det
erio
ratio
n C
urve
211
2027
4246
0123456789
010
2030
4050
6070
Year
s
NBI Rating
20

Brid
ge C
ondi
tion
Cha
nge
Mat
rix20
06-2
007
Wen
t up
Sam
ple
Siz
e0
12
34
56
78
90
889
126
612
420
81
433
382
128
87
24
282
717
16
17
163
3099
51
197
1136
42
346
283
127
20
10
057
1130
Tran
sitio
n Pr
obab
ility
Mat
rixP
erce
nt
Unr
ated
0
12
34
56
78
99
00
00
00
00.
0113
636
0.29
5454
50.
6931
818
80
00
00
0.00
2381
0.00
9523
80.
0785
714
0.90
9523
81.
8914
523
70
00
00
0.00
6944
40.
0138
889
0.97
9166
77.
3090
498
60
00
00.
0058
480.
0409
357
0.95
3216
432
.923
275
9.20
0502
15
00
00.
0101
010.
0101
010.
9797
9814
.466
6842
.123
777
40
00
0.05
5555
60.
9444
444
33.9
6303
356
.590
457
30
00.
0357
143
0.96
4285
712
.126
774
90.5
5349
2#D
IV/0
!#D
IV/0
!#D
IV/0
!19
.059
447
102.
6802
61
#DIV
/0!
#DIV
/0!
121.
7397
1
Tabl
e 5-
9: 2
006-
2007
Pre
stre
ssed
Bea
m T
rans
ition
Pro
babi
lity
Mat
ri x
Figu
re 5
-9:
2006
-200
7 Pr
estr
esse
d B
eam
Det
erio
ratio
n C
urve
Det
erio
ratio
n C
urve
29
4257
0123456789
010
2030
4050
6070
Year
s
NBI Rating
21

Brid
ge C
ondi
tion
Cha
nge
Mat
rix20
07-2
008
Wen
t up
Sam
ple
Siz
e0
12
34
56
78
90
749
122
517
410
81
22
1339
22
323
77
2329
313
179
61
517
39
104
57
977
304
327
1119
319
12
01
00
5011
39Tr
ansi
tion
Prob
abili
ty M
atrix
Per
cent
U
nrat
ed
01
23
45
67
89
90
00
00
00
0.01
3513
50.
2972
973
0.68
9189
28
00
00
0.00
2439
0.00
4878
0.00
4878
0.03
1707
30.
9560
976
1.86
2100
27
00
00
00.
0216
718
0.07
1207
40.
9071
207
15.4
3918
66
00
00
0.00
5586
60.
0279
330.
9664
804
7.11
0681
317
.301
286
50
00
00.
0673
077
0.93
2692
320
.330
348
24.4
1196
74
00
00.
10.
99.
9475
885
44.7
4231
53
00
01
6.57
8813
554
.689
904
2#D
IV/0
!#D
IV/0
!#D
IV/0
!#D
IV/0
!61
.268
717
1#D
IV/0
!#D
IV/0
!#D
IV/0
!
Figu
re 5
-10:
200
7-20
08 P
rest
ress
ed B
eam
Det
erio
ratio
n C
urv e
Tabl
e 5-
10: 2
007-
2008
Pre
stre
ssed
Bea
m T
rans
ition
Pro
babi
lity
Mat
rix
Det
erio
ratio
n C
urve
217
2445
5561
0123456789
010
2030
4050
6070
Year
s
NBI Rating
22

Brid
ge C
ondi
tion
Cha
nge
Mat
rix20
08-2
009
Wen
t up
Sam
ple
Siz
e0
12
34
56
78
90
789
221
5542
08
336
381
231
97
110
308
1019
26
1018
210
101
54
394
731
41
307
153
152
01
00
3611
56Tr
ansi
tion
Prob
abili
ty M
atrix
Per
cent
U
nrat
ed
01
23
45
67
89
90
00
00
00
0.02
5641
0.26
9230
80.
7051
282
80
00
00
00.
0071
429
0.08
5714
30.
9071
429
1.98
3959
77
00
00
00.
0031
348
0.03
1348
0.96
5517
27.
1124
66
00
00
00.
0520
833
0.94
7916
719
.752
668
9.09
6419
75
00
00.
0396
040.
0297
030.
9306
931
12.9
5876
328
.849
087
40
00
0.03
2258
10.
9677
419
9.65
0401
641
.807
853
00
01
21.1
3909
551
.458
252
2#D
IV/0
!#D
IV/0
!#D
IV/0
!#D
IV/0
!72
.597
347
1#D
IV/0
!#D
IV/0
!#D
IV/0
!
Tabl
e 5-
11: 2
008-
2009
Pre
stre
ssed
Bea
m T
rans
ition
Pro
babi
lity
Mat
rix
Figu
re 5
-11:
200
8-20
09 P
rest
ress
ed B
eam
Det
erio
ratio
n C
urve
Det
erio
ratio
n C
urve
29
2942
51
0123456789
010
2030
4050
6070
Year
s
NBI Rating
23

Brid
ge C
ondi
tion
Cha
nge
Mat
rix20
09-2
010
Wen
t up
Sam
ple
Siz
e0
12
34
56
78
90
749
1361
340
18
337
361
335
67
314
339
1218
76
418
310
975
295
528
428
912
312
20
10
042
1155
Tran
sitio
n Pr
obab
ility
Mat
rixP
erce
nt
Unr
ated
0
12
34
56
78
99
00
00
00
00
0.17
5675
70.
8243
243
80
00
00
00.
0074
813
0.09
2269
30.
9002
494
3.58
7881
27
00
00
00.
0084
270.
0393
258
0.95
2247
26.
5961
582
60
00
00
0.02
1390
40.
9786
096
14.1
6591
810
.184
039
50
00
00.
0206
186
0.97
9381
432
.056
808
24.3
4995
74
00
00
133
.269
861
56.4
0676
53
00
01
#DIV
/0!
89.6
7662
62
#DIV
/0!
#DIV
/0!
#DIV
/0!
#DIV
/0!
#DIV
/0!
1#D
IV/0
!#D
IV/0
!#D
IV/0
!
Tabl
e 5-
12: 2
009-
2010
Pre
stre
ssed
Bea
m T
rans
ition
Pro
babi
lity
Mat
ri x
Figu
re 5
-12:
200
9-20
10 P
rest
ress
ed B
eam
Det
erio
ratio
n C
urve
Det
erio
ratio
n C
urve
410
2456
0
0123456789
010
2030
4050
6070
Year
s
NBI Rating
24
Brid
ge C
ondi
tion
Cha
nge
Mat
rix20
04-2
005
Wen
t up
Sam
ple
Siz
e0
12
34
56
78
90
559
116
383
144
81
314
02
457
441
356
12
327
385
15
323
254
520
510
310
20
10
10
2135
2Tr
ansi
tion
Prob
abili
ty M
atrix
Per
cent
U
nrat
ed
01
23
45
67
89
90
00
00
00
0.01
8181
80.
2909
091
0.69
0909
18
00
00
00
0.00
6944
40.
0208
333
0.97
2222
21.
8746
525
70
00
00
00.
0888
889
0.91
1111
124
.605
098
60
00
0.02
8571
40
0.05
7142
90.
9142
857
7.44
5955
926
.479
755
00
00.
0263
158
0.13
1578
90.
8421
053
7.73
4968
33.9
2570
64
00
00.
20.
84.
0334
3741
.660
674
30
00
13.
1062
837
45.6
9411
12
#DIV
/0!
#DIV
/0!
#DIV
/0!
#DIV
/0!
48.8
0039
51
#DIV
/0!
#DIV
/0!
#DIV
/0!
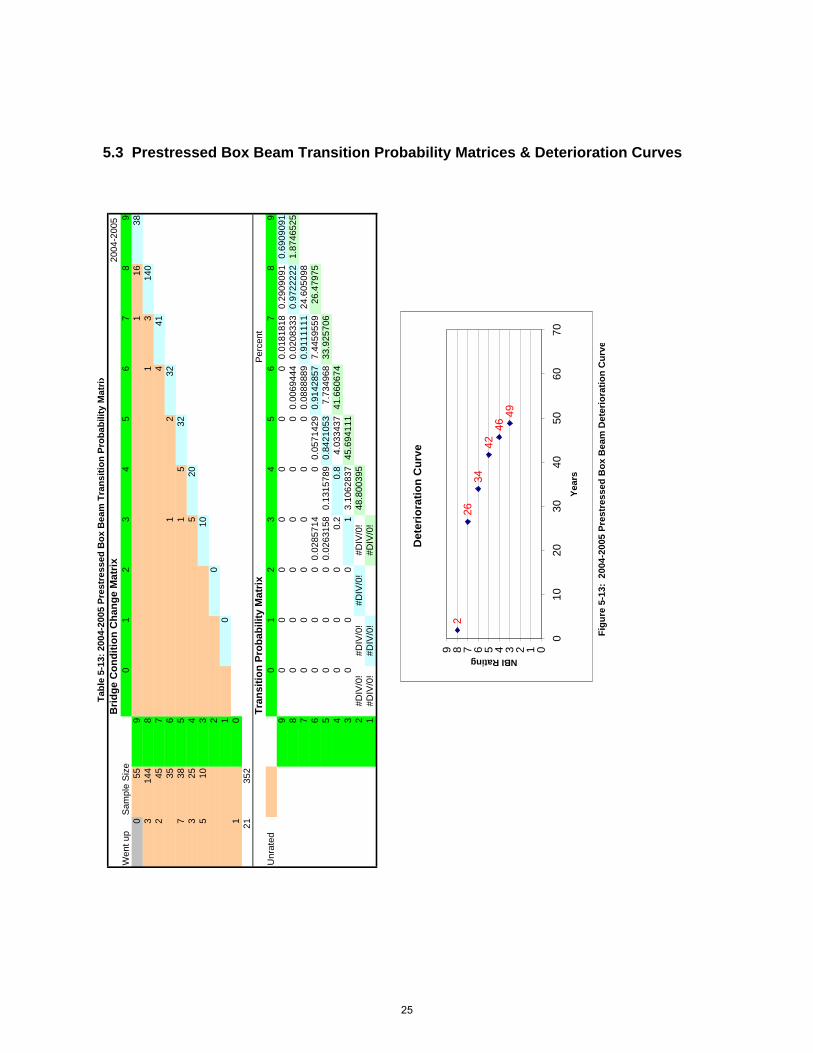
Tabl
e 5-
13: 2
004-
2005
Pre
stre
ssed
Box
Bea
m T
rans
ition
Pro
babi
lity
Mat
rix
Figu
re 5
-13:
200
4-20
05 P
rest
ress
ed B
ox B
eam
Det
erio
ratio
n C
urve
5.3 Prestressed Box Beam Transition Probability Matrices & Deterioration Curves
Det
erio
ratio
n C
urve
226
3442
4649
0123456789
010
2030
4050
6070
Year
s
NBI Rating
25
Brid
ge C
ondi
tion
Cha
nge
Mat
rix20
05-2
006
Wen
t up
Sam
ple
Siz
e0
12
34
56
78
90
539
113
393
162
81
615
545
71
440
138
61
14
326
315
12
282
244
519
413
313
20
10
016
366
Tran
sitio
n Pr
obab
ility
Mat
rixP
erce
nt
Unr
ated
0
12
34
56
78
99
00
00
00
00.
0188
679
0.24
5283
0.73
5849
18
00
00
00
0.00
6172
80.
0370
370.
9567
901
2.25
9793
97
00
00
00.
0222
222
0.08
8888
90.
8888
889
15.6
9228
16
00
00.
0263
158
0.02
6315
80.
1052
632
0.84
2105
35.
8849
492
17.9
5207
55
00
00.
0322
581
0.06
4516
10.
9032
258
4.03
3437
23.8
3702
44
00
00.
2083
333
0.79
1666
76.
8100
691
27.8
7046
13
00
01
2.96
7051
34.6
8053
2#D
IV/0
!#D
IV/0
!#D
IV/0
!#D
IV/0
!37
.647
581
1#D
IV/0
!#D
IV/0
!#D
IV/0
!
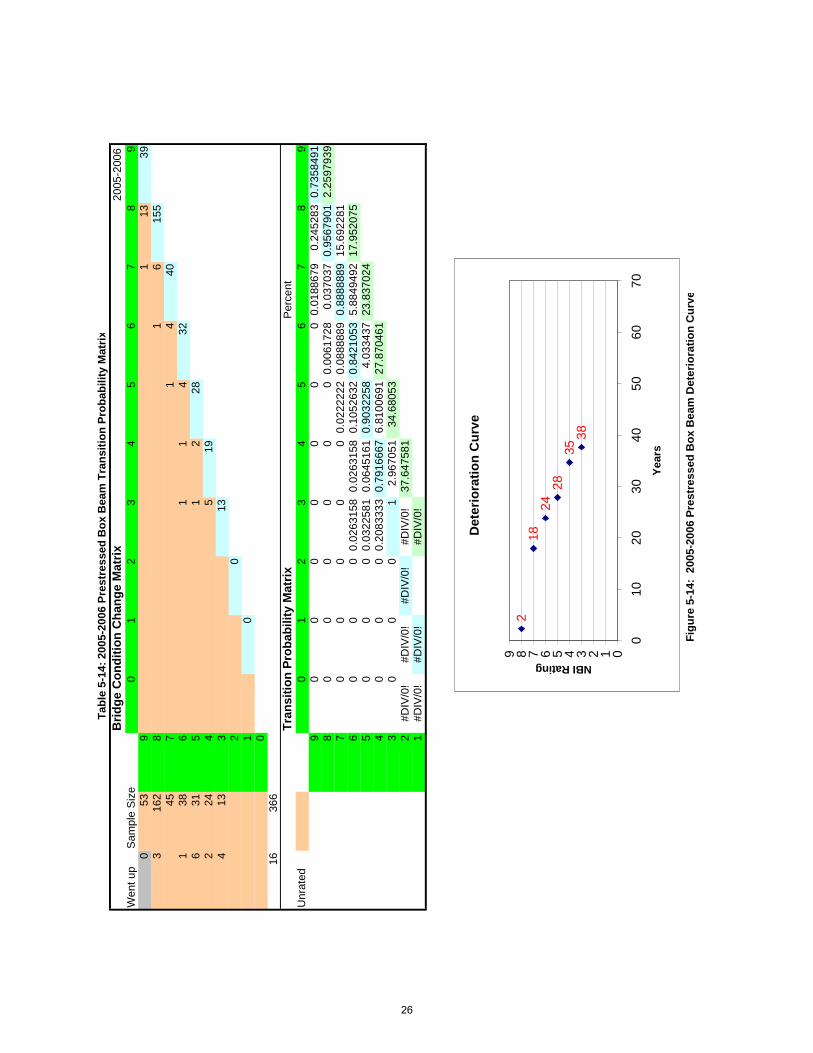
Tabl
e 5-
14: 2
005-
2006
Pre
stre
ssed
Box
Bea
m T
rans
ition
Pro
babi
lity
Mat
ri x
Figu
re 5
-14:
200
5-20
06 P
rest
ress
ed B
ox B
eam
Det
erio
ratio
n C
urve
Det
erio
ratio
n C
urve
218
2428
3538
0123456789
010
2030
4050
6070
Year
s
NBI Rating
26

Brid
ge C
ondi
tion
Cha
nge
Mat
rix20
06-2
007
Wen
t up
Sam
ple
Siz
e0
12
34
56
78
90
479
110
362
175
81
211
161
487
21
451
386
12
354
315
130
517
41
162
183
117
20
10
014
374
Tran
sitio
n Pr
obab
ility
Mat
rixP
erce
nt
Unr
ated
0
12
34
56
78
99
00
00
00
00.
0212
766
0.21
2766
0.76
5957
48
00
00
00.
0057
143
0.01
1428
60.
0628
571
0.92
2.59
9672
47
00
00
00.
0416
667
0.02
0833
30.
9375
8.31
2950
46
00
00
0.02
6315
80.
0526
316
0.92
1052
610
.740
054
10.9
1262
35
00
00.
0322
581
00.
9677
419
8.42
8541
21.6
5267
64
00
00.
0588
235
0.94
1176
521
.139
095
30.0
8121
73
00
0.05
5555
60.
9444
444
11.4
3342
751
.220
312
2#D
IV/0
!#D
IV/0
!#D
IV/0
!12
.126
774
62.6
5373
91
#DIV
/0!
#DIV
/0!
74.7
8051
4
Tabl
e 5-
15: 2
006-
2007
Pre
stre
ssed
Box
Bea
m T
rans
ition
Pro
babi
lity
Mat
rix
Figu
re 5
-15:
200
6-20
07 P
rest
ress
ed B
ox B
eam
Det
erio
ratio
n C
urve
Det
erio
ratio
n C
urve
311
2230
5163
0123456789
010
2030
4050
6070
Year
s
NBI Rating
27

Brid
ge C
ondi
tion
Cha
nge
Mat
rix20
07-2
008
Wen
t up
Sam
ple
Siz
e0
12
34
56
78
90
429
114
271
174
81
21
716
32
557
42
496
336
13
293
355
233
314
41
137
123
121
20
10
023
365
Tran
sitio
n Pr
obab
ility
Mat
rixP
erce
nt
Unr
ated
0
12
34
56
78
99
00
00
00
00.
0238
095
0.33
3333
30.
6428
571
80
00
00.
0057
471
0.01
1494
30.
0057
471
0.04
0229
90.
9367
816
1.56
8799
97
00
00
00.
0727
273
0.03
6363
60.
8909
091
10.6
1398
36
00
00
0.03
0303
0.09
0909
10.
8787
879
6.00
0604
812
.182
783
50
00
00.
0571
429
0.94
2857
15.
3644
292
18.1
8338
74
00
00.
0714
286
0.92
8571
411
.780
104
23.5
4781
63
00
01
9.35
3206
735
.327
922
#DIV
/0!
#DIV
/0!
#DIV
/0!
#DIV
/0!
44.6
8112
71
#DIV
/0!
#DIV
/0!
#DIV
/0!
Figu
re 5
-16:
200
7-20
08 P
rest
ress
ed B
ox B
eam
Det
erio
ratio
n C
urv e
Tabl
e 5-
16: 2
007-
2008
Pre
stre
ssed
Box
Bea
m T
rans
ition
Pro
babi
lity
Mat
rix
Det
erio
ratio
n C
urve
212
1824
3545
0123456789
010
2030
4050
6070
Year
s
NBI Rating
28
Brid
ge C
ondi
tion
Cha
nge
Mat
rix20
08-2
009
Wen
t up
Sam
ple
Siz
e0
12
34
56
78
90
439
110
3218
08
115
164
258
72
561
316
229
240
54
135
217
41
164
93
92
01
00
1137
8Tr
ansi
tion
Prob
abili
ty M
atrix
Per
cent
U
nrat
ed
01
23
45
67
89
90
00
00
00
0.02
3255
80.
2325
581
0.74
4186
80
00
00
00.
0055
556
0.08
3333
30.
9111
111
2.34
5959
87
00
00
00
0.03
4482
80.
9655
172
7.44
5955
96
00
00
00.
0645
161
0.93
5483
919
.752
668
9.79
1915
75
00
00.
10.
025
0.87
510
.393
356
29.5
4458
34
00
00.
0588
235
0.94
1176
55.
1908
931
39.9
3793
93
00
01
11.4
3342
745
.128
832
2#D
IV/0
!#D
IV/0
!#D
IV/0
!#D
IV/0
!56
.562
259
1#D
IV/0
!#D
IV/0
!#D
IV/0
!
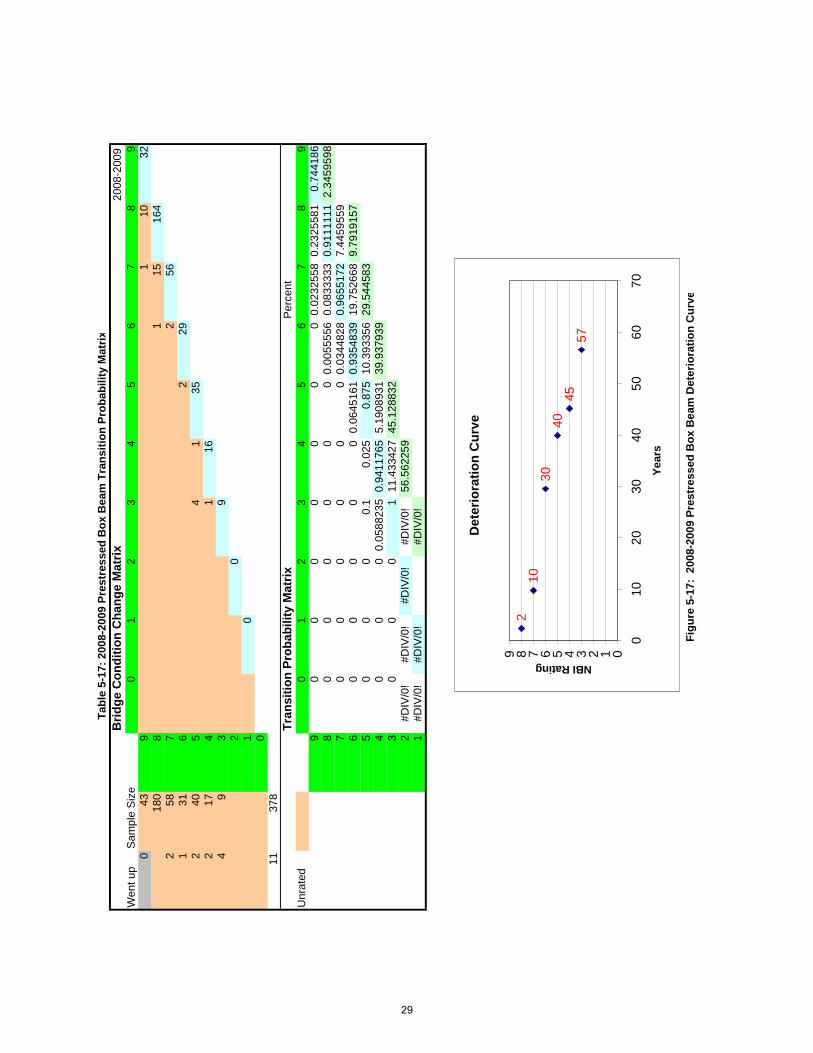
Tabl
e 5-
17: 2
008-
2009
Pre
stre
ssed
Box
Bea
m T
rans
ition
Pro
babi
lity
Mat
rix
Figu
re 5
-17:
200
8-20
09 P
rest
ress
ed B
ox B
eam
Det
erio
ratio
n C
urve
Det
erio
ratio
n C
urve
210
3040
4557
0123456789
010
2030
4050
6070
Year
s
NBI Rating
29
Brid
ge C
ondi
tion
Cha
nge
Mat
rix20
09-2
010
Wen
t up
Sam
ple
Siz
e0
12
34
56
78
90
399
831
117
58
316
156
171
71
565
430
62
283
355
352
154
158
73
72
01
00
1937
2Tr
ansi
tion
Prob
abili
ty M
atrix
Per
cent
U
nrat
ed
01
23
45
67
89
90
00
00
00
00.
2051
282
0.79
4871
88
00
00
00
0.01
7142
90.
0914
286
0.89
1428
63.
0192
698
70
00
00
0.01
4084
50.
0704
225
0.91
5493
6.03
1039
66
00
00
00.
0666
667
0.93
3333
37.
8505
687
9.05
0309
45
00
00
01
10.0
4664
916
.900
878
40
00
01
#DIV
/0!
26.9
4752
73
00
01
#DIV
/0!
#DIV
/0!
2#D
IV/0
!#D
IV/0
!#D
IV/0
!#D
IV/0
!#D
IV/0
!1
#DIV
/0!
#DIV
/0!
#DIV
/0!
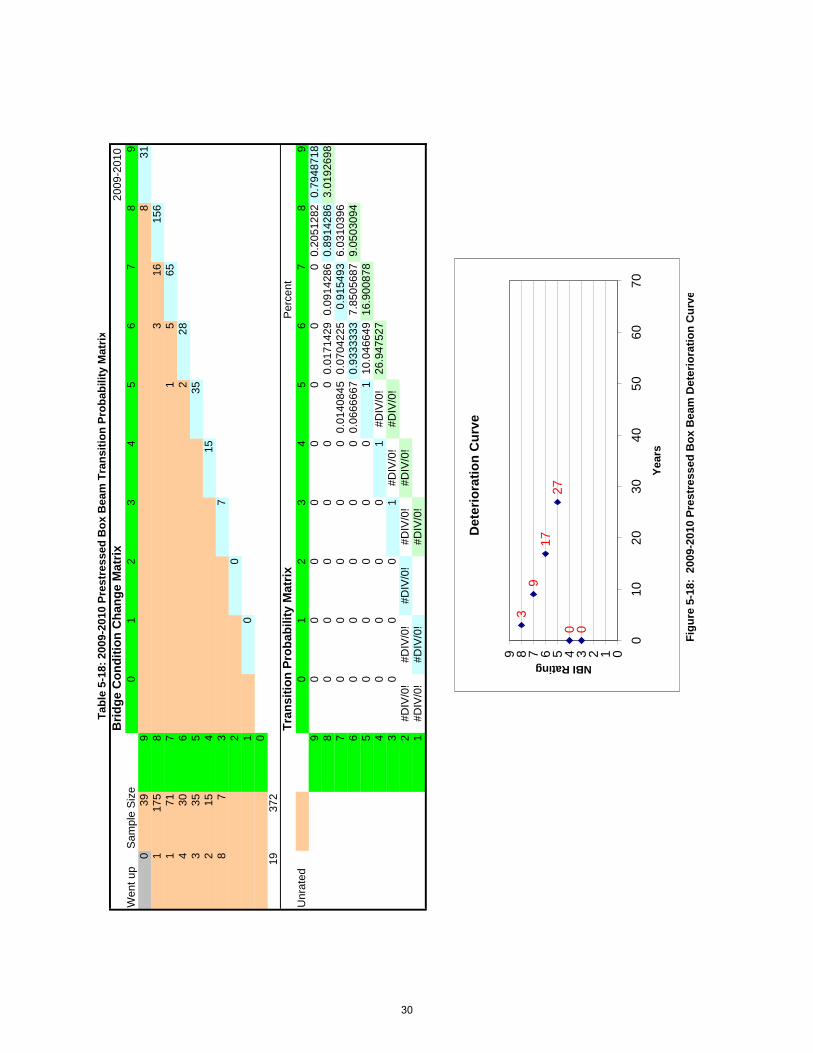
Tabl
e 5-
18: 2
009-
2010
Pre
stre
ssed
Box
Bea
m T
rans
ition
Pro
babi
lity
Mat
ri x
Figu
re 5
-18:
200
9-20
10 P
rest
ress
ed B
ox B
eam
Det
erio
ratio
n C
urve
Det
erio
ratio
n C
urve
39
1727
0 0
0123456789
010
2030
4050
6070
Year
s
NBI Rating
30

Brid
ge C
ondi
tion
Cha
nge
Mat
rix20
04-2
005
Wen
t up
Sam
ple
Siz
e0
12
34
56
78
90
779
933
351
236
84
1821
41
216
73
1314
186
512
96
113
115
462
51
259
827
43
241
93
91
20
11
00
2275
6Tr
ansi
tion
Prob
abili
ty M
atrix
Per
cent
U
nrat
ed
01
23
45
67
89
90
00
00
00
0.11
6883
10.
4285
714
0.45
4545
58
00
00
00
0.01
6949
20.
0762
712
0.90
6779
70.
8791
182
70
00
00.
0138
889
0.06
0185
20.
0648
148
0.86
1111
17.
0833
538
60
00
00.
0077
519
0.10
0775
20.
8914
729
4.63
5452
7.96
2471
95
00
00.
0161
290.
0322
581
0.95
1612
96.
0336
483
12.5
9792
44
00
00.
1111
111
0.88
8888
913
.975
603
18.6
3157
23
00
01
5.88
4949
232
.607
176
2#D
IV/0
!#D
IV/0
!#D
IV/0
!#D
IV/0
!38
.492
125
1#D
IV/0
!#D
IV/0
!#D
IV/0
!
Tabl
e 5-
19: 2
004-
2005
Pre
stre
ssed
I B
eam
Tra
nsiti
on P
roba
bilit
y M
atrix
Figu
re 5
-19:
200
4-20
05 P
rest
ress
ed I
Bea
m D
eter
iora
tion
Cur
ve
5.4 Prestressed I-Beam Transition Probability Matrices & Deterioration Curves
Det
erio
ratio
n C
urve
18
1319
3338
0123456789
010
2030
4050
6070
Year
s
NBI Rating
31

Brid
ge C
ondi
tion
Cha
nge
Mat
rix20
05-2
006
Wen
t up
Sam
ple
Siz
e0
12
34
56
78
90
469
1234
125
28
2422
821
97
13
1120
45
134
61
1012
36
825
280
525
44
214
93
92
01
00
2176
7Tr
ansi
tion
Prob
abili
ty M
atrix
Per
cent
U
nrat
ed
01
23
45
67
89
90
00
00
00
00.
2608
696
0.73
9130
48
00
00
00
00.
0952
381
0.90
4761
92.
2930
567
70
00
00.
0045
662
0.01
3698
60.
0502
283
0.93
1506
86.
9256
917
60
00
0.00
7462
70
0.07
4626
90.
9179
104
9.76
9277
39.
2187
484
50
00
00.
0243
902
0.97
5609
88.
0922
723
18.9
8802
64
00
00.
160.
8428
.071
035
27.0
8029
83
00
01
3.97
5530
355
.151
333
2#D
IV/0
!#D
IV/0
!#D
IV/0
!#D
IV/0
!59
.126
863
1#D
IV/0
!#D
IV/0
!#D
IV/0
!
Tabl
e 5-
20: 2
005-
2006
Pre
stre
ssed
I B
eam
Tra
nsiti
on P
roba
bilit
y M
atrix
Figu
re 5
-20:
200
5-20
06 P
rest
ress
ed I
Bea
m D
eter
iora
tion
Cur
ve
Det
erio
ratio
n C
urve
29
1927
5559
0123456789
010
2030
4050
6070
Year
s
NBI Rating
32

Brid
ge C
ondi
tion
Cha
nge
Mat
rix20
06-2
007
Wen
t up
Sam
ple
Siz
e0
12
34
56
78
90
419
1625
244
82
2222
01
234
71
233
613
26
512
726
675
166
619
41
184
103
102
01
00
4374
7Tr
ansi
tion
Prob
abili
ty M
atrix
Per
cent
U
nrat
ed
01
23
45
67
89
90
00
00
00
00.
3902
439
0.60
9756
18
00
00
00
0.00
8196
70.
0901
639
0.90
1639
31.
4011
572
70
00
00
00.
0042
735
0.99
5726
56.
6944
431
60
00
00
0.03
7878
80.
9621
212
161.
8496
28.
0956
002
50
00
00.
0149
254
0.98
5074
617
.950
282
169.
9452
24
00
00.
0526
316
0.94
7368
446
.093
419
187.
8955
30
00
112
.820
123
3.98
892
2#D
IV/0
!#D
IV/0
!#D
IV/0
!#D
IV/0
!24
6.80
902
1#D
IV/0
!#D
IV/0
!#D
IV/0
!
Tabl
e 5-
21: 2
006-
2007
Pre
stre
ssed
I B
eam
Tra
nsiti
on P
roba
bilit
y M
atri x
Figu
re 5
-21:
Pre
stre
ssed
200
6-20
07 I
Bea
m D
eter
iora
tion
Cur
ve
Det
erio
ratio
n C
urve
18
0123456789
010
2030
4050
6070
Year
s
NBI Rating
33
Brid
ge C
ondi
tion
Cha
nge
Mat
rix20
07-2
008
Wen
t up
Sam
ple
Siz
e0
12
34
56
78
90
329
824
623
58
15
229
264
73
2124
07
143
62
141
668
55
634
164
214
47
37
20
10
027
765
Tran
sitio
n Pr
obab
ility
Mat
rixP
erce
nt
Unr
ated
0
12
34
56
78
99
00
00
00
00
0.25
0.75
80
00
00
00.
0042
553
0.02
1276
60.
9744
681
2.40
9420
87
00
00
00.
0113
636
0.07
9545
50.
9090
909
26.8
0019
76
00
00
00.
0139
860.
9860
147.
2725
409
29.2
0961
85
00
00
0.07
3529
40.
9264
706
49.2
1263
636
.482
159
40
00
0.12
50.
875
9.07
5817
85.6
9479
53
00
01
5.19
0893
194
.770
612
2#D
IV/0
!#D
IV/0
!#D
IV/0
!#D
IV/0
!99
.961
505
1#D
IV/0
!#D
IV/0
!#D
IV/0
!
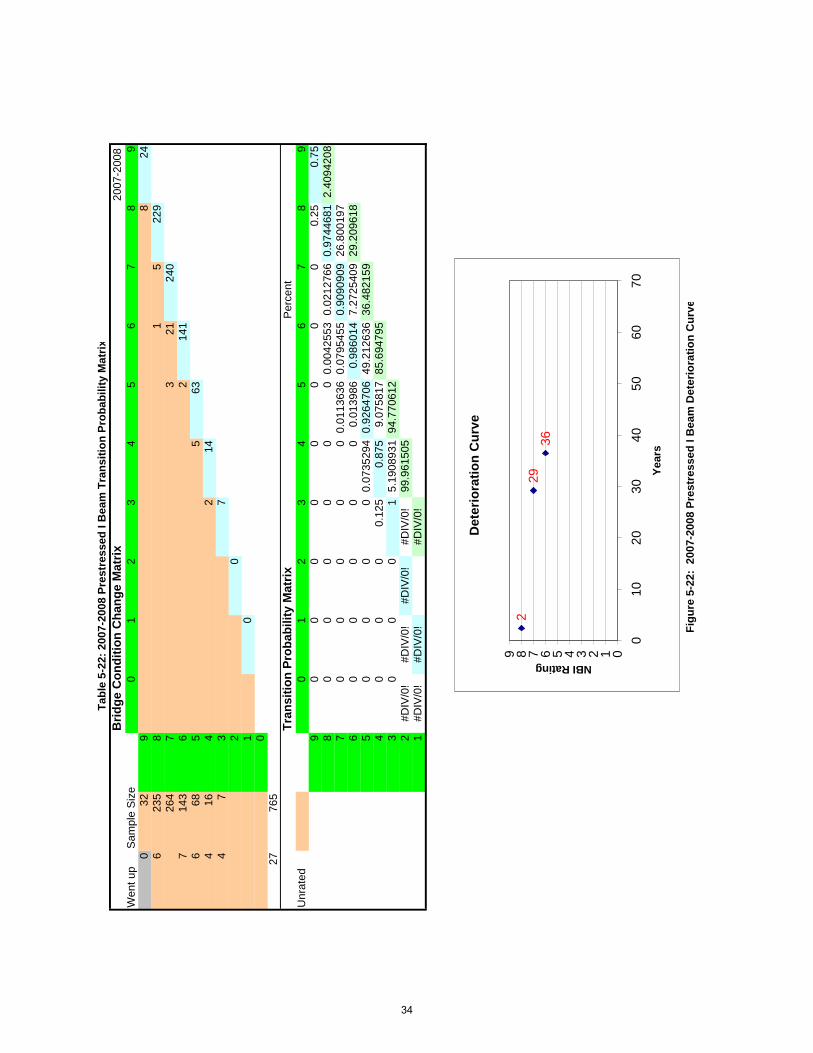
Figu
re 5
-22:
200
7-20
08 P
rest
ress
ed I
Bea
m D
eter
iora
tion
Cur
v e
Tabl
e 5-
22: 2
007-
2008
Pre
stre
ssed
I B
eam
Tra
nsiti
on P
roba
bilit
y M
atrix
Det
erio
ratio
n C
urve
229
36
0123456789
010
2030
4050
6070
Year
s
NBI Rating
34

Brid
ge C
ondi
tion
Cha
nge
Mat
rix20
08-2
009
Wen
t up
Sam
ple
Siz
e0
12
34
56
78
90
359
111
2324
08
221
217
256
71
824
79
158
68
150
860
52
585
144
143
63
62
01
00
2576
9Tr
ansi
tion
Prob
abili
ty M
atrix
Per
cent
U
nrat
ed
01
23
45
67
89
90
00
00
00
0.02
8571
40.
3142
857
0.65
7142
98
00
00
00
0.00
8333
30.
0875
0.90
4166
71.
6509
249
70
00
00
0.00
3906
30.
0312
50.
9648
438
6.88
0448
56
00
00
00.
0506
329
0.94
9367
119
.367
546
8.53
1373
45
00
00
0.03
3333
30.
9666
667
13.3
4008
227
.898
919
40
00
01
20.4
4588
441
.239
001
30
00
1#D
IV/0
!61
.684
885
2#D
IV/0
!#D
IV/0
!#D
IV/0
!#D
IV/0
!#D
IV/0
!1
#DIV
/0!
#DIV
/0!
#DIV
/0!
Tabl
e 5-
23: 2
008-
2009
Pre
stre
ssed
I B
eam
Tra
nsiti
on P
roba
bilit
y M
atri x
Figu
re 5
-23:
200
8-20
09 P
rest
ress
ed I
Bea
m D
eter
iora
tion
Cur
ve
Det
erio
ratio
n C
urve
29
2841
620
0123456789
010
2030
4050
6070
Year
s
NBI Rating
35

Brid
ge C
ondi
tion
Cha
nge
Mat
rix20
09-2
010
Wen
t up
Sam
ple
Siz
e0
12
34
56
78
90
359
530
222
68
2120
52
280
72
926
98
154
62
152
761
52
593
134
131
53
52
01
00
2377
4Tr
ansi
tion
Prob
abili
ty M
atrix
Per
cent
U
nrat
ed
01
23
45
67
89
90
00
00
00
00.
1428
571
0.85
7142
98
00
00
00
00.
0929
204
0.90
7079
64.
4965
561
70
00
00
0.00
7142
90.
0321
429
0.96
0714
37.
1073
786
00
00
00.
0129
870.
9870
1317
.294
858
11.6
0393
45
00
00
0.03
2786
90.
9672
131
53.0
2500
428
.898
792
40
00
01
20.7
9249
81.9
2379
63
00
01
#DIV
/0!
102.
7162
92
#DIV
/0!
#DIV
/0!
#DIV
/0!
#DIV
/0!
#DIV
/0!
1#D
IV/0
!#D
IV/0
!#D
IV/0
!
Tabl
e 5-
24: 2
009-
2010
Pre
stre
ssed
I B
eam
Tra
nsiti
on P
roba
bilit
y M
atri x
Figu
re 5
-24:
200
9-20
10 P
rest
ress
ed I
Bea
m D
eter
iora
tion
Cur
ve
Det
erio
ratio
n C
urve
412
29
0
0123456789
010
2030
4050
6070
Year
s
NBI Rating
36