prevailing wage report - ohio lsc · 2017-05-11 · prevailing wage laws, writes that prevailing...
TRANSCRIPT
Legislative Service Commission May 20, 2002
The Effects of theExemption of School
ConstructionProjects from Ohio’sPrevailing Wage Law
Staff Research Report No. 149
OHIO LEGISLATIVE SERVICE COMMISSION STATE HOUSE
COLUMBUS, OH 43215
SENATE MEMBERS HOUSE MEMBERS
Richard H. Finan Larry Householder Chairman Vice-Chairman
Gregory L. DiDonato Gary Cates
Randy Gardner Patricia Clancy
Bill Harris Dean DePiero
Leigh Herington Ray Miller
Jay Hottinger Jon M. Peterson
Doug White James P. Trakas
James W. Burley Director
RESEARCH STAFF
Allan Lundell, Ph.D., Senior Economist
This publication is a report of the research staff of the Legislative Service Commission required by Senate Bill 102 of the 122nd General Assembly. The report consists solely of information relating to the subject matter as prepared by the research staff. It does not purport to represent the findings and opinions of any member of the Legislative Service Commission. The Commission has taken no position in regard to the material contained in the report.
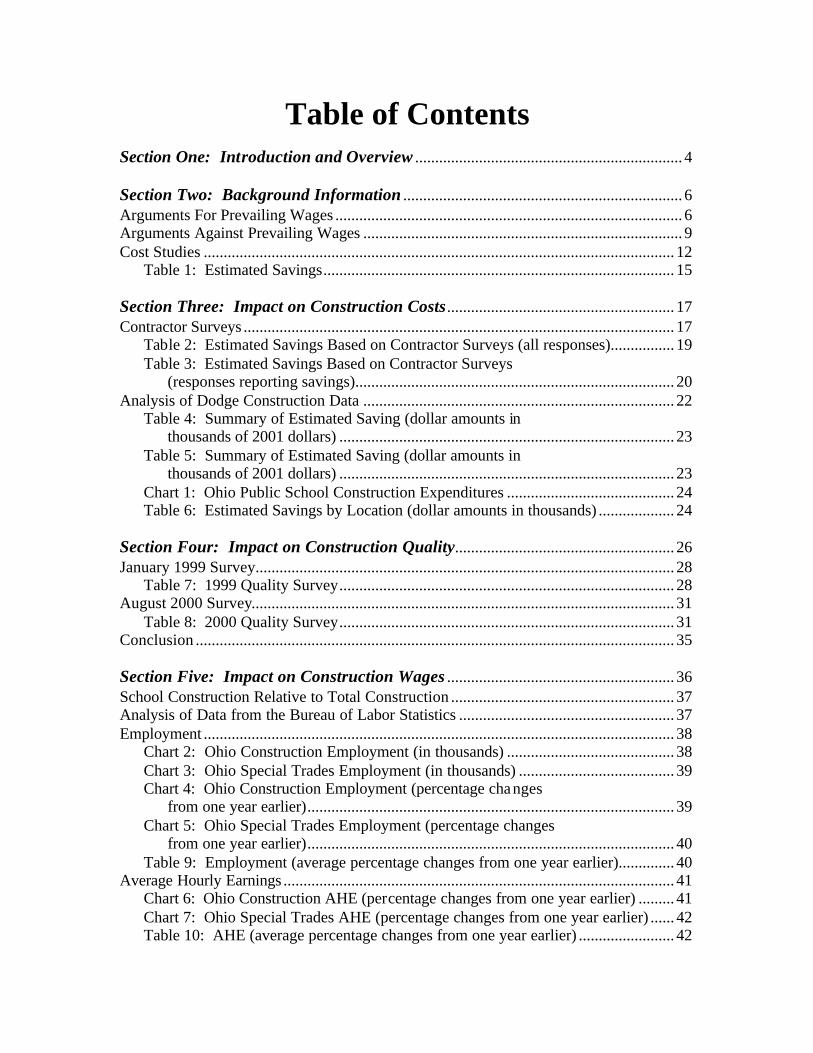
Table of Contents Section One: Introduction and Overview ................................................................... 4 Section Two: Background Information ...................................................................... 6 Arguments For Prevailing Wages ....................................................................................... 6 Arguments Against Prevailing Wages ................................................................................ 9 Cost Studies ...................................................................................................................... 12
Table 1: Estimated Savings........................................................................................ 15
Section Three: Impact on Construction Costs......................................................... 17 Contractor Surveys ............................................................................................................ 17
Table 2: Estimated Savings Based on Contractor Surveys (all responses)................ 19 Table 3: Estimated Savings Based on Contractor Surveys
(responses reporting savings)................................................................................ 20 Analysis of Dodge Construction Data .............................................................................. 22
Table 4: Summary of Estimated Saving (dollar amounts in thousands of 2001 dollars) .................................................................................... 23
Table 5: Summary of Estimated Saving (dollar amounts in thousands of 2001 dollars) .................................................................................... 23
Chart 1: Ohio Public School Construction Expenditures .......................................... 24 Table 6: Estimated Savings by Location (dollar amounts in thousands) ................... 24
Section Four: Impact on Construction Quality....................................................... 26 January 1999 Survey......................................................................................................... 28
Table 7: 1999 Quality Survey.................................................................................... 28 August 2000 Survey.......................................................................................................... 31
Table 8: 2000 Quality Survey.................................................................................... 31 Conclusion ........................................................................................................................ 35 Section Five: Impact on Construction Wages ......................................................... 36 School Construction Relative to Total Construction ........................................................ 37 Analysis of Data from the Bureau of Labor Statistics ...................................................... 37 Employment ...................................................................................................................... 38
Chart 2: Ohio Construction Employment (in thousands) .......................................... 38 Chart 3: Ohio Special Trades Employment (in thousands) ....................................... 39 Chart 4: Ohio Construction Employment (percentage changes
from one year earlier)............................................................................................ 39 Chart 5: Ohio Special Trades Employment (percentage changes
from one year earlier)............................................................................................ 40 Table 9: Employment (average percentage changes from one year earlier).............. 40
Average Hourly Earnings .................................................................................................. 41 Chart 6: Ohio Construction AHE (percentage changes from one year earlier) ......... 41 Chart 7: Ohio Special Trades AHE (percentage changes from one year earlier) ...... 42 Table 10: AHE (average percentage changes from one year earlier) ........................ 42
Legislative Service Commission Research Report -2-
Average Weekly Hours ..................................................................................................... 43 Chart 8: Ohio Construction AWH ............................................................................. 43 Chart 9: Ohio Special Trades AWH .......................................................................... 44 Table 11: AWH (averages) ........................................................................................ 44
Average Weekly Earnings ................................................................................................ 44 Chart 10: Ohio Construction AWE............................................................................ 45 Chart 11: Ohio Special Trades AWE......................................................................... 45 Table 12: Nominal AWE (average percentage changes from one year earlier) ........ 46 Table 13: Real AWE (average percentage changes from one year earlier)............... 46 Table 14: AWE (averages in December 2001 dollars) .............................................. 47
Conclusion ........................................................................................................................ 47 Section Six: Conclusion .............................................................................................. 49 Appendix 1: Case Study: Westlake City School District....................................... 50 Analysis of the Overall Project ......................................................................................... 50
Table 15: Overall Project ........................................................................................... 50 Table 16: General Trades ........................................................................................... 51 Table 17: HVAC ........................................................................................................ 51 Table 18: Plumbing.................................................................................................... 51 Table 19: Electrical.................................................................................................... 51
Analysis of Bidding Competition ..................................................................................... 52 Conclusions ....................................................................................................................... 52 Appendix 2: Regression Analysis of Dodge Construction Data ........................... 54
Table 20: New Construction - large projects ............................................................. 56 Table 21: New Construction - small projects ............................................................ 57 Table 22: Additions .................................................................................................... 57 Table 23: Alterations .................................................................................................. 58 Table 24: P-values for Regressions ............................................................................ 59 Table 25: 1-P-values for Regressions ........................................................................ 59
Appendix 3: Background Statistics on School Construction (based on data
from F.W. Dodge ..................................................................................................... 61 Table 26: General Contract Value by Project Type (dollars in millions) .................. 61 Table 27: General Contract Value by Project Type (shares of totals) ....................... 61 Table 28: General Contract Value by Location (dollars in millions) ........................ 62 Table 29: General Contract Value by Location (shares of totals).............................. 62 Table 30: General Contract Value Urban Projects by Type (dollars in millions) ..... 63 Table 31: General Contract Value Urban Projects by Type (shares of totals)........... 63 Table 32: General Contract Value Rural Projects by Type (dollars in millions)....... 64 Table 33: General Contract Value Rural Projects by Type (shares of totals)............ 64 Table 34: General Contract Value New Construction by Location
(dollars in millions) ............................................................................................... 65 Table 35: General Contract Value New Construction by Location
(shares of totals).................................................................................................... 65
Legislative Service Commission Research Report -3-
Table 36: General Contract Value Additions by Location (dollars in millions)........ 66 Table 37: General Contract Value Additions by Location (shares of totals)............. 66 Table 38: General Contract Value Alterations by Location (dollars in millions)...... 67 Table 39: General Contract Value Alterations by Location (shares of totals)........... 67
Appendix 4: Wage Data from the Current Population Survey............................. 68 Table 40: Hourly Pay Rate for All Construction Workers ........................................ 70 Table 41: Hourly Pay Rate for Union Workers ......................................................... 71 Table 42: Hourly Pay Rate for Non-Union Workers ................................................. 72 Table 43: Union Wage Premium ............................................................................... 73 Table 44: Number of Observations ............................................................................ 74
Appendix 5: An Example of an Omitted Variable Regression Analysis
Including SFC Funding ......................................................................................... 75 Table 45: Effect of Including SFC Variable .............................................................. 75 Table 46: Effect of Estimated Savings....................................................................... 76
Legislative Service Commission Research Report -4-
Section One
Introduction and Overview
Senate Bill 102 of the 122nd General Assembly created the Ohio School Facilities Commission, transferred responsibility for the Classroom Facilities Assistance program from the State Board of Education to the Commission, and exempted construction undertaken by school districts from Ohio's prevailing wage laws. Section 13 of Senate Bill 102 states that:
During the five-year period that begins on the effective date of this section, the Legislative Budget Office of the Legislative Service Commission shall monitor and study the effects of the prevailing wage exemption created by the amendment in Section 1 of this act to section 4114.04 of the Revised Code. In the study, the Legislative Budget Office shall evaluate the following:
(A) The amount of money saved by school districts and educational service centers due to the exemption;
(B) The impact of the exemption on the quality of public school building construction in this state;
(C) The impact of the exemption on the wages of construction employees working on the construction of public school buildings in this state;
(D) Other subjects as determined by the Legislative Budget Office.
Not later than five years after the effective date of this section, the Legislative Budget Office shall submit a report on its study to the Speaker and Minority Leader of the House of Representatives and the President and Minority Leader of the Senate.
The Legislative Service Commission (LSC) found indications of $487.9 million in aggregate school construction savings during the post-exemption period, an overall savings of 10.7 percent. Estimated savings on new construction projects was $24.6 million (1.2 percent). Estimated savings on school building additions was $408.0 million (19.9 percent). Estimated savings on school building alterations was $55.2 million (10.7 percent). Estimated savings in urban counties totaled $310.5 million while savings in rural counties totaled $177.4 million.
Legislative Service Commission Research Report -5-
While it may be reasonable to conclude that these savings are at least partially attributable to the prevailing wage exemption, the extent to which this is the case cannot confidently be stated.
LSC found indications that the exemption had little impact on the quality of public school building construction. Measuring quality is difficult due to the subjective nature of quality and the length of time it may take for quality differences to appear. Using one measure of quality, the satisfaction of users' needs, LSC surveyed school districts to determine the extent to which they were satisfied with the quality of public school building construction. The surveys indicate that the users of the buildings are generally satisfied with the buildings and provided no evidence that the exemption decreased the quality of school construction.
LSC found indications that the exemption had little impact on the wages of construction employees working on the construction of public school buildings. The search for an impact was complicated by a number of factors: (1) school construction accounts for a small percentage of construction activity, (2) most workers do not specialize in one category of project, such as school construction, but specialize in a craft or activity and move between types of projects that include that activity, and (3) demand for construction workers, particularly for school construction, has been high for most of the time since the exemption went into effect.
The remainder of the report is organized as follows. Section Two provides background information. Section Three covers the evaluation of the amount of money saved by school districts and educational service centers due to the exemption. Section Four covers the evaluation of the impact of the exemption on the quality of public school building construction. Section Five covers the evaluation of the impact of the exemption on the wages of construction employees working on the construction of public school buildings. Section Six summarizes the findings and discusses the limitations of the findings.
Legislative Service Commission Research Report -6-
Section Two
Background Information
The nation's first prevailing wage law was passed in Kansas in 1891. The federal prevailing wage law, the Davis-Bacon Act, was passed in 1931, the same year in which Ohio's prevailing wage law was enacted. These laws, and similar ones in other states, require that workers on government sponsored construction projects be paid "prevailing wages."
In Ohio, prevailing wages are based on collective bargaining agreements. Prevailing wages are union wages. If there is no collective bargaining agreement in the immediate locality in which construction is taking place, then the prevailing rates of wages in the nearest locality in which a collective bargaining agreement is in effect is used. In addition to wages being set by union collective bargaining agreements, contractors are subject to work rules (such as apprentice to skilled worker ratio) contained in the collective bargaining agreement used to determine the prevailing wage.
The stated intent of prevailing wage laws is to protect local wage rates in the construction industry. Many historians have argued that during the Great Depression, these wages needed protection from itinerant contractors using lower wage labor and from the monopsony (single buyer) power of governments. The continued need for these laws is subject to great debate.
Arguments For Prevailing Wages
Prevailing wage laws protect both the wages and jobs of local workers by preventing "wage dumping" by outside contractors. This was the original stated purpose of Davis-Bacon. Congressman Robert J. Bacon of New York, during House debate, referred to "certain itinerant, irresponsible contractors, with itinerant, cheap, bootleg labor."1 It was argued these contractors, and their workers, were successfully bidding on projects and denying local contractors and workers the opportunity to compete for projects. Thieblot, in his book on prevailing wage laws, writes that prevailing wage laws had the purpose of "protecting local wage scales from the consequences of competitive pressures on contractors to submit the low bid" and that this was a valid concern because 1 U.S. Department of Labor, Division of Wage Determinations, Office of the Solicitor, The Legislative History of the Davis-Bacon Act, p.1 quoted in John P. Gould and George Bittlingmayer, The Economics of the Davis-Bacon Act: An Analysis of Prevailing Wage Laws, American Enterprise Institute for Public Policy Research, Washington D.C., 1980.
Legislative Service Commission Research Report -7-
workers were willing to accept "almost any wage, thus driving down the already meager pay rates."2
Prevailing wage laws reduce total construction costs by encouraging the use of more qualified and productive (presumably union) workers. To the extent that worker skill is correlated with the wage the worker receives, lower wages will result in the use of less skilled workers. Less skilled workers may result in a lower quality product. Additionally, the cost of production may actually be greater because the less skilled workers may take longer to complete the job.
Union workers may be more expensive on a per-hour basis, but their greater productivity may result in a lower total cost. The higher wage mandated by a prevailing wage requirement induces contractors to hire only the best workers. Higher wages result in a superior work force. This superior work force is able to complete projects more quickly, resulting in a lower labor cost.
A 1979 study by Allen found that union workers were more productive than non-union workers and that their productivity advantage may be as great as 45 percent.3 The same study estimated that union wages were 43 percent higher than non-union wages. The productivity differential offsets the wage differential, according to this study, so using union labor resulted in lower cost.
Prevailing wage laws assure quality construction and reduce delays and overruns. This argument is also based on the assumption that union workers are more skilled and productive. Because of their greater skill, union workers are not only able to complete projects in less time, but they also require less supervision, and perform work of higher quality. If lower wages are paid and less skilled workers are used, the result will be "low quality, flawed work, and unnecessary accidents."4 Prevailing wage proponents also maintain that the higher quality workmanship also results in lower future maintenance and repair costs. Paying lower wages and using less skilled labor may result in "inferior construction requiring more repairs, revisions, and lengthy delays."5 A study in Utah after the
2 Armand Thieblot, Jr., Prevailing Wage Legislation, University of Pennsylvania Press, Philadelphia, 1986, p. 28.
3 Stephen G. Allen, "Unionized Construction Workers Are More Productive," Quarterly Journal of Economics, May 1984, p. 11.
4 "Prevailing Wage Laws," Position Paper, The Mechanical Electrical Sheet Metal Alliance, March 1995.
5 Ibid.
Legislative Service Commission Research Report -8-
repeal of its prevailing wage law found that "prevailing wage laws save taxpayers money by providing quality and efficiency for the construction dollar."6
Prevailing wage laws help maintain local tax bases. As the workers are paid and spend their higher wages, the amount of local taxes paid is larger than it would have been in the absence of the payment of prevailing wages. The "Utah study" claims that the state of Utah suffered millions of dollars in lost tax revenues when it repealed its prevailing wage law.7 That is, prevailing wage laws may help a locality's budget by increasing tax revenues and holding down costs.
Prevailing wage laws provide stability in the construction industry. Reducing wage-based competition may help maintain a degree of stability. Prevailing wage laws "take wage competition out of the contract bidding process" so that "competition is focused on management, quality, timeliness, and productivity." Because of prevailing wage laws the bidding process presumably accentuates "contractor efficiency, worker skill, and project quality." 8
The 1995 "Utah study" presented the following scenario of events following the 1981 repeal of Utah's prevailing wage law. Larger and more experienced union contractors saw their competitive edge reduced. The number of union contractors and the number of union construction workers decreased. As union strength decreased, non-union contractors appeared and began to compete for government contracts. These new non-union firms were smaller, weaker, and less experienced than the union firms they replaced. Competition in the construction industry increased, resulting in an "overheated bidding process." Because of the intensity of the competition, wages were driven down to below market levels.9
Prevailing wage laws also have been viewed as a way to promote stability in the construction industry by supporting union training programs. The study by Phillips, et. al., concluded "the repeal of prevailing wage laws had the effect of reducing training and retraining as well as directly hindering the formation of a skilled labor force."10 Dr. Bernard Anderson, Assistant Secretary of Labor for Employment Standards Administration, stated in Senate testimony that "without 6 Peter Phillips, Garth Mangum, Norm Waitzman, and Anne Yeagle, "Losing Ground: Lessons from the Repeal of Nine 'Little Davis-Bacon' Acts," University of Utah, February 1995.
7 Ibid.
8 The Mechanical Electrical Sheet Metal Alliance, op. cit.
9 Phillips, Mangum, Waitzman, and Yeagle, op. cit.
10 Ibid.
Legislative Service Commission Research Report -9-
the prevailing wage statutes, it may be significantly more difficult to maintain a sufficient pool of skilled construction workers."11
Arguments Against Prevailing Wages
Prevailing wage laws increase project costs. Fraundorf, Farrell, and Mason, in their study of the effect of the Davis-Bacon Act on construction costs in rural areas, concluded that "a project subject to the Act would cost on average 26.1% more than the same project not subject to the Act."12 Analyses in Florida, Iowa, Kentucky, Louisiana, Maryland, Minnesota, and New Hampshire, done in conjunction with the repeal or attempted repeal of the prevailing wage laws of those states, estimated that repeal would result in average expected construction savings of 9.4 percent.13 The General Accounting Office found that the Davis-Bacon Act increased construction costs by 3.4 percent.14
Prevailing wage laws impose unnecessary regulatory burdens and heavy paperwork requirements. Fraundorf, Farrell, and Mason note that a prevailing wage law may "raise costs through its effect on how workers are utilized."15 Prevailing wage laws will be especially troublesome for "non-union construction companies which do not follow traditional union craft lines in assigning work."16 These requirements may force contractors to either pay a high wage to an unskilled worker or pay a high wage to a skilled worker for menial work. Some contractors may not bid on a project subject to prevailing wage requirements because winning the contract would disrupt their normal practices and wage scales. Fraundorf, Farrell, and Mason note that "some contractors think that disruption and loss in morale result from raising wages for one project only. Consequently, they may not bid on public construction projects to which the
11 Dr. Bernard E. Anderson, Department of Labor, Employment Standards Administration, Testimony before the Labor and Human Resources Committee, U.S. Senate, February 15, 1995, referenced in The Mechanical Electrical Sheet Metal Alliance, op. cit.
12 Martha Norby Fraundorf, John P. Farrell, and Robert Mason, "The Effects of the Davis-Bacon Act on Construction Costs in Rural Areas," The Review of Economics and Statistics, 66 (Feb. 1983), pp. 142-146.
13 104th Congress, 1st Session, Senate Committee on Labor and Human Resources, Report 104-80, "Repeal of the Davis-Bacon Act," footnote 30, p. 7.
14 Ibid., p. 7.
15 Fraundorf, Farrell, and Mason, op. cit., p. 6.
16 Ibid., p. 6.
Legislative Service Commission Research Report -10-
prevailing wage laws apply."17 The decreased competition in bidding may result in higher construction costs.
Prevailing wage laws also may create additional administrative work for contractors. Contractors must create and file statements of compliance and payroll reports. General contractors must make sure that their subcontractors comply with prevailing wage requirements. According to testimony of contractors and their responses to surveys, the cost of this additional administrative work is significant. Some have maintained that the costs are significant enough to keep them from bidding on projects subject to prevailing wage requirements.
Prevailing wage laws reduce competition. Goldfarb and Metzger note that many arguments in support of prevailing wage laws "begin with the implicit or explicit premise that union construction workers need job protection."18 By requiring that contractors pay higher (usually union) wages and follow union work rules, union contractors are given an advantage in project bidding. As mentioned above, non-union contractors may choose to not bid on a project that is subject to prevailing wage requirements, reducing competition for union contractors.
Prevailing wage laws discriminate against minority and small contractors. By requiring the payment of higher wages than they normally pay, minority and small contractors may be discouraged from bidding on contracts. Any additional administrative costs that prevailing wage requirements may place on winning contractors may also act to keep smaller contractors from bidding on projects. Larger contractors may be able to more easily absorb the higher administrative costs than a smaller contractor.
Although supporters of prevailing wage laws state that union training and apprenticeship programs help minorities, a 1995 federal report on S. 141, a bill to repeal the Davis-Bacon Act, concluded that prevailing wage laws may reduce training opportunities and entry-level jobs. These laws reduce incentives to hire lower skilled workers. The requirement that contractors pay the union wage scale "creates a disincentive to hire entry-level workers and train them on-the-job."19
Prevailing wage laws hurt rural contractors and workers. Although prevailing wage laws were intended to protect local contractors from outside
17 Ibid., p. 18.
18 Robert S. Goldfarb and Michael Metzger, "Do Davis-Bacon Minimum Wages Raise Product Quality?" Journal of Labor Research, Summer 1988, p. 265.
19 104th Congress, 1st Session, Senate Committee on Labor and Human Resources, Report 104-80, op. cit., p. 9.
Legislative Service Commission Research Report -11-
competition, this is sometimes not the result, especially in rural areas. As wage rates are "imported" into a locality, contractors and workers may follow. 20 The report on S. 141 concludes that prevailing wage laws make it more likely that outside contractors will be successful in bidding.21 A GAO report was quoted, "the increased costs [due to Davis-Bacon] may have had the most adverse effect on local contractors and their workers--those the act was to protect--by promoting the use of nonlocal contractors on Federal projects. We [the GAO] found that nonlocal contractors worked on the majority of these projects, indicating that the higher rates may have discouraged local contractors from bidding."22 The GAO report found that local contractors often would not bid on projects because they did not want to disrupt their wage structures and worker classification practices. Similarly, Fraundorf, Farrell, and Mason found that, "There appears to be some validity to the charge that the way the Davis-Bacon Act as now administered puts local contractors at a disadvantage instead of insuring local firms and residents their share of jobs as the law apparently intended."23
Prevailing wage laws do not guarantee quality. Goldfarb and Metzger note that supporters of prevailing wage requirements use an improvement in quality as a counter to any increase in costs. However, "government financed construction is, in fact, subject to a great many standards and strictures. The argument that Davis-Bacon ought to be supported as a quality-raising device starts from the assumption that these standards are not completely successful (or could not at low cost be made completely successful) in achieving desired quality levels."24 The authors stated that "the 'construction quality' argument for the Davis-Bacon Act is seriously flawed, since quality may in fact fall because of Davis-Bacon coverage."25 Product quality may fall even though contractors use higher quality labor because they may, in an effort to offset higher wage costs, also use fewer units of this higher quality labor or substitute materials of lower quality. They conclude their paper by declaring that "any argument in favor of
20 Wage importing occurs when the wage scales or collective bargaining agreements of one locality are applied to another. This frequently happens in rural areas.
21 104th Congress, 1st Session, Senate Committee on Labor and Human Resources, Report 104-80, op. cit., p. 6.
22 U.S. General Accounting Office, "The Davis-Bacon Act Should Be Repealed," HRD79-18, April 27, 1979.
23 Fraundorf, Farrell, and Mason, op. cit., pp. 17-18.
24 Goldfarb and Metzger, op. cit., footnote 10, p. 272.
25 Ibid., p. 265.
Legislative Service Commission Research Report -12-
Davis-Bacon as a quality-assuring device should be treated with considerable skepticism."26 The Kentucky Legislative Research Commission notes that
There was substantial evidence that prevailing wage laws do increase the initial costs of construction. It is unclear, however, whether the requirements result in higher quality construction. To the extent that quality is increased, prevailing wages are an inefficient method to increase quality. The wage requirement results in contractors paying higher wages with no guarantee that the additional wages would result in quality improvements.27
Prevailing wage laws do not increase local tax bases. While it is true that increases in income within a jurisdiction (local, state, or national) generally lead to increases in tax revenues, it is also generally the case that the higher wages on government sponsored projects are being paid out of existing tax revenues.28 Opponents of prevailing wage laws argue that spending more of the jurisdiction's tax revenues for construction in order to maintain tax revenues may be viewed as a misallocation of revenue. This argument maintains that if the same product can be purchased for a lower cost, then spending more for that product is wasteful. The savings could be spent elsewhere and this spending would help maintain the jurisdiction's tax base. Prevailing wage opponents, for example, propose returning any government savings to the taxpayers to spend as they choose. This spending would also maintain the local tax base. The report on S. 141 concludes that the "goal of boosting local demand cannot justify paying artificially high Federal construction costs."29
Cost Studies
Thieblot (1975) took advantage of a one-month suspension of the Davis-Bacon Act in 1971 to study the potential costs of prevailing wage requirements.30 26 Ibid., p. 272.
27 Kentucky Legislative Research Commission, "An Analysis of Kentucky's Prevailing Wage Laws and Procedures," (Dec. 2001), p. ix.
28 In rural areas, spending may actually be done in other localities where the workers live. This is especially true if workers are "imported" from outside the locality. Any taxes will be collected by the locality in which the workers live and spend. The locality paying for the project may therefore "export" benefits to another locality.
29 104th Congress, 1st Session, Senate Committee on Labor and Human Resources, Report 104-80, op. cit., p. 16.
30 Armand J. Thieblot, The Davis-Bacon Act, Labor Relations and Public Policy Series, Report No. 10. Philadelphia: University of Pennsylvania Press 1975.
Legislative Service Commission Research Report -13-
Projects that were bid but not awarded were bid again without the prevailing wage requirement. Thieblot compared the bids with prevailing wages to the bids without prevailing wages and found that Davis-Bacon increased costs by less than one percent. Gould and Bittlingmayer (1980) re-evaluated Thieblot's analysis and adjusted the estimates to account for inflation and new information available to bidders.31 They found that Davis-Bacon increased costs by four to seven percent.
Other studies of the effect of prevailing wage laws on construction costs use regression analysis. Regression analysis estimates the relationship between one variable (the dependent variable) and one or more other variables (the independent or explanatory variables). The technique allows an analyst to estimate the effect that one independent variable has on the dependent variable while controlling for the effect of the other independent variables. Regression analysis is a powerful and useful technique, but its power and usefulness depends on assumptions made by the analyst employing the technique, whether these assumptions are satisfied, and the variables included in the analysis.
Construction costs are a function of many factors. The presence or absence of prevailing wage laws is just one of many factors that will influence the cost of a project. Many of the factors influencing cost are project specific. Projects differ in size and location. Projects of the same size may differ in specifications. Similar projects built at different times may face shortages or surpluses of labor or materials due to the state of the economy. Analysis of construction costs should take into account as many of the factors that influence construction costs as possible. Omitting relevant variables from a regression may statistically bias the estimates of the coefficients of the included variables. The bias may be positive or negative depending on the relationships between the included variables and the omitted variables. The papers described below and the LSC analysis described in the next chapter all suffer from omitted variables. When variables are not included in regression analysis it is usually because the data needed to include them are not available.
Fraundorf, Farrell, and Mason (1983) used regression analysis to estimate the effect of Davis-Bacon on construction costs in rural areas.32 The analysis compared public construction costs to private construction costs and included variables that influence costs. The authors found that Davis-Bacon increased costs 31 John P. Gould and George Bittlingmayer, The Economics of the Davis-Bacon Act: An Analysis of Prevailing Wage Laws, American Enterprise Institute for Public Policy Research, Washington D.C., 1980.
32 Martha Norby Fraundorf, John. P. Farrell, and Robert Mason, "The Effects of the Davis-Bacon Act on Construction Costs in Rural Areas," The Review of Economics and Statistics, 66 (Feb. 1983), pp. 142-146.
Legislative Service Commission Research Report -14-
by 26 percent. However, although the analysis included variables that influence costs, the authors noted that public projects and private projects are often held to different standards. Any higher standards set for public projects may increase the cost of public projects with or without a requirement to pay prevailing wages. To the extent that this may have happened, the study's estimated impact of Davis-Bacon would have been biased upward.
Prus (1996) used regression analysis and data from F.W. Dodge to estimate the effect of prevailing wage laws on construction costs.33, 34 The analysis included various types of public and private construction projects from 1990 through 1994. The analysis included the following variables that affect cost: project size, structure type, material type, number of stories, project type (new, alteration, addition), and the state in which the project was located. The author found that prevailing wage laws increase construction costs by five percent, but that the increase was not statistically significant.35
Prus (1999) used regression analysis and data from F.W. Dodge to estimate the effect of prevailing wage laws on new school construction costs in Delaware, Maryland, North Carolina, Virginia, and West Virginia.36 The analysis included the following variables that affect cost: project size, school type, material type, number of stories, and the state in which the project was located. The author found that prevailing wage laws increased school construction costs by 3.8 percent, but that the increase was not statistically significant.
Phillips (1999) used regression analysis and national data from F.W. Dodge to estimate the effect of prevailing wage laws on school construction projects (new construction, additions, and alterations).37 The analysis included the following variables that affect cost: project size, type of school, material type, number of
33 Mark J. Prus, "The Effect of State Prevailing Wage Laws on Total Construction Costs," (Jan. 1996).
34 F.W. Dodge, a part of the McGraw-Hill Construction Information Group, is a provider of project news, plans, specifications, and analysis services for construction professionals in the United States and Canada.
35 Statistical significance is concerned with the probability that a result would have occurred by chance if the assumptions are true. Results with low probabilities (usually less than five percent) are said to be statistically significant.
36 Mark J. Prus, "Prevailing Wage Laws and School Construction Costs: An Analysis of Public School Construction in Maryland and the Mid Atlantic States," (Jan. 1999).
37 Peter Phillips, "Kentucky's Prevailing Wage Law: Its History, Purpose, and Effect" (Oct. 1999).
Legislative Service Commission Research Report -15-
stories, project type (new, alteration, addition), unemployment rate, season, and the state in which the project was located. Although Phillips found that prevailing wage laws increase costs by 2.4 percent, the increase was not statistically significant.
Bilginsoy and Phillips (2000) used regression analysis to estimate the effect of prevailing wage laws on school construction costs in British Columbia.38 The analysis included the following variables that affect cost: school type, number of bidders, contractor size, district location, stage of construction cycle, and time. The authors found that prevailing wage laws did not have a statistically significant effect on construction costs.
Phillips (2001) used regression analysis and data from F.W. Dodge to estimate the effects of prevailing wage laws on the cost of new school construction in Ohio, Michigan, and Kentucky.39 The analysis included the following variables that affect cost: project size, location (urban/rural), season, and whether the project included a swimming pool. Phillips found that costs were increased by less than one percent, but that the increase was not statistically significant.
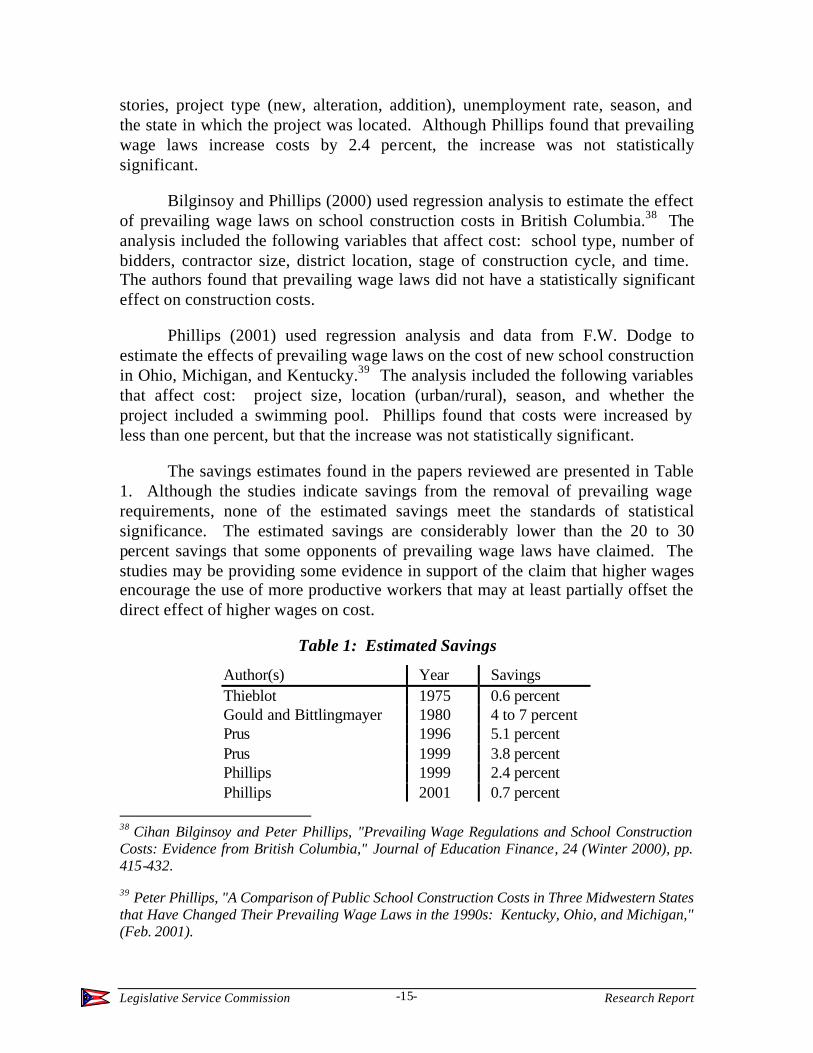
The savings estimates found in the papers reviewed are presented in Table 1. Although the studies indicate savings from the removal of prevailing wage requirements, none of the estimated savings meet the standards of statistical significance. The estimated savings are considerably lower than the 20 to 30 percent savings that some opponents of prevailing wage laws have claimed. The studies may be providing some evidence in support of the claim that higher wages encourage the use of more productive workers that may at least partially offset the direct effect of higher wages on cost.
Table 1: Estimated Savings
Author(s) Year Savings Thieblot 1975 0.6 percent Gould and Bittlingmayer 1980 4 to 7 percent Prus 1996 5.1 percent Prus 1999 3.8 percent Phillips 1999 2.4 percent Phillips 2001 0.7 percent
38 Cihan Bilginsoy and Peter Phillips, "Prevailing Wage Regulations and School Construction Costs: Evidence from British Columbia," Journal of Education Finance, 24 (Winter 2000), pp. 415-432.
39 Peter Phillips, "A Comparison of Public School Construction Costs in Three Midwestern States that Have Changed Their Prevailing Wage Laws in the 1990s: Kentucky, Ohio, and Michigan," (Feb. 2001).
Legislative Service Commission Research Report -16-
The Kentucky Legislative Research Commission's analysis of Kentucky's prevailing wage laws includes an excellent summary of the difficulty of estimating the effect of prevailing wage laws on construction costs.
Empirical estimates of the effects vary greatly, due largely to the difficulty in separating the effects of prevailing wage laws from other factors that affect construction costs. Ideally, to measure any cost effect from prevailing wage laws, it is necessary to compare the costs of projects under the prevailing wage law to the costs of the same exact projects in the absence of a prevailing wage law. Unfortunately, it is not possible to see what construction costs would be in the total absence of prevailing wage law. Therefore, several alternative methods have been developed over the years in an attempt to estimate the effects. Some studies compare construction costs in prevailing wage states to construction costs in non-prevailing wage states. Others compare the Davis-Bacon wages to other, more representative, measures of wages. These methods are discussed in a number of studies. There is little agreement between the studies as to whether prevailing wage laws increase costs, because a commonality in all of them is that there is always some technical issue that could substantially affect the results.40
40 Kentucky LRC Report, pp. 45-46.
Legislative Service Commission Research Report -17-
Section Three
Impact on Construction Costs
Senate Bill 102 of Ohio's 122nd General Assembly required an evaluation of the impact of the prevailing wage exemption on the amount of money saved by school districts and educational service centers. Testimony on and discussion of Senate Bill 102 indicated that the expected primary source of any potential savings would be reduced construction costs.
Proponents of prevailing wage laws maintain that these laws reduce total construction costs by encouraging the use of more qualified and productive (usually union) workers. Their reasoning is that these workers may be more expensive on a per-hour basis, but their greater productivity results in a lower total cost. Prevailing wage laws may induce contractors to hire only the best workers, potentially resulting in a superior work force that is able to complete projects more quickly and, possibly, at a lower labor cost. Even if initial construction costs were greater, prevailing wage proponents argue that the long-term costs would be lower due to the superior quality of construction.
Opponents of prevailing wage laws argue that these laws increase project costs by constraining the choices available to contractors and ultimately to the payer. Opponents also believe cost is increased by changing how workers are utilized. In addition, they believe cost may be increased by the effect the laws may have on labor distribution. For instance, non-union contractors may be faced with the choice of paying a high wage to an unskilled worker or paying a high wage to a skilled worker for menial work. Additionally, some contractors may choose to not bid on projects which could reduce competition and result in higher construction costs. Additional paper work may also add to the overall cost of a project.
Contractor Surveys
During testimony on Senate Bill 102, claims about the effect of the exemption on construction costs ranged from a possible 60 percent savings to unspecified increases in costs. Opponents of prevailing wage laws claimed significant savings would result from the exemption. Supporters of prevailing wage laws claimed low savings, no savings, or even increased costs. Supporters also claimed that if savings did result, they would prove to be short term because they would be offset by long term maintenance and repair costs that would result from the presumed lower quality of construction.
Legislative Service Commission Research Report -18-
LSC conducted an exploratory survey to obtain initial estimates of the effect of the exemption on construction costs. Every school district in the state was contacted and asked to have every contractor that bid on a project fill out a simple survey. Contractors were asked to provide the following information: school district name, project name, company name, trades involved with the project, bid price, and bid price had the project been bid with prevailing wages. The last piece of information was key to the survey. For union companies, providing the information was not a problem, both prices were the same. However, non-union companies were asked to assume that they were still subject to prevailing wage requirements and then recalculate their bids. The responses were their estimates of what would happen in a hypothetical situation.
The hypothetical bids must be used with caution. Non-union companies may have had an incentive to overstate the prevailing wage price in order to show greater savings. The hypothetical bids could also be in error if they did not take into account any behavioral changes in response to having to pay the prevailing wages. If having to pay the prevailing wages would induce a contractor to use a different combination of workers and hours, but the contractor simply substituted higher wages into the bid estimation equation in calculating the hypothetical bid, then the hypothetical bid could be too high or too low. Additionally, contractors may have bid differently due to factors such as the expected number and kind of bidders. It is possible that a responding firm would not have bid at all under prevailing wage requirements, but did in the absence of the requirements.
LSC hoped to receive responses from every contractor, both union and non-union, that bid on every school project. The responses from union companies could be used as a "check" on the prevailing wage based estimates of the non-union contractors. However, many school districts and companies instead chose to not participate in our exploratory survey. Despite the lack of participation, the received responses were analyzed. The results of the exploratory surveys were never intended to be interpreted as conclusive estimates of the effect of the exemption on construction costs, but rather to narrow the range of the possible savings that may result from the exemption.
Additionally, LSC hoped to use the exploratory survey to obtain data to confirm or contradict the results of the serendipitous "experiment" that occurred when the Westlake City School District required that contractors submit two bids: one subject to prevailing wage requirements and one exempt from prevailing wage requirements. Information for this one district provided an example of the bidding outcomes both under and exempt from prevailing wage requirements and the savings (at least at the time of bidding) that resulted from the exemption. This information is presented and discussed in the appendix, Case Study: Westlake City School District.
Legislative Service Commission Research Report -19-
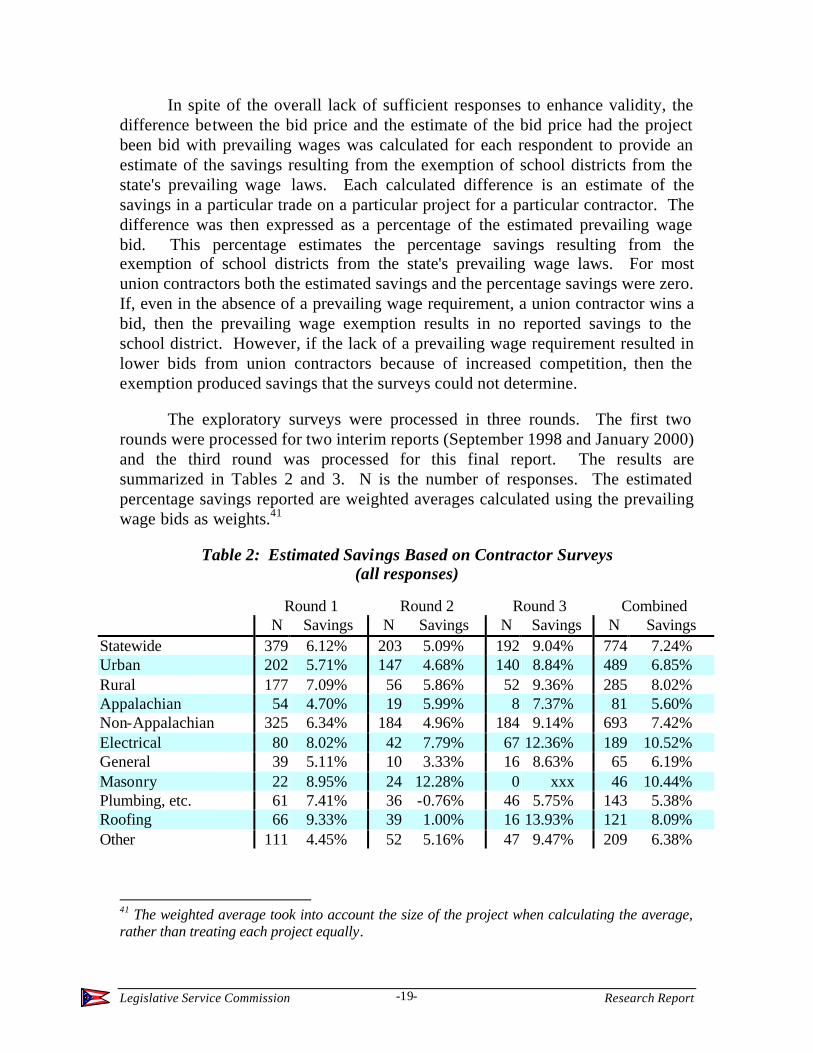
In spite of the overall lack of sufficient responses to enhance validity, the difference between the bid price and the estimate of the bid price had the project been bid with prevailing wages was calculated for each respondent to provide an estimate of the savings resulting from the exemption of school districts from the state's prevailing wage laws. Each calculated difference is an estimate of the savings in a particular trade on a particular project for a particular contractor. The difference was then expressed as a percentage of the estimated prevailing wage bid. This percentage estimates the percentage savings resulting from the exemption of school districts from the state's prevailing wage laws. For most union contractors both the estimated savings and the percentage savings were zero. If, even in the absence of a prevailing wage requirement, a union contractor wins a bid, then the prevailing wage exemption results in no reported savings to the school district. However, if the lack of a prevailing wage requirement resulted in lower bids from union contractors because of increased competition, then the exemption produced savings that the surveys could not determine.
The exploratory surveys were processed in three rounds. The first two rounds were processed for two interim reports (September 1998 and January 2000) and the third round was processed for this final report. The results are summarized in Tables 2 and 3. N is the number of responses. The estimated percentage savings reported are weighted averages calculated using the prevailing wage bids as weights.41
Table 2: Estimated Savings Based on Contractor Surveys (all responses)
Round 1 Round 2 Round 3 Combined N Savings N Savings N Savings N Savings Statewide 379 6.12% 203 5.09% 192 9.04% 774 7.24% Urban 202 5.71% 147 4.68% 140 8.84% 489 6.85% Rural 177 7.09% 56 5.86% 52 9.36% 285 8.02% Appalachian 54 4.70% 19 5.99% 8 7.37% 81 5.60% Non-Appalachian 325 6.34% 184 4.96% 184 9.14% 693 7.42% Electrical 80 8.02% 42 7.79% 67 12.36% 189 10.52% General 39 5.11% 10 3.33% 16 8.63% 65 6.19% Masonry 22 8.95% 24 12.28% 0 xxx 46 10.44% Plumbing, etc. 61 7.41% 36 -0.76% 46 5.75% 143 5.38% Roofing 66 9.33% 39 1.00% 16 13.93% 121 8.09% Other 111 4.45% 52 5.16% 47 9.47% 209 6.38%
41 The weighted average took into account the size of the project when calculating the average, rather than treating each project equally.
Legislative Service Commission Research Report -20-
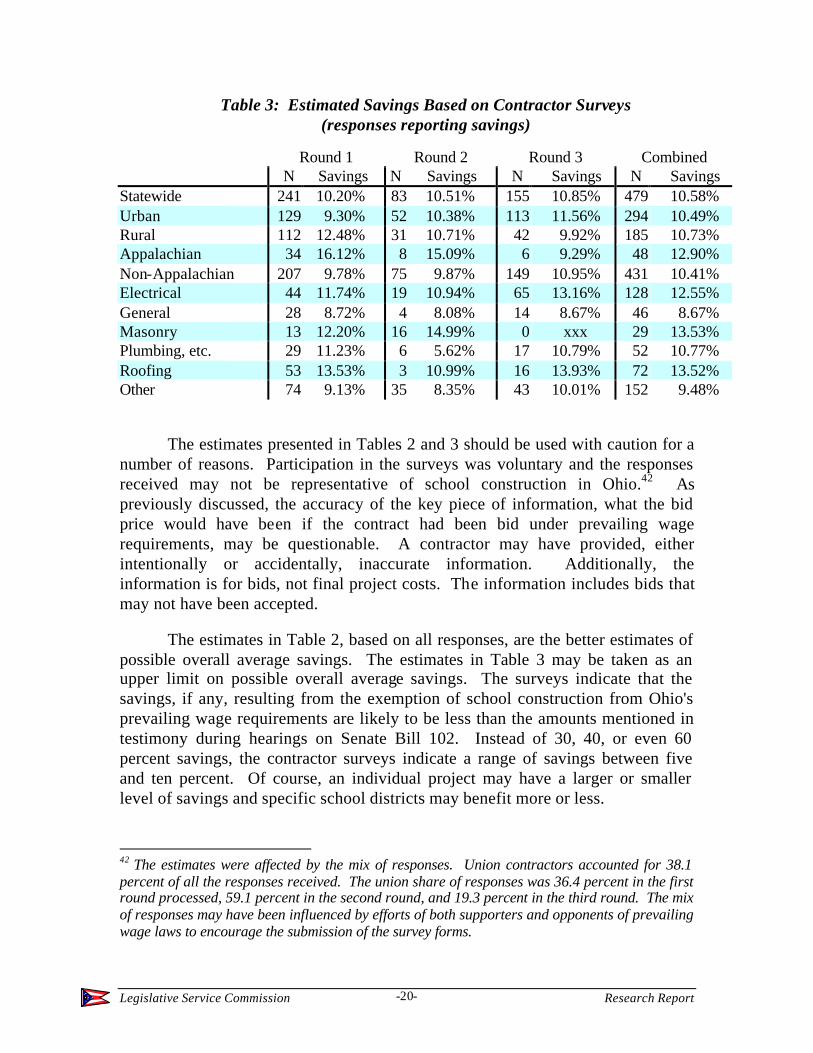
Table 3: Estimated Savings Based on Contractor Surveys (responses reporting savings)
Round 1 Round 2 Round 3 Combined N Savings N Savings N Savings N Savings Statewide 241 10.20% 83 10.51% 155 10.85% 479 10.58% Urban 129 9.30% 52 10.38% 113 11.56% 294 10.49% Rural 112 12.48% 31 10.71% 42 9.92% 185 10.73% Appalachian 34 16.12% 8 15.09% 6 9.29% 48 12.90% Non-Appalachian 207 9.78% 75 9.87% 149 10.95% 431 10.41% Electrical 44 11.74% 19 10.94% 65 13.16% 128 12.55% General 28 8.72% 4 8.08% 14 8.67% 46 8.67% Masonry 13 12.20% 16 14.99% 0 xxx 29 13.53% Plumbing, etc. 29 11.23% 6 5.62% 17 10.79% 52 10.77% Roofing 53 13.53% 3 10.99% 16 13.93% 72 13.52% Other 74 9.13% 35 8.35% 43 10.01% 152 9.48%
The estimates presented in Tables 2 and 3 should be used with caution for a number of reasons. Participation in the surveys was voluntary and the responses received may not be representative of school construction in Ohio.42 As previously discussed, the accuracy of the key piece of information, what the bid price would have been if the contract had been bid under prevailing wage requirements, may be questionable. A contractor may have provided, either intentionally or accidentally, inaccurate information. Additionally, the information is for bids, not final project costs. The information includes bids that may not have been accepted.
The estimates in Table 2, based on all responses, are the better estimates of possible overall average savings. The estimates in Table 3 may be taken as an upper limit on possible overall average savings. The surveys indicate that the savings, if any, resulting from the exemption of school construction from Ohio's prevailing wage requirements are likely to be less than the amounts mentioned in testimony during hearings on Senate Bill 102. Instead of 30, 40, or even 60 percent savings, the contractor surveys indicate a range of savings between five and ten percent. Of course, an individual project may have a larger or smaller level of savings and specific school districts may benefit more or less.
42 The estimates were affected by the mix of responses. Union contractors accounted for 38.1 percent of all the responses received. The union share of responses was 36.4 percent in the first round processed, 59.1 percent in the second round, and 19.3 percent in the third round. The mix of responses may have been influenced by efforts of both supporters and opponents of prevailing wage laws to encourage the submission of the survey forms.
Legislative Service Commission Research Report -21-
Responses were grouped according to whether the district is located in an urban or rural county. The rural counties include all counties that are not in a metropolitan statistical area (MSA) plus the following counties that are in a MSA but are more rural in nature: Ashtabula, Auglaize, Brown, Carroll, Columbiana, Fulton, Jefferson, Lawrence, and Washington. Under this criterion, 30 counties were classified as urban.43 Estimated savings were slightly higher in rural counties than in urban counties. This is consistent with other studies of prevailing wage that found greater savings in rural areas than in urban areas. One reason for this is that under prevailing wage laws, wages from urban areas are often "imported" into rural areas. Urban wages tend to be higher than rural wages, so when the prevailing wage requirement is removed, lower rural wages may be used, resulting in savings. Some school districts commented on being able to use lower wage local labor since they no longer had to require the payment of prevailing wages. The estimated savings difference has gotten smaller over time. This may be due to the mix of responses or due to changes in the overall economy. A second grouping of counties into Appalachian and non-Appalachian yielded no consistent pattern of savings differences.44 Again, this may be due to the mix of responses received or changes in the overall economy. Even within the groupings, an individual project may have a larger or smaller level of savings and specific school districts may benefit more or less.
Conclusions: Possible savings due to the exemption of school construction from Ohio's prevailing wage law are likely to be less than the levels mentioned during testimony on Senate Bill 102. The contractor surveys, which are suggestive but not conclusive, indicate that average savings are more likely to range between five and ten percent instead of between 30 and 60 percent. Not all districts will experience savings. A district may have chosen to continue to require the payment of prevailing wages. A project may be in an area where the labor market has essentially equalized union and non-union wages. Even where there are savings, districts cannot all expect to achieve the average rate of savings. Some districts will enjoy greater than average savings and others will experience below average rates of savings.
43 The counties classified as "urban" are: Allen, Belmont, Butler, Clark, Clermont, Crawford, Cuyahoga, Delaware, Fairfield, Franklin, Geauga, Greene, Hamilton, Lake, Licking, Lorain, Lucas, Madison, Mahoning, Medina, Miami, Montgomery, Pickaway, Portage, Richland, Stark, Summit, Trumbull, Warren, and Wood.
44 The counties classified as Appalachian are: Adams, Athens, Belmont, Brown, Carroll, Clermont, Columbiana, Coshocton, Gallia, Guernsey, Harrison, Highland, Hocking, Holmes, Jackson, Jefferson, Lawrence, Meigs, Monroe, Morgan, Muskingum, Noble, Perry, Pike, Ross, Scioto, Tuscarawas, Vinton, and Washington.
Legislative Service Commission Research Report -22-
The answer to the question, "How much can a district expect to save because of the prevailing wage exemption?" is "It depends." It depends on the district's policies. It depends on where the district is located. It depends on the state of the construction and labor markets in which the district operates.
Analysis of Dodge Construction Data
School construction was exempted from Ohio's prevailing wage requirements on August 19, 1997. In an effort to compare the costs of school construction before the exemption with the cost of construction after the exemption, LSC obtained data on school construction activity from F.W. Dodge.45 The data was used to estimate the cost of construction with and without a prevailing wage requirement. Any difference between the estimated costs may be interpreted as an estimate of cost savings. Details on the methodology employed in obtaining the estimates are provided in an appendix.
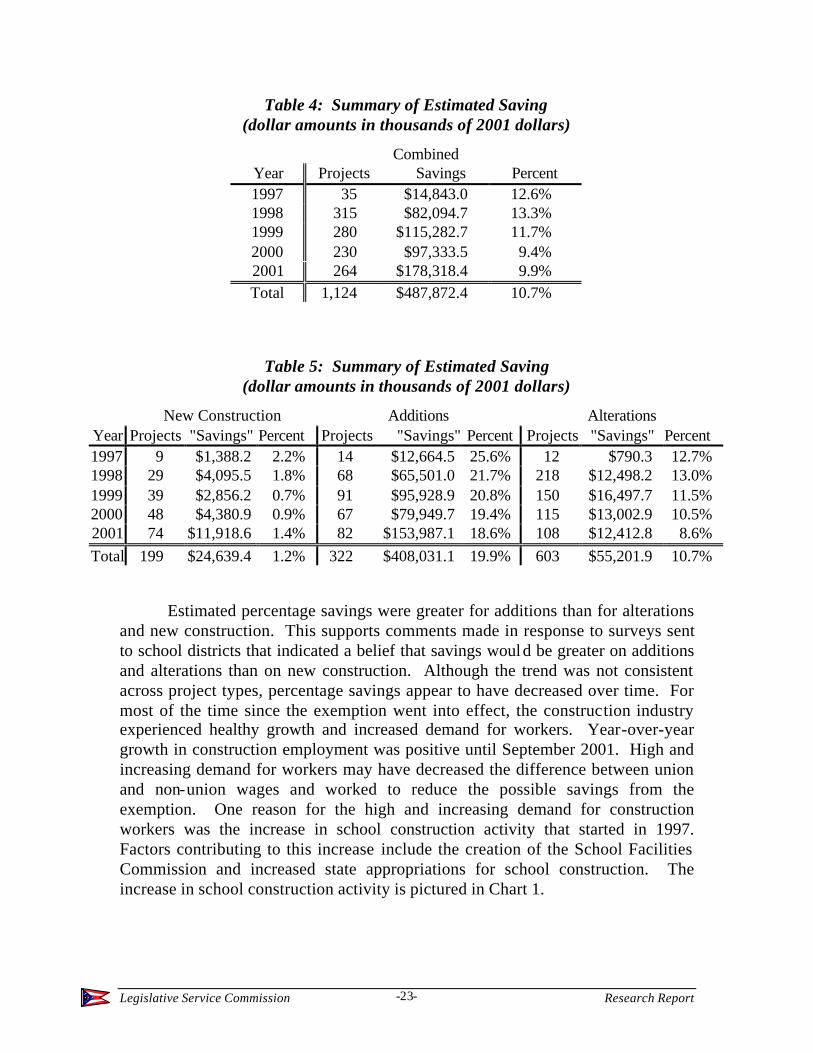
The analysis yielded estimated aggregate savings of $487.9 million. Additions accounted for 84 percent of the estimated savings, alterations accounted for 11 percent, and new construction accounted for the remaining five percent. A distribution of estimated savings by county indicates that 36 percent of the savings occurred on projects located in rural counties and 64 percent occurred on projects located in urban counties.
The estimated aggregate savings are summarized in Table 4 and broken down according to project type in Table 5. Savings percent is defined as the estimated dollars savings compared to the estimated cost under prevailing wage requirements.
45 F.W. Dodge, a part of the McGraw-Hill Construction Information Group, is the largest provider of project news, plans, specifications, and analysis services for construction professionals in the United States and Canada.
F.W. Dodge collects data for private and public construction projects. The data measures the value of contracts awarded to private firms and do not include expenditures for land, acquired buildings, or architect and engineering design activities.
Legislative Service Commission Research Report -23-
Table 4: Summary of Estimated Saving (dollar amounts in thousands of 2001 dollars)
Combined Year Projects Savings Percent 1997 35 $14,843.0 12.6% 1998 315 $82,094.7 13.3% 1999 280 $115,282.7 11.7% 2000 230 $97,333.5 9.4% 2001 264 $178,318.4 9.9% Total 1,124 $487,872.4 10.7%
Table 5: Summary of Estimated Saving (dollar amounts in thousands of 2001 dollars)
New Construction Additions Alterations Year Projects "Savings" Percent Projects "Savings" Percent Projects "Savings" Percent 1997 9 $1,388.2 2.2% 14 $12,664.5 25.6% 12 $790.3 12.7% 1998 29 $4,095.5 1.8% 68 $65,501.0 21.7% 218 $12,498.2 13.0% 1999 39 $2,856.2 0.7% 91 $95,928.9 20.8% 150 $16,497.7 11.5% 2000 48 $4,380.9 0.9% 67 $79,949.7 19.4% 115 $13,002.9 10.5% 2001 74 $11,918.6 1.4% 82 $153,987.1 18.6% 108 $12,412.8 8.6% Total 199 $24,639.4 1.2% 322 $408,031.1 19.9% 603 $55,201.9 10.7%
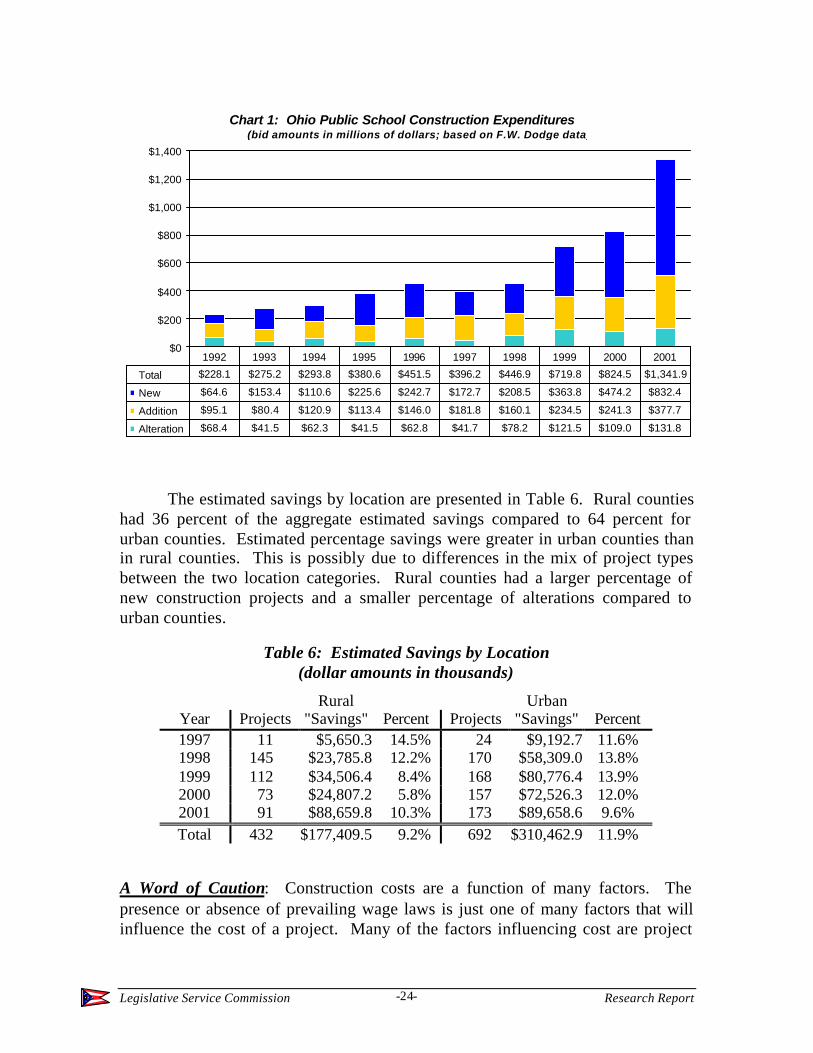
Estimated percentage savings were greater for additions than for alterations and new construction. This supports comments made in response to surveys sent to school districts that indicated a belief that savings would be greater on additions and alterations than on new construction. Although the trend was not consistent across project types, percentage savings appear to have decreased over time. For most of the time since the exemption went into effect, the construction industry experienced healthy growth and increased demand for workers. Year-over-year growth in construction employment was positive until September 2001. High and increasing demand for workers may have decreased the difference between union and non-union wages and worked to reduce the possible savings from the exemption. One reason for the high and increasing demand for construction workers was the increase in school construction activity that started in 1997. Factors contributing to this increase include the creation of the School Facilities Commission and increased state appropriations for school construction. The increase in school construction activity is pictured in Chart 1.
Legislative Service Commission Research Report -24-
Chart 1: Ohio Public School Construction Expenditures(bid amounts in millions of dollars; based on F.W. Dodge data)
$0
$200
$400
$600
$800
$1,000
$1,200
$1,400
Total $228.1 $275.2 $293.8 $380.6 $451.5 $396.2 $446.9 $719.8 $824.5 $1,341.9
New $64.6 $153.4 $110.6 $225.6 $242.7 $172.7 $208.5 $363.8 $474.2 $832.4
Addition $95.1 $80.4 $120.9 $113.4 $146.0 $181.8 $160.1 $234.5 $241.3 $377.7
Alteration $68.4 $41.5 $62.3 $41.5 $62.8 $41.7 $78.2 $121.5 $109.0 $131.8
1992 1993 1994 1995 1996 1997 1998 1999 2000 2001
The estimated savings by location are presented in Table 6. Rural counties had 36 percent of the aggregate estimated savings compared to 64 percent for urban counties. Estimated percentage savings were greater in urban counties than in rural counties. This is possibly due to differences in the mix of project types between the two location categories. Rural counties had a larger percentage of new construction projects and a smaller percentage of alterations compared to urban counties.
Table 6: Estimated Savings by Location (dollar amounts in thousands)
Rural Urban Year Projects "Savings" Percent Projects "Savings" Percent 1997 11 $5,650.3 14.5% 24 $9,192.7 11.6% 1998 145 $23,785.8 12.2% 170 $58,309.0 13.8% 1999 112 $34,506.4 8.4% 168 $80,776.4 13.9% 2000 73 $24,807.2 5.8% 157 $72,526.3 12.0% 2001 91 $88,659.8 10.3% 173 $89,658.6 9.6% Total 432 $177,409.5 9.2% 692 $310,462.9 11.9%
A Word of Caution: Construction costs are a function of many factors. The presence or absence of prevailing wage laws is just one of many factors that will influence the cost of a project. Many of the factors influencing cost are project
Legislative Service Commission Research Report -25-
specific. Projects differ in size and location. Projects of the same size may differ in specifications. Similar projects built at different times may face shortages or surpluses of labor or materials due to the state of the economy. Analysis of construction costs should take into account as many of the factors that influence construction costs as possible. The above analysis included the factors available, but was not able to include all the factors that may influence construction costs. For example, LSC was unable to obtain information regarding the division of cost between labor and materials. Omitting relevant variables from regression analysis may statistically bias the estimates of the coefficients of the included variables. The bias may be positive or negative depending on the relationships between the included variables and the omitted variables. Any effects on the estimated coefficients will affect any calculations that make use of the coefficients.46
The results reported are for the specific exemption of school construction in the Ohio economy between 1997 and 2001. The effect of an expanded exemption in a different economic environment may not necessarily be the same.
46 In one estimation attempt, LSC included a dummy variable to indicate funding by the Ohio School Facilities Commission. This attempt is described in Appendix 3.
Legislative Service Commission Research Report -26-
Section Four
Impact on Construction Quality
Senate Bill 102 required an evaluation of the impact of the prevailing wage exemption on the quality of school building construction in Ohio. Proponents of prevailing wage laws assert that the laws assure quality construction by encouraging the use of more qualified and productive workers. Opponents of prevailing wage laws assert that contractors may substitute lower quality or prefabricated materials to offset the cost of high priced labor and that wage savings due to the repeal of prevailing wage laws may allow school districts to afford higher quality materials or build larger facilities for the same cost. Opponents also argue that higher wages may not be an indication of higher quality or more skilled workers. Union wages may be higher than non-union wages due to productivity differences, union market power, or a combination of the two. Prevailing wage laws may not necessarily assure that higher quality workers are hired. The Kentucky Legislative Research Commission found instances of the same workers being paid more on prevailing wage projects than on private projects. If these workers did the same quality of work on each type of project, then the payment of prevailing wages potentially increased costs without improving quality. The Kentucky Legislative Research Commission noted that prevailing wage laws ensure that "higher wages are paid, but do not ensure an associated improvement in quality or productivity."47
Although a bit dated, "Maryland's Prevailing Wage Law: A Study of Costs and Effects," released by the Maryland Department of Fiscal Services in January 1989, contains a good commentary on the issue of quality of construction.
To determine whether prevailing wages encourage higher quality construction, industry quality indicators were sought through discussions with building and contractor organizations, union affiliates, and state personnel. No quantitative measures of quality could be found to compare state projects subject to prevailing wages with those exempted under current regulations. The use of contractor "call-backs," corrective actions needed after building completion, was examined as a possible measure. However, agency, contractor, and labor representatives stated that many call-backs result from design flaws and thus could not be attributed to contractor error.
47 Kentucky Legislative Research Commission, op. cit., p. 65.
Legislative Service Commission Research Report -27-
Absent any numerical indicators of quality, those interviewed were asked whether prevailing wage policies influenced quality. Results were mixed. The labor affiliates generally believed that prevailing wages did encourage higher quality, while some contractors dismissed any qualitative difference between prevailing and non-prevailing wage projects. Union representatives indicated that their sponsorship of formal apprenticeship programs, funded in part through employer benefit contributions, provided a much better trained and productive work force. Some contractors, even some non-union contractors, indicated that union labor was generally superior to non-union workers.48
The Building Research Board,49 in its report Inspection and Other Strategies for Assuring Quality in Government Construction, noted that "quality is a value-laden term that depends on one's point of view" and defined a quality building as one "whose characteristics create an environment where the occupant or user can accomplish his purpose effectively, efficiently, and comfortably."50 Quality was defined as "conformance to adequately developed requirements" and the "satisfaction of users' needs" was described as "the ultimate measure of quality."51
LSC adopted the Building Research Board's concept of measuring quality and conducted two surveys in which school districts were asked about the quality of school construction before and after the exemption of school construction from Ohio's prevailing wage laws. The responses to the surveys provide an indication of the extent to which the users' (school districts') needs were satisfied. The surveys are subjective assessments. They may be measuring quality or they may be measuring the responders' preconceived opinions on prevailing wage. In the survey responses, quality is in the "eye of the beholder" and what is in the eye of a beholder may be what is in the mind of the beholder. The survey responses may
48 Maryland Department of Fiscal Services, "Maryland's Prevailing Wage Law: A Study of Costs and Effects," (January 1989).
49 The Building Research Board of the National Research Council of the National Academy of Sciences provides technical assistance to the U.S. government on building technology, private sector competitiveness, and building design.
50 Building Research Board, "Inspection and Other Strategies for Assuring Quality in Government Construction," National Academy Press, Washington D.C., 1991, pp. 7-8.
51 Ibid., p. 43.
Legislative Service Commission Research Report -28-
be reflecting a district's satisfaction with having a new school building, particularly if it replaces a dilapidated old building.
Quality is a subjective concept and differences in quality may not become apparent without the passage of a sufficient amount of time. Estimates of the effect of the prevailing wage exemption on the quality of public school building construction are difficult, if not impossible to make. This is especially true for small variations in quality, which may not show up in the surveys. However, if a quality difference is serious, significant, and large, then it may be detected on satisfaction surveys like the ones LSC conducted.
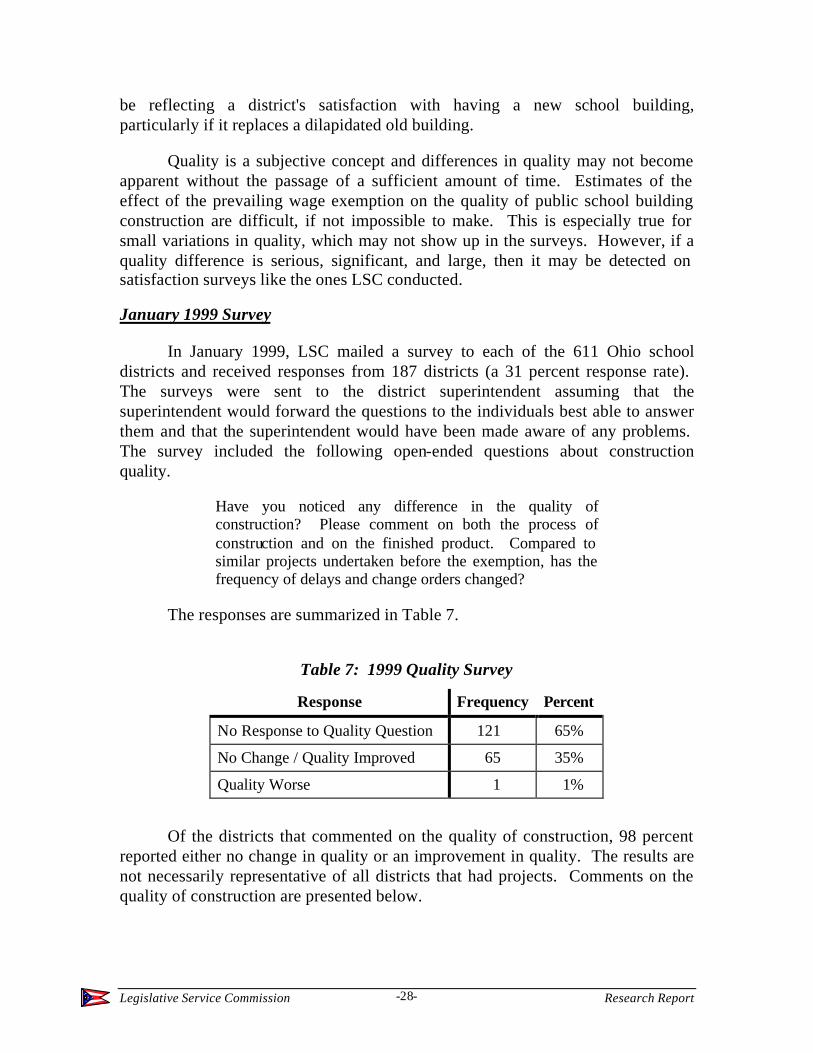
January 1999 Survey
In January 1999, LSC mailed a survey to each of the 611 Ohio school districts and received responses from 187 districts (a 31 percent response rate). The surveys were sent to the district superintendent assuming that the superintendent would forward the questions to the individuals best able to answer them and that the superintendent would have been made aware of any problems. The survey included the following open-ended questions about construction quality.
Have you noticed any difference in the quality of construction? Please comment on both the process of construction and on the finished product. Compared to similar projects undertaken before the exemption, has the frequency of delays and change orders changed?
The responses are summarized in Table 7.
Table 7: 1999 Quality Survey
Response Frequency Percent
No Response to Quality Question 121 65%
No Change / Quality Improved 65 35%
Quality Worse 1 1%
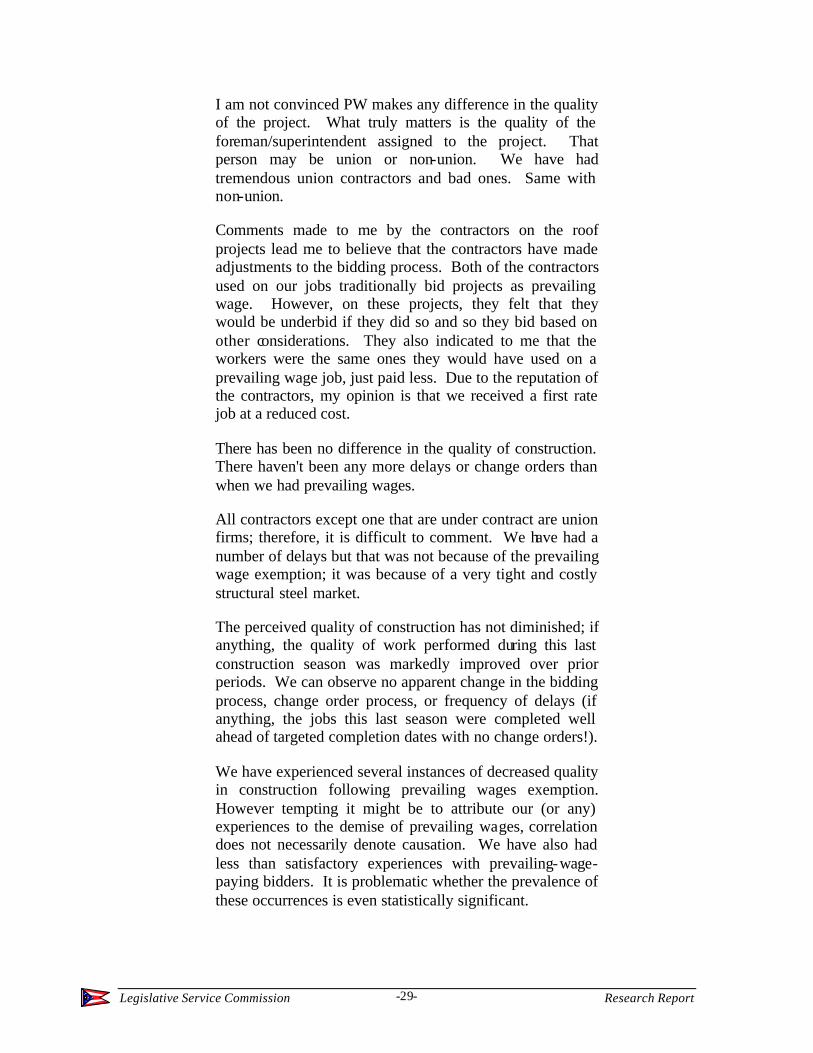
Of the districts that commented on the quality of construction, 98 percent reported either no change in quality or an improvement in quality. The results are not necessarily representative of all districts that had projects. Comments on the quality of construction are presented below.
Legislative Service Commission Research Report -29-
I am not convinced PW makes any difference in the quality of the project. What truly matters is the quality of the foreman/superintendent assigned to the project. That person may be union or non-union. We have had tremendous union contractors and bad ones. Same with non-union.
Comments made to me by the contractors on the roof projects lead me to believe that the contractors have made adjustments to the bidding process. Both of the contractors used on our jobs traditionally bid projects as prevailing wage. However, on these projects, they felt that they would be underbid if they did so and so they bid based on other considerations. They also indicated to me that the workers were the same ones they would have used on a prevailing wage job, just paid less. Due to the reputation of the contractors, my opinion is that we received a first rate job at a reduced cost.
There has been no difference in the quality of construction. There haven't been any more delays or change orders than when we had prevailing wages.
All contractors except one that are under contract are union firms; therefore, it is difficult to comment. We have had a number of delays but that was not because of the prevailing wage exemption; it was because of a very tight and costly structural steel market.
The perceived quality of construction has not diminished; if anything, the quality of work performed during this last construction season was markedly improved over prior periods. We can observe no apparent change in the bidding process, change order process, or frequency of delays (if anything, the jobs this last season were completed well ahead of targeted completion dates with no change orders!).
We have experienced several instances of decreased quality in construction following prevailing wages exemption. However tempting it might be to attribute our (or any) experiences to the demise of prevailing wages, correlation does not necessarily denote causation. We have also had less than satisfactory experiences with prevailing-wage-paying bidders. It is problematic whether the prevalence of these occurrences is even statistically significant.
Legislative Service Commission Research Report -30-
At this time I can't say the quality is any different since the completed projects used the same contractor just applying the prevailing wage rate. One contractor (drop ceilings) commented that having to pay prevailing wage created some tension within his organization since employees assigned to our project were paid at a higher rate than others within the company who worked other projects of the same nature, but were paid at the lower rate.
The quality has been good. The project is not completed. All change orders were initiated by us not the contractor. The delays have been weather and the ability of the contractor to attract laborers.
There has been no change in the quality of construction. Overall, the quality of construction on all these projects has been particularly good whether prevailing wages were required or not.
Compared to earlier projects when prevailing wage was required, I see no difference in the quality of work or time involved.
I cannot answer this question at this time. Quality is usually discovered after a period of time. It takes a while before shoddy work and poor quality work begins to show.
We have been very pleased with the quality of construction and the timely progress being made by the contractors at this time. We were able to open the junior high school on time this fall and anticipate opening the new elementary on time this fall. We have had no delays and the change orders have been reasonable in quantity and subject.
In most cases, the contractors have been the same as we have had in the past and the quality of work has not changed.
No, we have not noticed much difference in the process of construction or on the finished product. We have noticed a bit more willingness to work with us regarding changes.
No, the quality of construction and the finished product remain the same as projects done prior to the exemption taking effect. I believe this is a function of how well the specifications are written, the reputation of the company doing the work, the quality of the product used, and the amount of supervision of the project by the owner and the
Legislative Service Commission Research Report -31-
architect. We have seen no change order increase nor additional delays with projects after the exemption went into effect. Specifications on all projects included a completion date.
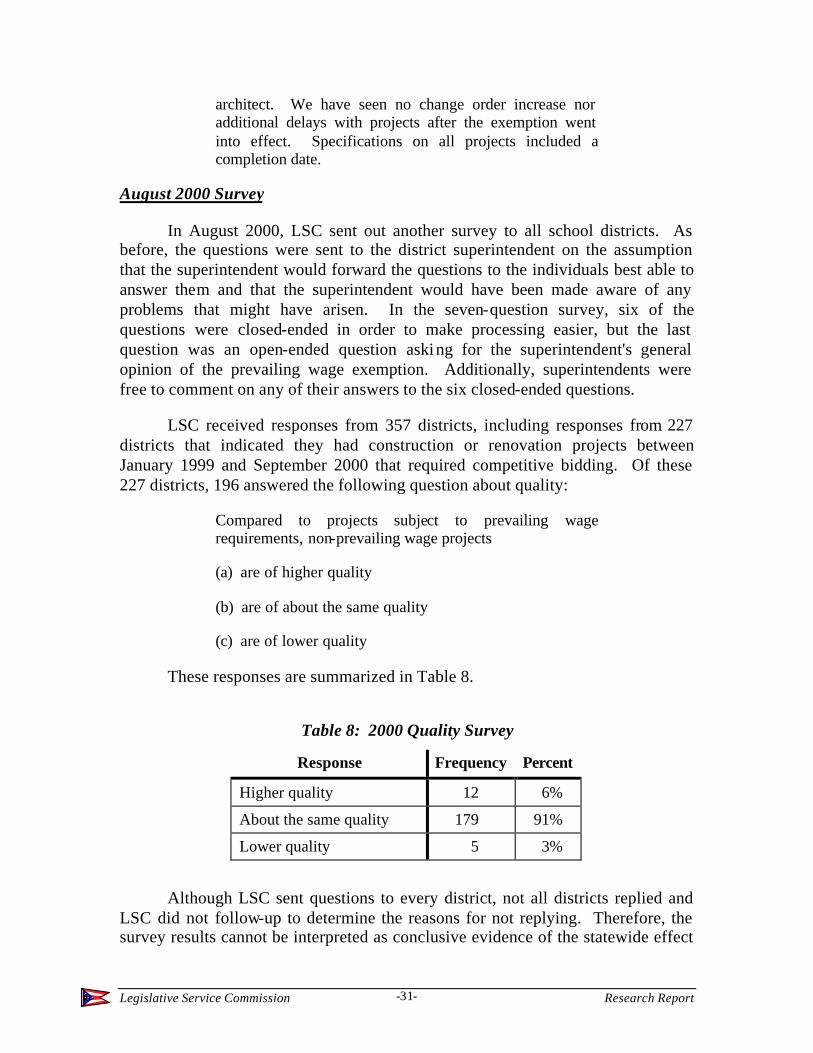
August 2000 Survey
In August 2000, LSC sent out another survey to all school districts. As before, the questions were sent to the district superintendent on the assumption that the superintendent would forward the questions to the individuals best able to answer them and that the superintendent would have been made aware of any problems that might have arisen. In the seven-question survey, six of the questions were closed-ended in order to make processing easier, but the last question was an open-ended question asking for the superintendent's general opinion of the prevailing wage exemption. Additionally, superintendents were free to comment on any of their answers to the six closed-ended questions.
LSC received responses from 357 districts, including responses from 227 districts that indicated they had construction or renovation projects between January 1999 and September 2000 that required competitive bidding. Of these 227 districts, 196 answered the following question about quality:
Compared to projects subject to prevailing wage requirements, non-prevailing wage projects
(a) are of higher quality
(b) are of about the same quality
(c) are of lower quality
These responses are summarized in Table 8.
Table 8: 2000 Quality Survey
Response Frequency Percent
Higher quality 12 6%
About the same quality 179 91%
Lower quality 5 3%
Although LSC sent questions to every district, not all districts replied and LSC did not follow-up to determine the reasons for not replying. Therefore, the survey results cannot be interpreted as conclusive evidence of the statewide effect
Legislative Service Commission Research Report -32-
of the prevailing wage exemption on the quality of school construction in Ohio. Based on the responses received, most (but not all) school districts, the ultimate users of the finished construction product, do not appear to have major concerns about the quality of construction. The comments that mentioned the quality of construction are presented below.
I think we should make every effort to reduce construction costs to school districts. As long as we don't give up quality and safety, we should continue.
Little impact on $'s and/or quality.
Has it reduced cost to schools? Has it improved quality/workmanship?
I like the exemption. It lowers the cost of renovations and I haven't experienced any decrease in quality.
Getting rid of the prevailing wage is one of the smarter things Ohio has done. The quality of work is as good. We have the same contractor bidding on our jobs. The amount of paperwork was ridiculous as well as the responsibility that went with it. Prevailing wage just artificially inflated the price. The market should decide wages--not the government. Prevailing wage kept a lot of good quality small companies out of the market. Don't bring prevailing wage back. It's a waste of taxpayer money.
We are doing 2 H. B. 264 energy conservation projects that allow us to secure contractors without going thru competitive bidding. Even with that, we are getting at least 3 quotes on the jobs to be done. We are still getting quality work done at competitive prices.
I support it. Need to save money anytime we can if we aren't compromising quality.
It is like many other decisions, it is a balance of what is good for everyone vs. good for a small group. The public benefits from the exemption but the laborer's quality of life is diminished. I would rather see the laborer make a fair wage. I am also not sure the quality of the job doesn't suffer when cheaper labor is employed.
Think it is a good idea. We are using public funds for these projects, so why not be allowed to negotiate (bid) for the best prices as long as the labor is of a similar quality.
Legislative Service Commission Research Report -33-
Excellent-- lot less paperwork and on smaller projects, $50,000-$150,000, do not think quality is an issue on big projects. There may be a quality issue, but I doubt it. Private enterprise is exempt so we should be also.
It should save money across the state. I believe "all" our workers are being paid prevailing wage. At this point, we're satisfied with the quality of work.
I think it is good for our school district, save money, same quality.
Would probably be better off hiring union workers & contractors. We received very poor quality work. I am sure we used non-prevailing wage to save money.
Helps school districts by providing more budget money to extend or add additional projects. Frees up funds to apply toward higher quality equipment or more material that would normally be spent on exceptionally higher wages. It also adds more people to the work force at a reasonable wage in which projects finish as scheduled or with little or no time extension.
I am totally supporting the exemption. I don't mind paying for quality work when I get it but unfortunately the unions today are more interested in keeping sub par people on the payroll then they are about the quality of the work.
It has been a definite plus. I don't care if the contractor is union, non-union, or Martian. What I care most is that a quality job is completed at a competitive price.
Places more contractors in a position to bid. Quality is the answer not--union or non-union.
This legislation has saved school districts both time and money by exempting us from prevailing wages. At the same time, it has hurt the quality of work we have received. It should be noted that we do not ask a company whether they are union (prevailing wage) company or not. But, it has probably been a 50/50 split between union and non-union companies doing our jobs.
I strongly believe that the exemption is beneficial to school projects. It provides for a more open and competitive bid process and for us, has not affected our quality of construction.
Legislative Service Commission Research Report -34-
I favor the exemption for school districts. It enables districts to get quality work done quicker than they normally would be able to, and at a reasonable price.
This has been great for schools and taxpayers. We are still getting a quality product.
Overall, the exemption has made a favorable impression on projects, from a cost standpoint, without significantly reducing quality.
Just finishing a project of almost 18 million that wasn't prevailing wage. I am extremely pleased with the pricing and quality I received.
We want to keep the prevailing wage exemption. We feel it less costly projects, time savings to us (less monitoring) and equal quality of work done.
We finished a building project ($19 million) that required prevailing wage. Strong union influence in our district besides. Probably increased bids, not necessarily better quality work. All but one contractor was union.
This exemption has provided us with a better quality addition because of the lowering of cost.
School dollars are very hard to come by. The prevailing wage exemption saves money and does not sacrifice quality.
In our area, there are strong unions; all these unions have been very supportive of our district. I continue to think it best to pay prevailing wage rates. I also become concerned of the quality we may get if less than prevailing wage contractors get contracts.
Excellent idea to exempt schools from this. Quality of work is just as high or higher. In fact, several local contractors will not bid prevailing wage jobs because of paperwork, etc.
Excellent legislation--increase competition resulting in higher quality-- lower cost--and projects are completed more efficiently and sooner. Don't let the unions prevail in over turning this exemption!
Legislative Service Commission Research Report -35-
The prevailing wage exemption has been very important to schools. It has saved huge sums of money at no apparent loss of quality of work. It has allowed us to spend more money on education and less on maintenance.
I feel it allows school districts to obtain quality contractors at a reduced cost.
The prevailing wage exemption provides contractors an opportunity to use labor that may not be the quality we want for our public building projects. Depends on the supervisor that monitors the projects. Still believe "you get what you pay for." However, on this project we were fortunate to have a local contractor awarded the bid.
I still believe that without mandatory prevailing wage the cost of projects overall are lower. I also believe that there is no loss of quality. We have worked with both union and non-union shops and have many success stories using both.
Quality firms and individuals do quality work! This is irregardless of prevailing wage!
Can't really tell if it made a difference. Quality of construction has been excellent.
Conclusion
Quality is a subjective concept. In seeking to evaluate the impact that the prevailing wage exemption had on the quality of school construction, LSC assumed a definition of quality meaning "conformance to adequately developed requirements" and that "the ultimate measure of quality" was the "satisfaction of users' needs." Surveys of school districts indicate that the users of the buildings are generally satisfied with the buildings. As perceived by responders, the exemption does not appear to have decreased the quality of school construction by that definition.52
52 However, other definitions of "quality" could be affected by the exemption. LSC was unable to measure, for example, the longevity or future maintenance requirements of the buildings being constructed by workers being paid less than prevailing wages.
Legislative Service Commission Research Report -36-
Section Five
Impact on Construction Wages
Senate Bill 102 required an evaluation of the impact of the prevailing wage exemption on the wages of construction employees working on the construction of public school buildings in Ohio. To the extent that prevailing wage laws increase wages in the construction industry, the repeal of prevailing wage laws would be expected to decrease wages in the construction industry. Kessler and Katz (2001) used individual data on blue-collar construction and non-construction workers obtained from the census and the Current Population Survey to analyze wages in repeal and non-repeal states.53 They conclude that a repeal of a state's prevailing wage law leads to a slight decrease in the relative wages of both union and non-union construction workers and a sizeable reduction in the union wage premium.
Senate Bill 102 did not totally repeal Ohio's prevailing wage law. Only school construction and renovation projects were exempted from the requirements. Other public construction projects are still subject to Ohio's prevailing wage requirements.54 Because Ohio "repealed" the prevailing wage for only a specific category of construction, the potential exists for affected workers to change to some other category of construction and minimize any negative impacts the exemption might have on individual workers. Because school construction is a relatively small part of Ohio's construction industry, trends and events in the rest of the industry may overwhelm any effects of the prevailing wage exemption. At the time the exemption went into effect, demand for construction wo rkers was high. The high demand for workers may have counteracted any negative effect the exemption may have had on individual workers. The impact of the exemption on
53 Daniel P. Kessler and Lawrence F. Katz, "Prevailing Wage Laws and Construction Labor Markets," Industrial and Labor Relations Review, Volume 54, Number 2, January 2001, pp. 259-274.
54 Ohio's prevailing wage law applies, with certain exemptions, to any public authority authorized to contract for a public improvement estimated to cost above specified threshold amounts. In addition to the exemption for primary and secondary schools, other projects exempt from the prevailing wage law include projects subject to the federal Davis-Bacon Act, projects utilizing participants in specified types of employment programs or work experience programs when a public authority uses a participant's labor to construct a public improvement, the construction or renovation of certain publicly funded multifamily residential projects, the construction of specified county ditch projects, public improvements constructed by full-time nonprobationary employees of a public authority who are classified in the civil service, and public improvements undertaken by or under contract for soil and water conservation districts and certain county hospitals.
Legislative Service Commission Research Report -37-
the wages of construction employees working on the construction of public school building in Ohio is not likely to show up in the available statistics for the construction industry as a whole.
School Construction Relative to Total Construction
School construction accounts for a small, but significant, share of the overall construction industry in Ohio. The 1997 Census of Construction indicated that in Ohio the value of construction work on educational buildings accounted for 5.0 percent of the total value of construction, 6.4 percent of the value of building construction, and 10.5 percent of the value of nonresidential building construction.55, 56 The prevailing wage exemption created by Senate Bill 102 affected only this small segment of the Ohio construction industry. Because school construction is such a small part of the overall construction industry, trends and events in the rest of the industry may overwhelm any effects of the prevailing wage exemption and hamper the identification of these effects through the analysis of overall industry data. This may change as school construction begins to account for an increasing share of overall construction activity. Additionally, workers may find it easier to move from the relatively small segment of the industry directly affected by the exemption to the remainder of the industry that was not directly affected by the exemption. This is especially true if the demand for workers is high in the remainder of the industry.
Analysis of Data from the Bureau of Labor Statistics
This section examines recent activity in the construction industry using statistics from the U.S. Bureau of Labor Statistics. The data used in this section are for the construction industry as a whole, not just for that segment involved in school construction. The available data are organized by trade rather than project type. A worker may be employed on more than one type of project during a given period. Prus (1999) commented on this same limitation of the available data, noting that "workers in school construction cannot be distinguished from workers in other market segments" and that "it is not possible to draw any direct inference
55 1997 Economic Census, Construction, Geographic Area Series, U.S. Department of Commerce, U.S. Census Bureau, Washington DC.
56 In the Census of Construction, the category "educational buildings" includes all buildings that are used directly in administrative and instructional activities such as colleges, universities, elementary and secondary schools, correspondence, commercial, and trade schools. Libraries, museums, and art galleries, as well as laboratories that are not a part of a manufacturing or commercial establishment, are also included.
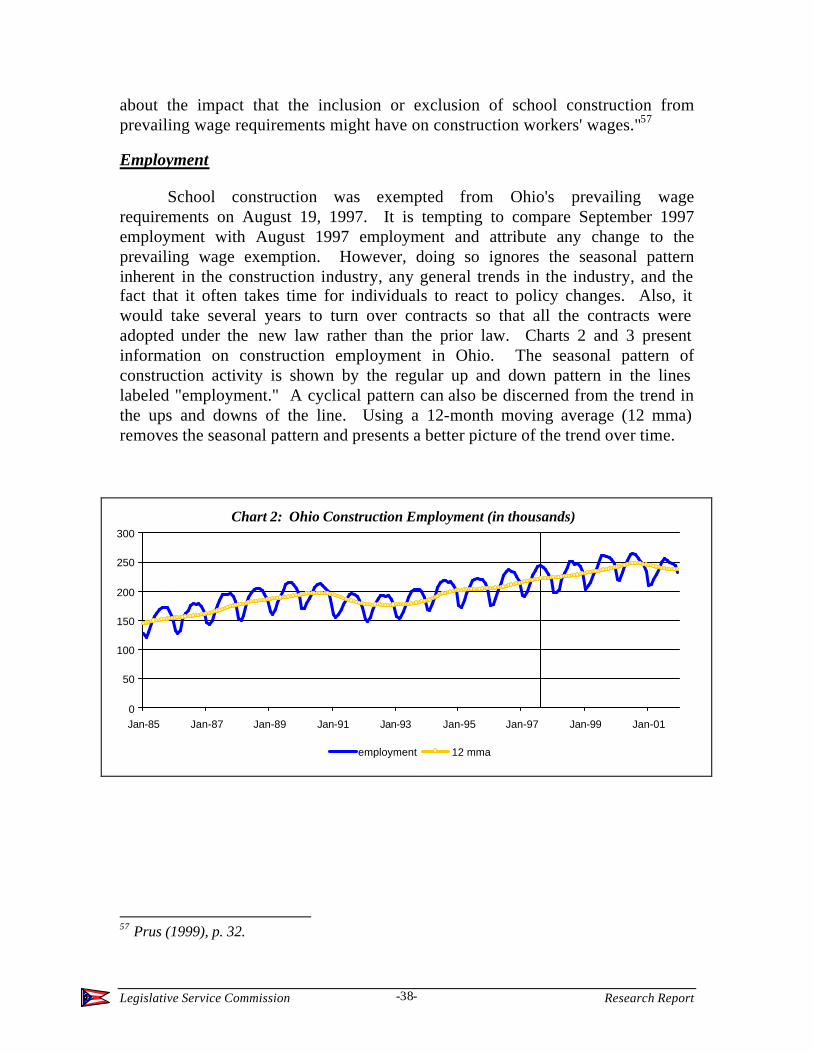
Legislative Service Commission Research Report -38-
about the impact that the inclusion or exclusion of school construction from prevailing wage requirements might have on construction workers' wages."57
Employment
School construction was exempted from Ohio's prevailing wage requirements on August 19, 1997. It is tempting to compare September 1997 employment with August 1997 employment and attribute any change to the prevailing wage exemption. However, doing so ignores the seasonal pattern inherent in the construction industry, any general trends in the industry, and the fact that it often takes time for individuals to react to policy changes. Also, it would take several years to turn over contracts so that all the contracts were adopted under the new law rather than the prior law. Charts 2 and 3 present information on construction employment in Ohio. The seasonal pattern of construction activity is shown by the regular up and down pattern in the lines labeled "employment." A cyclical pattern can also be discerned from the trend in the ups and downs of the line. Using a 12-month moving average (12 mma) removes the seasonal pattern and presents a better picture of the trend over time.
Chart 2: Ohio Construction Employment (in thousands)
0
50
100
150
200
250
300
Jan-85 Jan-87 Jan-89 Jan-91 Jan-93 Jan-95 Jan-97 Jan-99 Jan-01
employment 12 mma
57 Prus (1999), p. 32.
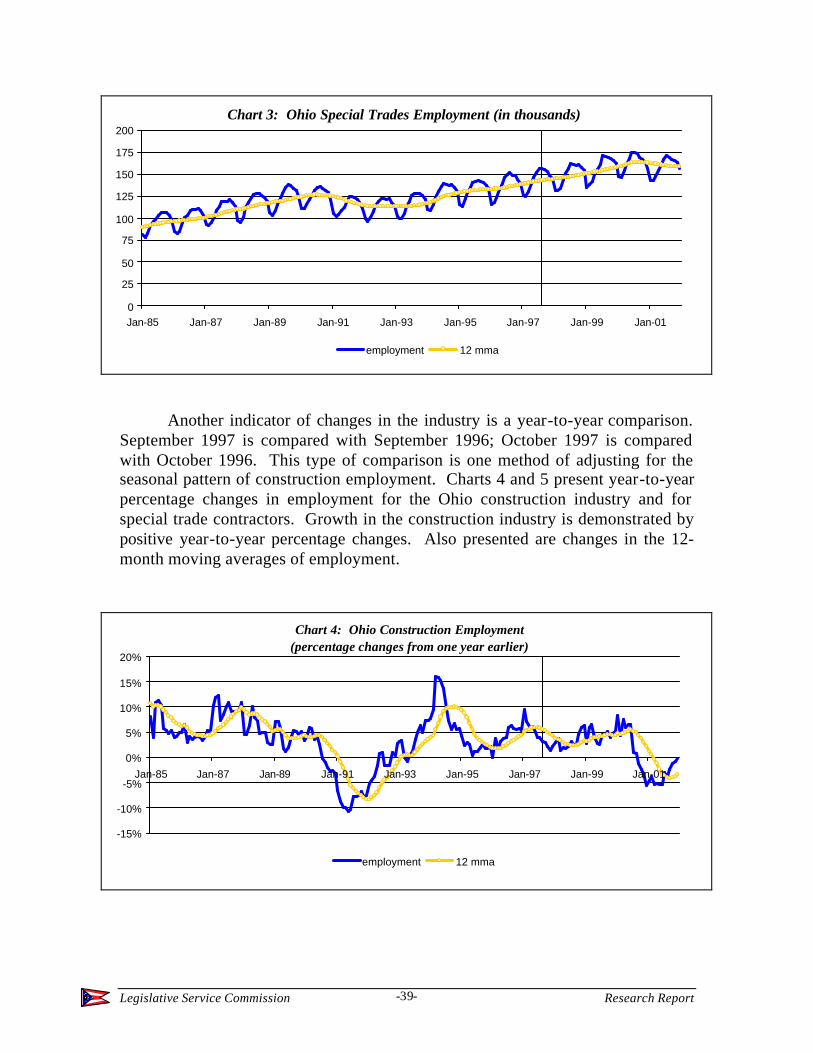
Legislative Service Commission Research Report -39-
Chart 3: Ohio Special Trades Employment (in thousands)
0
25
50
75
100
125
150
175
200
Jan-85 Jan-87 Jan-89 Jan-91 Jan-93 Jan-95 Jan-97 Jan-99 Jan-01
employment 12 mma
Another indicator of changes in the industry is a year-to-year comparison. September 1997 is compared with September 1996; October 1997 is compared with October 1996. This type of comparison is one method of adjusting for the seasonal pattern of construction employment. Charts 4 and 5 present year-to-year percentage changes in employment for the Ohio construction industry and for special trade contractors. Growth in the construction industry is demonstrated by positive year-to-year percentage changes. Also presented are changes in the 12-month moving averages of employment.
Chart 4: Ohio Construction Employment (percentage changes from one year earlier)
-15%
-10%
-5%
0%
5%
10%
15%
20%
Jan-85 Jan-87 Jan-89 Jan-91 Jan-93 Jan-95 Jan-97 Jan-99 Jan-01
employment 12 mma
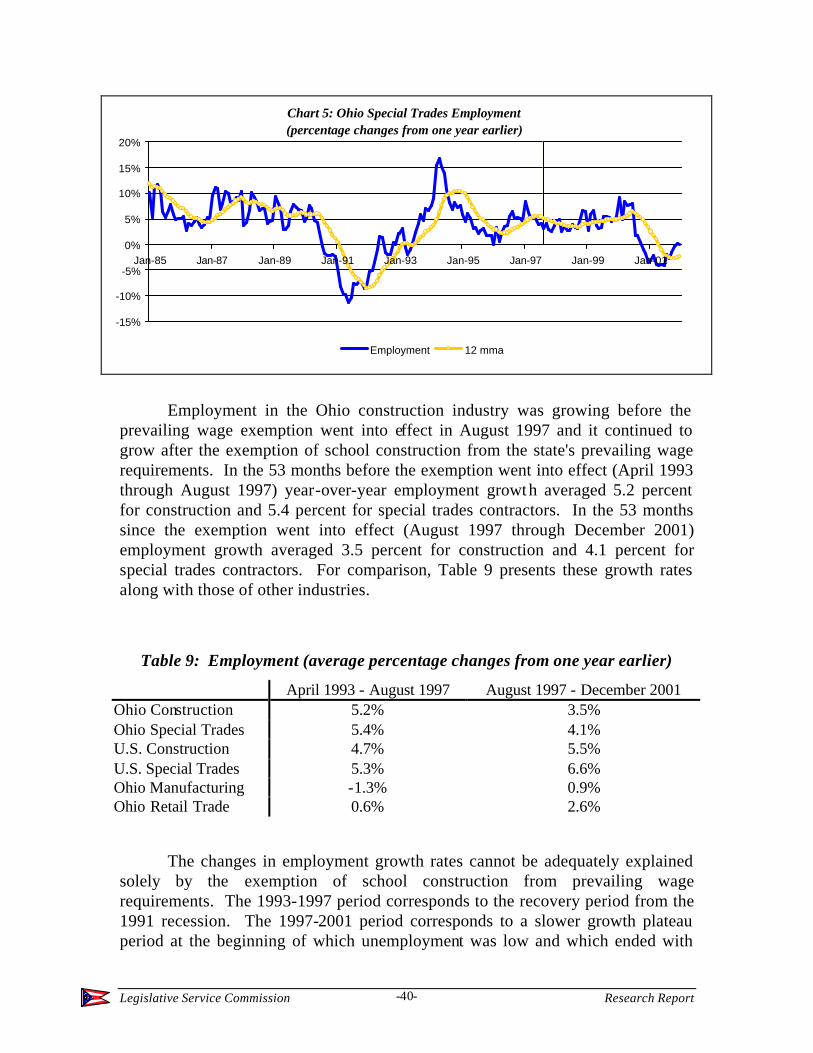
Legislative Service Commission Research Report -40-
Chart 5: Ohio Special Trades Employment(percentage changes from one year earlier)
-15%
-10%
-5%
0%
5%
10%
15%
20%
Jan-85 Jan-87 Jan-89 Jan-91 Jan-93 Jan-95 Jan-97 Jan-99 Jan-01
Employment 12 mma
Employment in the Ohio construction industry was growing before the prevailing wage exemption went into effect in August 1997 and it continued to grow after the exemption of school construction from the state's prevailing wage requirements. In the 53 months before the exemption went into effect (April 1993 through August 1997) year-over-year employment growth averaged 5.2 percent for construction and 5.4 percent for special trades contractors. In the 53 months since the exemption went into effect (August 1997 through December 2001) employment growth averaged 3.5 percent for construction and 4.1 percent for special trades contractors. For comparison, Table 9 presents these growth rates along with those of other industries.
Table 9: Employment (average percentage changes from one year earlier)
April 1993 - August 1997 August 1997 - December 2001 Ohio Construction 5.2% 3.5% Ohio Special Trades 5.4% 4.1% U.S. Construction 4.7% 5.5% U.S. Special Trades 5.3% 6.6% Ohio Manufacturing -1.3% 0.9% Ohio Retail Trade 0.6% 2.6%
The changes in employment growth rates cannot be adequately explained solely by the exemption of school construction from prevailing wage requirements. The 1993-1997 period corresponds to the recovery period from the 1991 recession. The 1997-2001 period corresponds to a slower growth plateau period at the beginning of which unemployment was low and which ended with
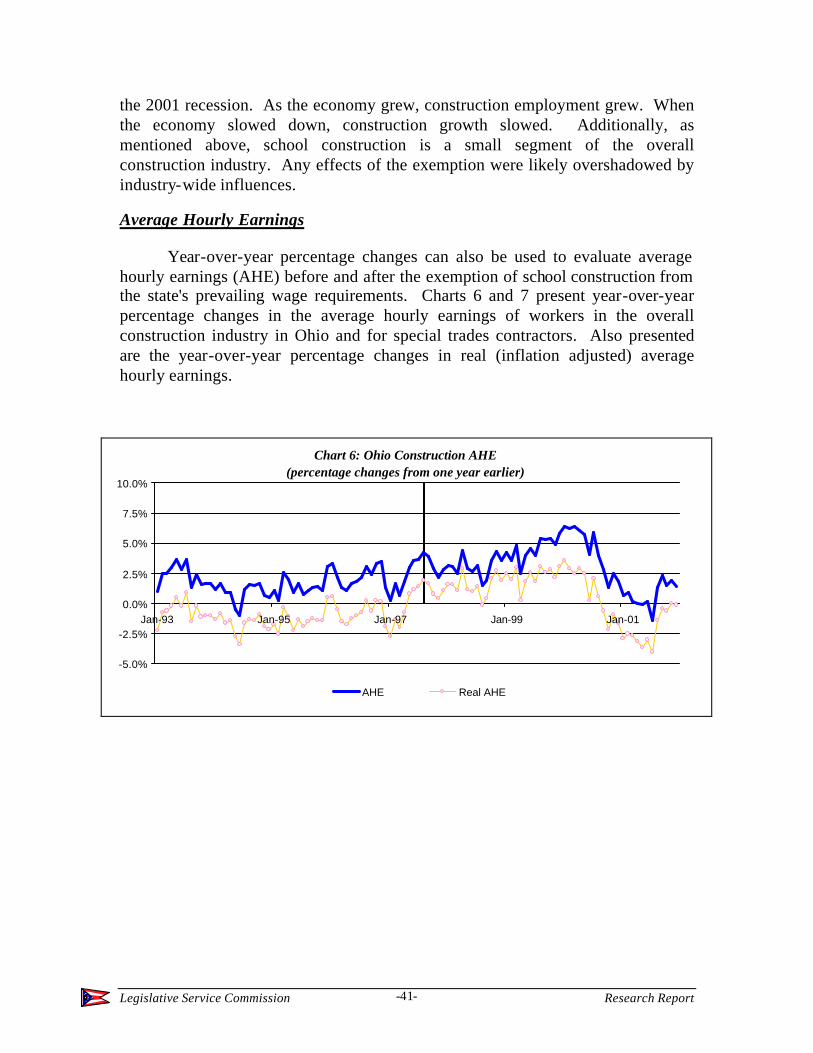
Legislative Service Commission Research Report -41-
the 2001 recession. As the economy grew, construction employment grew. When the economy slowed down, construction growth slowed. Additionally, as mentioned above, school construction is a small segment of the overall construction industry. Any effects of the exemption were likely overshadowed by industry-wide influences.
Average Hourly Earnings
Year-over-year percentage changes can also be used to evaluate average hourly earnings (AHE) before and after the exemption of school construction from the state's prevailing wage requirements. Charts 6 and 7 present year-over-year percentage changes in the average hourly earnings of workers in the overall construction industry in Ohio and for special trades contractors. Also presented are the year-over-year percentage changes in real (inflation adjusted) average hourly earnings.
Chart 6: Ohio Construction AHE(percentage changes from one year earlier)
-5.0%
-2.5%
0.0%
2.5%
5.0%
7.5%
10.0%
Jan-93 Jan-95 Jan-97 Jan-99 Jan-01
AHE Real AHE
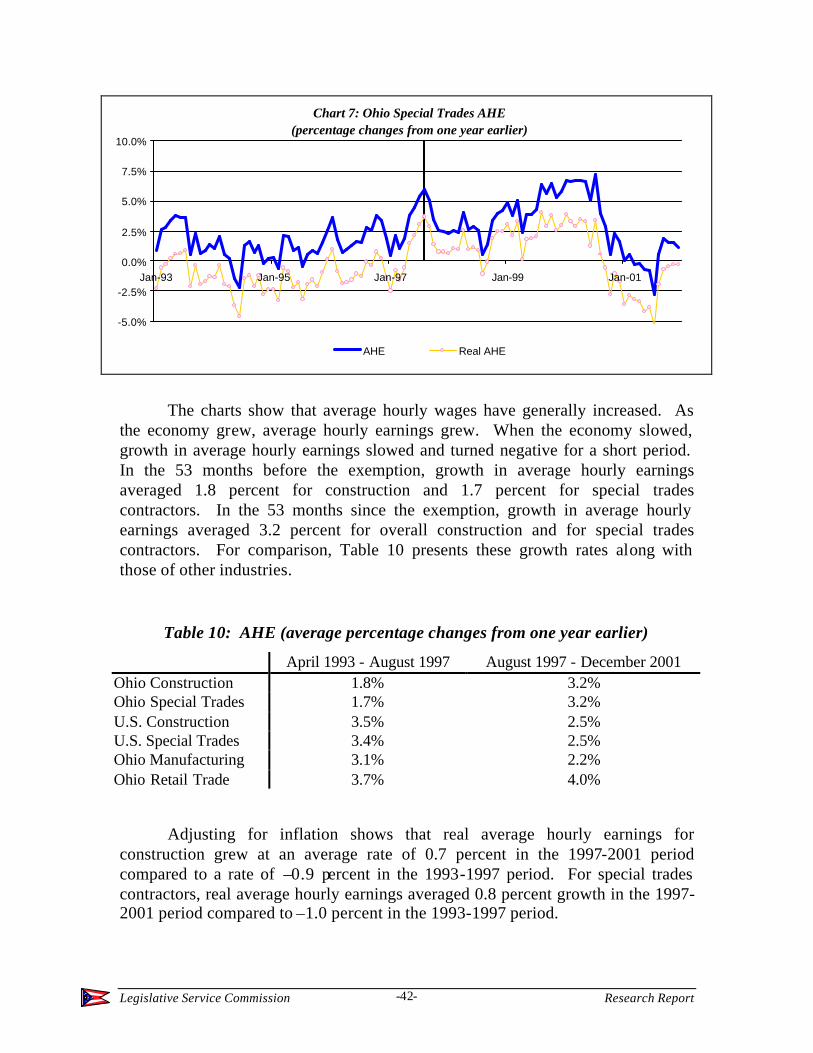
Legislative Service Commission Research Report -42-
Chart 7: Ohio Special Trades AHE(percentage changes from one year earlier)
-5.0%
-2.5%
0.0%
2.5%
5.0%
7.5%
10.0%
Jan-93 Jan-95 Jan-97 Jan-99 Jan-01
AHE Real AHE
The charts show that average hourly wages have generally increased. As the economy grew, average hourly earnings grew. When the economy slowed, growth in average hourly earnings slowed and turned negative for a short period. In the 53 months before the exemption, growth in average hourly earnings averaged 1.8 percent for construction and 1.7 percent for special trades contractors. In the 53 months since the exemption, growth in average hourly earnings averaged 3.2 percent for overall construction and for special trades contractors. For comparison, Table 10 presents these growth rates along with those of other industries.
Table 10: AHE (average percentage changes from one year earlier)
April 1993 - August 1997 August 1997 - December 2001 Ohio Construction 1.8% 3.2% Ohio Special Trades 1.7% 3.2% U.S. Construction 3.5% 2.5% U.S. Special Trades 3.4% 2.5% Ohio Manufacturing 3.1% 2.2% Ohio Retail Trade 3.7% 4.0%
Adjusting for inflation shows that real average hourly earnings for construction grew at an average rate of 0.7 percent in the 1997-2001 period compared to a rate of –0.9 percent in the 1993-1997 period. For special trades contractors, real average hourly earnings averaged 0.8 percent growth in the 1997-2001 period compared to –1.0 percent in the 1993-1997 period.
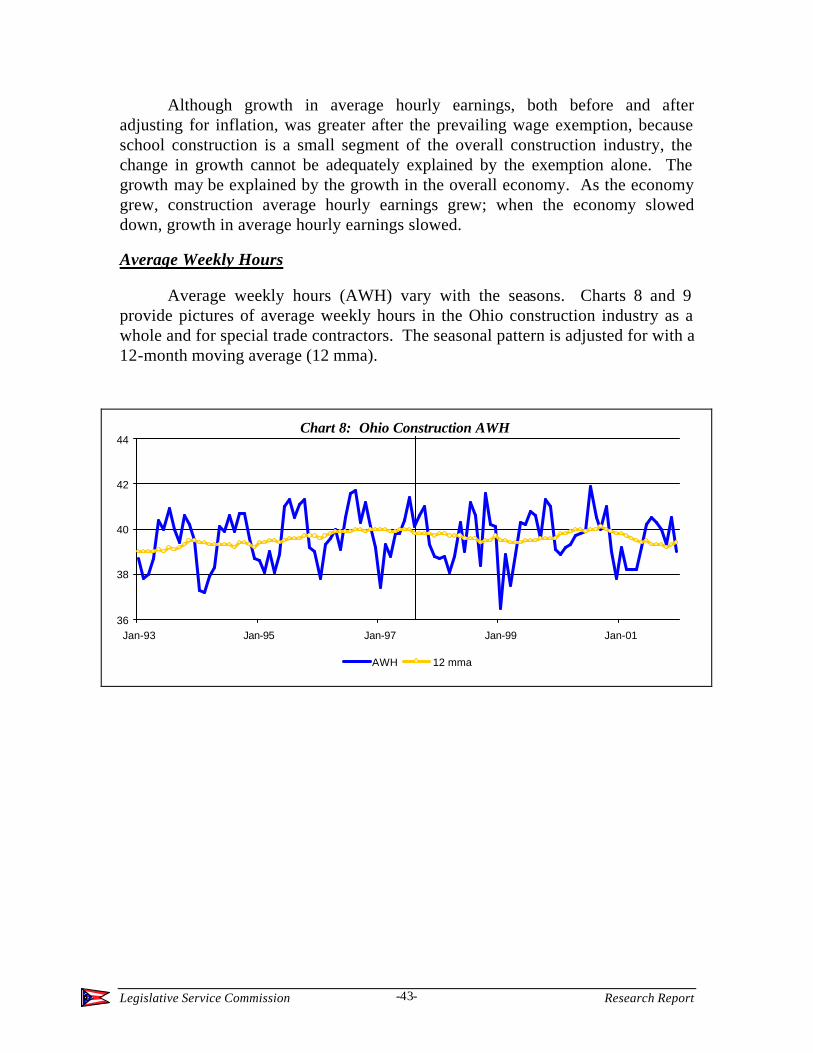
Legislative Service Commission Research Report -43-
Although growth in average hourly earnings, both before and after adjusting for inflation, was greater after the prevailing wage exemption, because school construction is a small segment of the overall construction industry, the change in growth cannot be adequately explained by the exemption alone. The growth may be explained by the growth in the overall economy. As the economy grew, construction average hourly earnings grew; when the economy slowed down, growth in average hourly earnings slowed.
Average Weekly Hours
Average weekly hours (AWH) vary with the seasons. Charts 8 and 9 provide pictures of average weekly hours in the Ohio construction industry as a whole and for special trade contractors. The seasonal pattern is adjusted for with a 12-month moving average (12 mma).
Chart 8: Ohio Construction AWH
36
38
40
42
44
Jan-93 Jan-95 Jan-97 Jan-99 Jan-01
AWH 12 mma
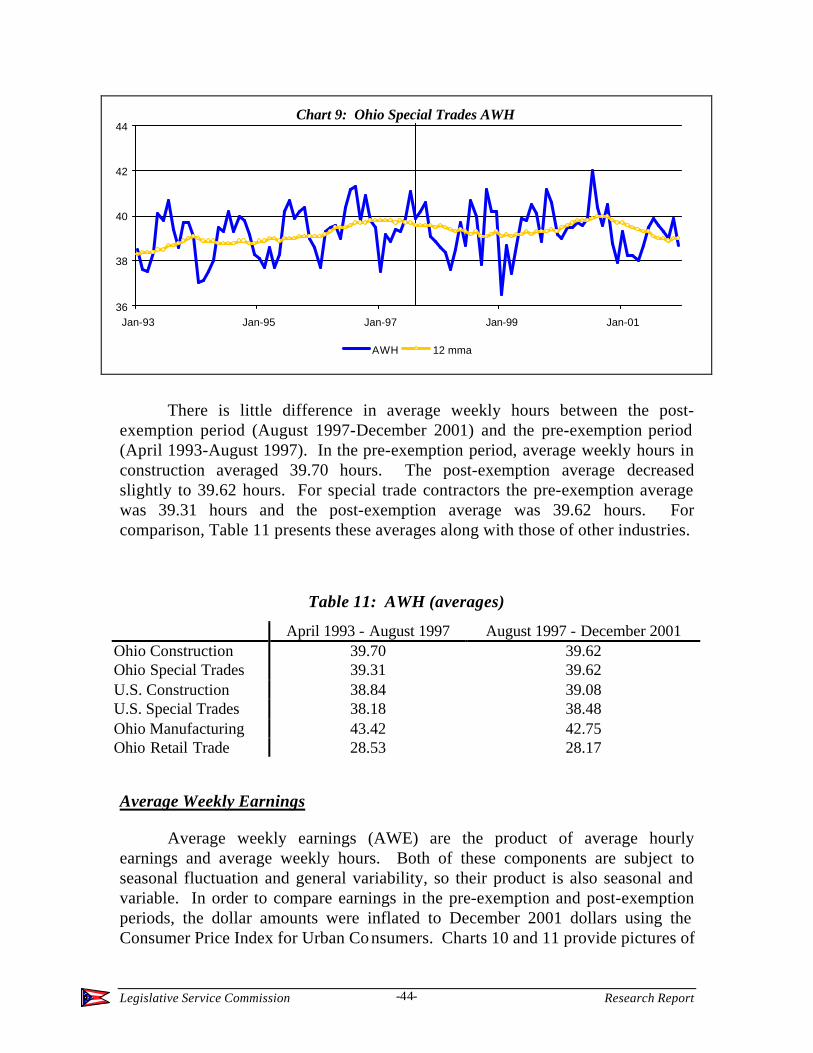
Legislative Service Commission Research Report -44-
Chart 9: Ohio Special Trades AWH
36
38
40
42
44
Jan-93 Jan-95 Jan-97 Jan-99 Jan-01
AWH 12 mma
There is little difference in average weekly hours between the post-exemption period (August 1997-December 2001) and the pre-exemption period (April 1993-August 1997). In the pre-exemption period, average weekly hours in construction averaged 39.70 hours. The post-exemption average decreased slightly to 39.62 hours. For special trade contractors the pre-exemption average was 39.31 hours and the post-exemption average was 39.62 hours. For comparison, Table 11 presents these averages along with those of other industries.
Table 11: AWH (averages)
April 1993 - August 1997 August 1997 - December 2001 Ohio Construction 39.70 39.62 Ohio Special Trades 39.31 39.62 U.S. Construction 38.84 39.08 U.S. Special Trades 38.18 38.48 Ohio Manufacturing 43.42 42.75 Ohio Retail Trade 28.53 28.17
Average Weekly Earnings
Average weekly earnings (AWE) are the product of average hourly earnings and average weekly hours. Both of these components are subject to seasonal fluctuation and general variability, so their product is also seasonal and variable. In order to compare earnings in the pre-exemption and post-exemption periods, the dollar amounts were inflated to December 2001 dollars using the Consumer Price Index for Urban Consumers. Charts 10 and 11 provide pictures of
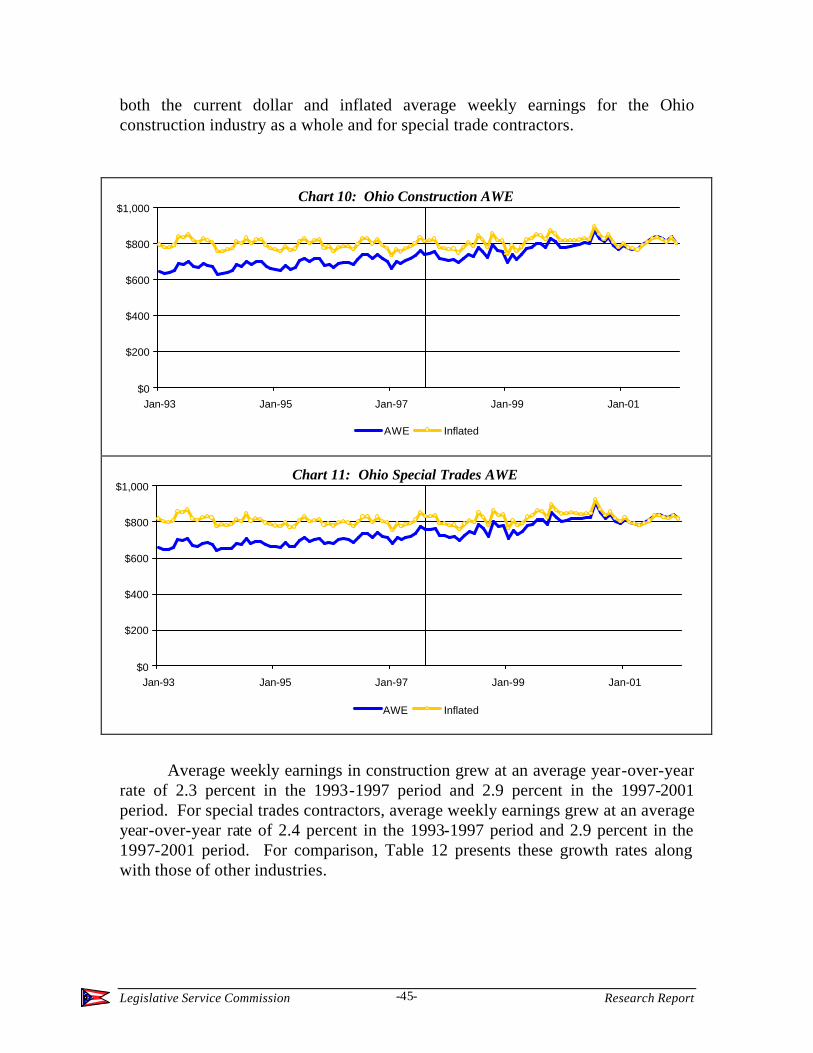
Legislative Service Commission Research Report -45-
both the current dollar and inflated average weekly earnings for the Ohio construction industry as a whole and for special trade contractors.
Chart 10: Ohio Construction AWE
$0
$200
$400
$600
$800
$1,000
Jan-93 Jan-95 Jan-97 Jan-99 Jan-01
AWE Inflated
Chart 11: Ohio Special Trades AWE
$0
$200
$400
$600
$800
$1,000
Jan-93 Jan-95 Jan-97 Jan-99 Jan-01
AWE Inflated
Average weekly earnings in construction grew at an average year-over-year rate of 2.3 percent in the 1993-1997 period and 2.9 percent in the 1997-2001 period. For special trades contractors, average weekly earnings grew at an average year-over-year rate of 2.4 percent in the 1993-1997 period and 2.9 percent in the 1997-2001 period. For comparison, Table 12 presents these growth rates along with those of other industries.
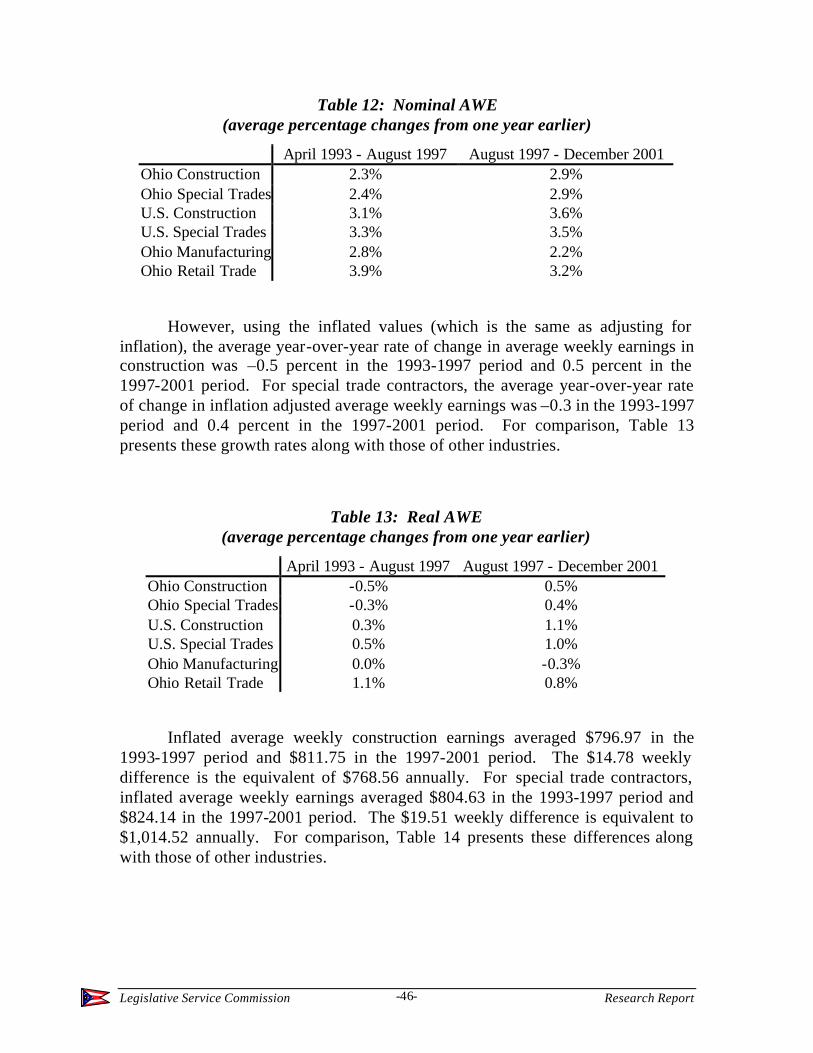
Legislative Service Commission Research Report -46-
Table 12: Nominal AWE (average percentage changes from one year earlier)
April 1993 - August 1997 August 1997 - December 2001 Ohio Construction 2.3% 2.9% Ohio Special Trades 2.4% 2.9% U.S. Construction 3.1% 3.6% U.S. Special Trades 3.3% 3.5% Ohio Manufacturing 2.8% 2.2% Ohio Retail Trade 3.9% 3.2%
However, using the inflated values (which is the same as adjusting for inflation), the average year-over-year rate of change in average weekly earnings in construction was –0.5 percent in the 1993-1997 period and 0.5 percent in the 1997-2001 period. For special trade contractors, the average year-over-year rate of change in inflation adjusted average weekly earnings was –0.3 in the 1993-1997 period and 0.4 percent in the 1997-2001 period. For comparison, Table 13 presents these growth rates along with those of other industries.
Table 13: Real AWE (average percentage changes from one year earlier)
April 1993 - August 1997 August 1997 - December 2001 Ohio Construction -0.5% 0.5% Ohio Special Trades -0.3% 0.4% U.S. Construction 0.3% 1.1% U.S. Special Trades 0.5% 1.0% Ohio Manufacturing 0.0% -0.3% Ohio Retail Trade 1.1% 0.8%
Inflated average weekly construction earnings averaged $796.97 in the 1993-1997 period and $811.75 in the 1997-2001 period. The $14.78 weekly difference is the equivalent of $768.56 annually. For special trade contractors, inflated average weekly earnings averaged $804.63 in the 1993-1997 period and $824.14 in the 1997-2001 period. The $19.51 weekly difference is equivalent to $1,014.52 annually. For comparison, Table 14 presents these differences along with those of other industries.
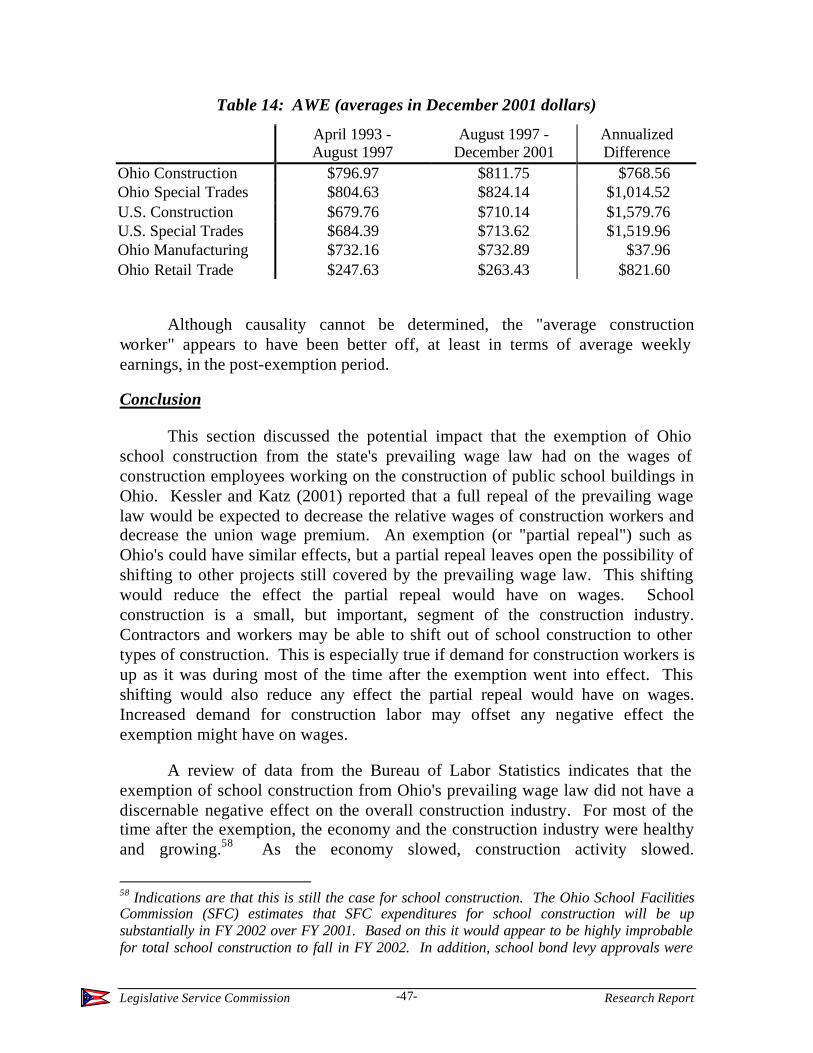
Legislative Service Commission Research Report -47-
Table 14: AWE (averages in December 2001 dollars)
April 1993 - August 1997
August 1997 - December 2001
Annualized Difference
Ohio Construction $796.97 $811.75 $768.56 Ohio Special Trades $804.63 $824.14 $1,014.52 U.S. Construction $679.76 $710.14 $1,579.76 U.S. Special Trades $684.39 $713.62 $1,519.96 Ohio Manufacturing $732.16 $732.89 $37.96 Ohio Retail Trade $247.63 $263.43 $821.60
Although causality cannot be determined, the "average construction worker" appears to have been better off, at least in terms of average weekly earnings, in the post-exemption period.
Conclusion
This section discussed the potential impact that the exemption of Ohio school construction from the state's prevailing wage law had on the wages of construction employees working on the construction of public school buildings in Ohio. Kessler and Katz (2001) reported that a full repeal of the prevailing wage law would be expected to decrease the relative wages of construction workers and decrease the union wage premium. An exemption (or "partial repeal") such as Ohio's could have similar effects, but a partial repeal leaves open the possibility of shifting to other projects still covered by the prevailing wage law. This shifting would reduce the effect the partial repeal would have on wages. School construction is a small, but important, segment of the construction industry. Contractors and workers may be able to shift out of school construction to other types of construction. This is especially true if demand for construction workers is up as it was during most of the time after the exemption went into effect. This shifting would also reduce any effect the partial repeal would have on wages. Increased demand for construction labor may offset any negative effect the exemption might have on wages.
A review of data from the Bureau of Labor Statistics indicates that the exemption of school construction from Ohio's prevailing wage law did not have a discernable negative effect on the overall construction industry. For most of the time after the exemption, the economy and the construction industry were healthy and growing.58 As the economy slowed, construction activity slowed.
58 Indications are that this is still the case for school construction. The Ohio School Facilities Commission (SFC) estimates that SFC expenditures for school construction will be up substantially in FY 2002 over FY 2001. Based on this it would appear to be highly improbable for total school construction to fall in FY 2002. In addition, school bond levy approvals were
Legislative Service Commission Research Report -48-
Employment growth continued after the exemption went into effect and slowed only when the economy slowed. Average hourly earnings continued to grow until the economy slowed. Average weekly earnings also continued to grow. Inflation-adjusted average weekly earnings were higher on average after the exemption than before the exemption. Although the industry as a whole continued to do well after the exemption, some individuals may have done better than others and some may have done worse.
very high in CY 2000 and CY 2001. This indicates that local money for school construction over the next few years will be substantial and probably will continue to rise along with the state funding through at least CY 2002 and probably beyond.
Legislative Service Commission Research Report -49-
Section Six
Conclusion
Senate Bill 102 exempted school construction from Ohio's prevailing wage requirements and required an evaluation of the effects of the exemption on construction costs, construction quality, and construction wages.
LSC found indications of $487.9 million in aggregate savings, an overall savings of 10.7 percent. Estimated savings on new construction projects was $24.6 million (1.2 percent). Estimated savings on additions was $408.0 million (19.9 percent). Estimated savings on alterations was $55.2 million (10.7 percent). Evidence was not available as to the portion of the estimated savings, if any, that could be directly and conclusively attributed to the prevailing wage exemption.
LSC found indications that the exemption had little impact on the quality of public school building construction. Using the satisfaction of users' needs as a measure of quality, LSC surveyed school districts to determine the extent to which they were satisfied with the quality of public school building construction. The surveys indicate that the users of the buildings are generally satisfied with the buildings and that, in the opinion of the users, the exemption does not appear to have decreased the quality of school construction.
LSC found indications that the exemption had little impact on the wages of construction employees working on the construction of public school buildings. The search for an impact was complicated by a number of factors. School construction accounts for a small percentage of construction activity. Most workers do not specialize in one category of project, such as school construction, but specialize in a craft or activity and move between types of projects that include that activity. Demand for construction workers has been high for most of the time since the exemption went into effect.
The effects reported are for the specific exemption of school construction in the Ohio economic environment of the late 1990's. A different exemption in a different economic environment may have different effects.
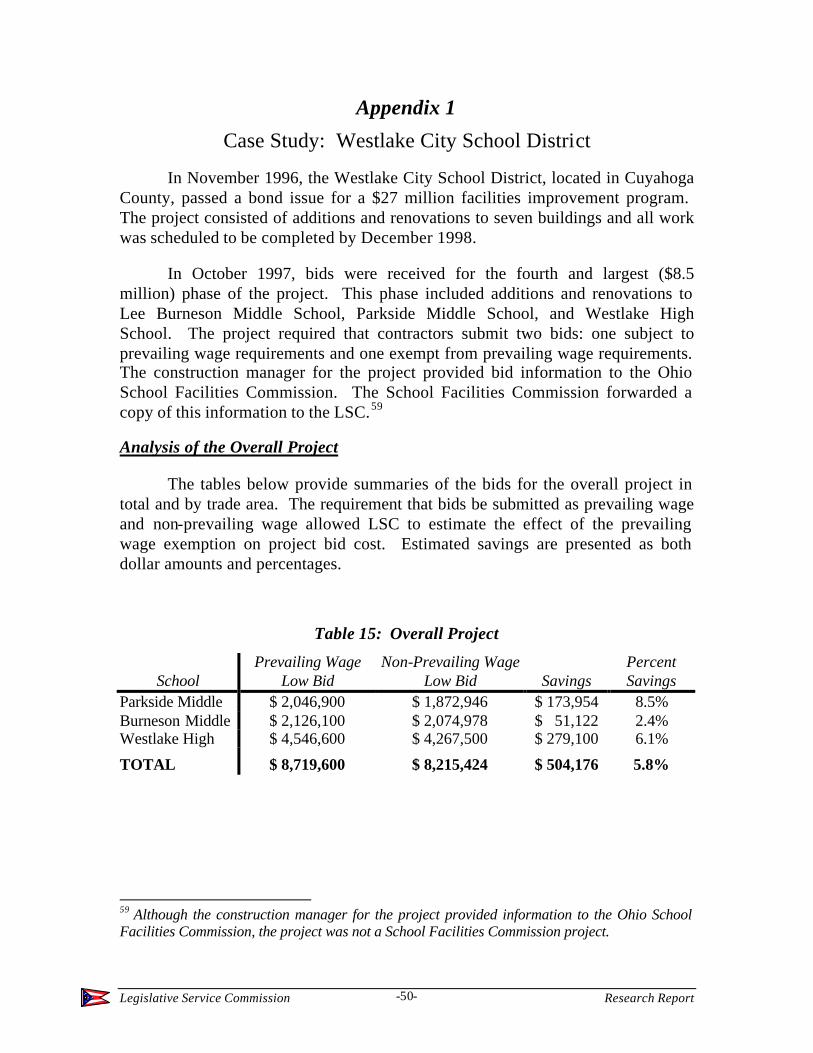
Legislative Service Commission Research Report -50-
Appendix 1
Case Study: Westlake City School District
In November 1996, the Westlake City School District, located in Cuyahoga County, passed a bond issue for a $27 million facilities improvement program. The project consisted of additions and renovations to seven buildings and all work was scheduled to be completed by December 1998.
In October 1997, bids were received for the fourth and largest ($8.5 million) phase of the project. This phase included additions and renovations to Lee Burneson Middle School, Parkside Middle School, and Westlake High School. The project required that contractors submit two bids: one subject to prevailing wage requirements and one exempt from prevailing wage requirements. The construction manager for the project provided bid information to the Ohio School Facilities Commission. The School Facilities Commission forwarded a copy of this information to the LSC.59
Analysis of the Overall Project
The tables below provide summaries of the bids for the overall project in total and by trade area. The requirement that bids be submitted as prevailing wage and non-prevailing wage allowed LSC to estimate the effect of the prevailing wage exemption on project bid cost. Estimated savings are presented as both dollar amounts and percentages.
Table 15: Overall Project
School
Prevailing Wage Low Bid
Non-Prevailing Wage Low Bid
Savings
Percent Savings
Parkside Middle $ 2,046,900 $ 1,872,946 $ 173,954 8.5% Burneson Middle $ 2,126,100 $ 2,074,978 $ 51,122 2.4% Westlake High $ 4,546,600 $ 4,267,500 $ 279,100 6.1%
TOTAL $ 8,719,600 $ 8,215,424 $ 504,176 5.8%
59 Although the construction manager for the project provided information to the Ohio School Facilities Commission, the project was not a School Facilities Commission project.
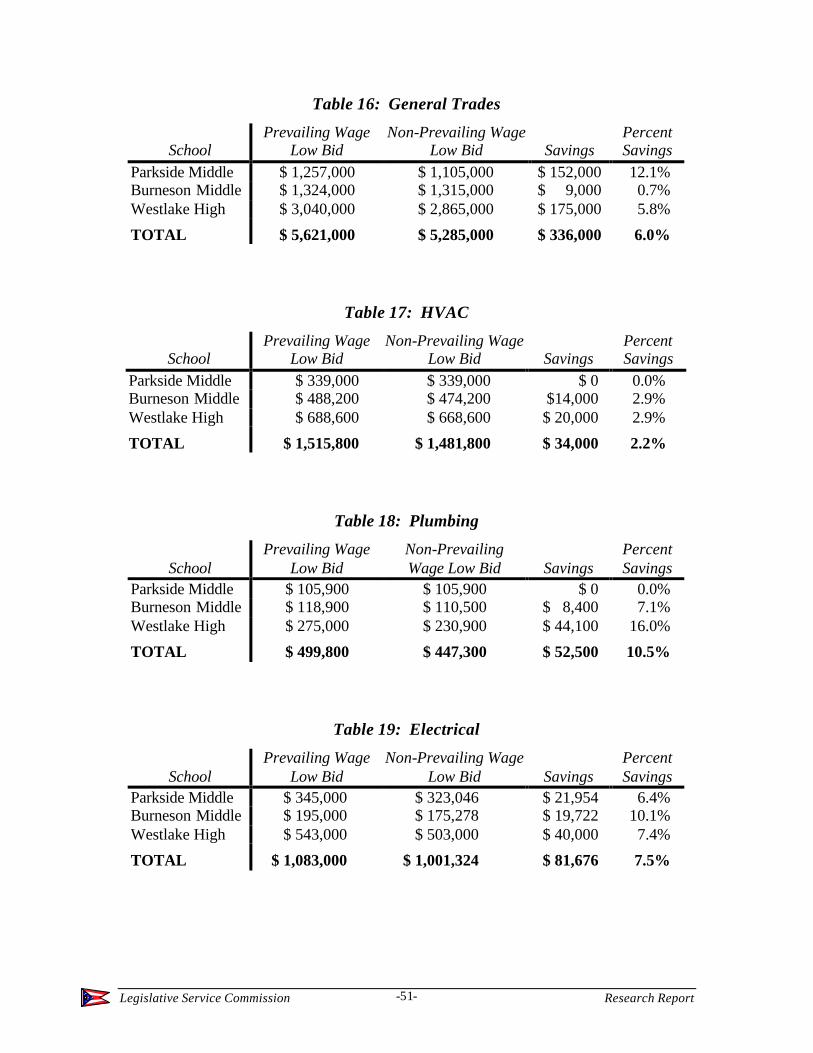
Legislative Service Commission Research Report -51-
Table 16: General Trades
School
Prevailing Wage Low Bid
Non-Prevailing Wage Low Bid
Savings
Percent Savings
Parkside Middle $ 1,257,000 $ 1,105,000 $ 152,000 12.1% Burneson Middle $ 1,324,000 $ 1,315,000 $ 9,000 0.7% Westlake High $ 3,040,000 $ 2,865,000 $ 175,000 5.8%
TOTAL $ 5,621,000 $ 5,285,000 $ 336,000 6.0%
Table 17: HVAC
School
Prevailing Wage Low Bid
Non-Prevailing Wage Low Bid
Savings
Percent Savings
Parkside Middle $ 339,000 $ 339,000 $ 0 0.0% Burneson Middle $ 488,200 $ 474,200 $14,000 2.9% Westlake High $ 688,600 $ 668,600 $ 20,000 2.9%
TOTAL $ 1,515,800 $ 1,481,800 $ 34,000 2.2%
Table 18: Plumbing
School
Prevailing Wage Low Bid
Non-Prevailing Wage Low Bid
Savings
Percent Savings
Parkside Middle $ 105,900 $ 105,900 $ 0 0.0% Burneson Middle $ 118,900 $ 110,500 $ 8,400 7.1% Westlake High $ 275,000 $ 230,900 $ 44,100 16.0%
TOTAL $ 499,800 $ 447,300 $ 52,500 10.5%
Table 19: Electrical
School
Prevailing Wage Low Bid
Non-Prevailing Wage Low Bid
Savings
Percent Savings
Parkside Middle $ 345,000 $ 323,046 $ 21,954 6.4% Burneson Middle $ 195,000 $ 175,278 $ 19,722 10.1% Westlake High $ 543,000 $ 503,000 $ 40,000 7.4%
TOTAL $ 1,083,000 $ 1,001,324 $ 81,676 7.5%
Legislative Service Commission Research Report -52-
Estimated overall savings for the project were 5.8 percent. Savings vary by school and by trade. The largest dollar savings are associated with the largest project, Westlake High School. However, the largest percentage savings were associated with the smallest project, Parkside Middle School.
Plumbing had the largest average percentage savings (10.5%), followed by electrical (7.5%), general trades (6.0%), and HVAC (2.2%). These are average percentage savings for these trade areas. Work in the same trade area at different schools had different savings rates. The savings rates for plumbing ranged from 16 percent at Westlake High School to 0 percent at Parkside Middle School. The low bid on plumbing for Parkside Middle School came from a union contractor.
Savings may vary by project and by trade. For some combinations of project and trade, savings may be high, while for others they may be low or zero. Even without the requirement of the payment of prevailing wages, union contractors may submit the low bid. The exemption of school construction from the state's prevailing wage requirements does not guarantee that union contractors will no longer win contracts. Union contractors can compete and win without the prevailing wage requirement.
Analysis of Bidding Competition
From the information obtained concerning the bids submitted in 12 bidding competitions (3 schools multiplied by 4 trade areas), it was possible to simulate bidding with and without the requirement of the payment of prevailing wages. Twenty-one contractors submitted a total of fifty-eight bids. Twelve of the contractors were non-union, seven were union contractors, and two classified themselves as union or non-union. If the bidding were subject to prevailing wage requirements, analysis indicated that union contractors would have won two of the bidding competitions (17%) and a self-described union/non-union contractor would have won three of the bidding competitions (25%). The seven remaining competitions (58%) would have been won by non-union contractors. In bidding not subject to prevailing wage requirements, union contractors won two of the bidding competitions (17%) and a union/non-union contractor won one of the bidding competitions (8%). The remaining nine competitions (75%) were won by non-union contractors. The removal of the prevailing wage requirement caused the winning contractor to change in five of the bidding competitions.
Conclusions
In a letter accompanying the information provided to the School Facilities Commission, the construction manager for the project concluded that
Legislative Service Commission Research Report -53-
The results show saving due to the use of non-prevailing wage rates for this project. If this type of savings can be realized in a heavily unionized area such as greater Cleveland, more significant savings may be realized in some of the more rural and non-union settings.
The letter also included the following comment.
Surprisingly, there was a lack of union contractor bids, particularly given the strength of the unions in the area. This invokes thoughts that union contractors may begin to shy away from school projects without the prevailing wage in place. While this could limit competitiveness, it could also increase competitiveness. The market for schools may consist of an entirely new group of contractors, potentially resulting in more, lower cost, bidders. With a market shift, however, quality and availability of skilled tradesmen become a concern.
This case study indicates that, in this instance, the presence or absence of
the prevailing wage requirement did affect the outcome of bidding competitions and that the removal of the requirement may lead to savings. However, the absence of the prevailing wage requirement did not guarantee a non-union winner to bidding competitions. Union contractors were able to compete and win even in the absence of prevailing wage requirements, and non-union contractors were able to compete and win even when prevailing wages were required.
Legislative Service Commission Research Report -54-
Appendix 2
Regression Analysis of Dodge Construction Data
LSC obtained data on school construction activity from F.W. Dodge.60 The data purchased covered the years 1992 through 2001. The information obtained covered all types of school construction activity (new construction, addition, or alteration) for all types of projects (primary schools, junior high schools, senior high schools, vocational schools, community colleges, or colleges and universities other than community colleges) undertaken by all types of owners (federal, state, county, or private).
The variables in the data set include: Starting Date, General Contract Value, Square Feet, Stories, Project Type, Structure Type, Owner, and County. "Starting Date" is the month and year in which a project started, generally the bid acceptance date. "General Contract Value" is the initial bid cost of the project in thousands of dollars. "Square Feet" is the size of the project in thousands of square feet. "Stories" is the number of stories in the project. "Project Type" classifies the project as new construction, addition, or alteration. "Structure Type" classifies the project as primary school, junior high school, senior high school, vocational school, community college, or college and university. The variable "Owner" classifies the project as county, state, federal, or private depending on who is paying for the project. For the "Owner" variable, county corresponds to local school districts. The variable "County" is the county in which the project is located.
From the data obtained, LSC selected projects of structure type primary school, junior high school, senior high school, and vocational schools with county or state ownership. This data set was separated into three subsets based on project type: new, addition, and alteration. The alteration subset did not have values for the "Square Foot" variable.
General Contract Value was inflated to December 2001 dollars using an average of the Engineering News Record (ENR) Construction Cost and Building Cost Indices.61 County was used to create a dummy variable "Rural" equal to 1
60 F.W. Dodge, a part of the McGraw-Hill Construction Information Group, is the largest provider of project news, plans, specifications, and analysis services for construction professionals in the United States and Canada.
61 ENR is a magazine providing business and technical news about the construction industry.
The Building Cost Index is based on: 66.38 hours of skilled labor at the 20-city average of bricklayers, carpenters and structural ironworkers rates, plus 25 cwt of standard structural steel
Legislative Service Commission Research Report -55-
for rural counties and 0 for urban counties.62 Dummy variables were also created for junior high school, senior high school, and vocational school.
School construction was exempted from the state's prevailing wage requirements on August 19, 1997. To account for this in the analysis, a dummy variable "PW" was created equal to 1 for "Starting Date" months before September 1997 and equal to 0 for September 1997 and later. A project may have been bid before but started after August 19. A value of 1 indicates that a project was undertaken during the time period in which school construction was subject to Ohio's prevailing wage law.
Inflation-adjusted cost per square foot ($SQFT) was calculated by dividing the inflation-adjusted values of General Contract Value by the corresponding value of the Square Feet variable. Regression analysis was used to estimate equations describing $SQFT for the new and addition groups. $SQFT was used as the dependent variable. Explanatory variables were PW, Rural, JHS, SHS, VOC, interactions between PW and Rural, and a variable to represent the passage of time.63
The rural dummy variable was included to allow for the possibility that costs may be different in these areas. The school type (JHS, SHS, VOC) dummy variables were included to allow for the possibility that costs may differ depending on the type of school. The passage of time was included in the regression equations to account for changes in what is included in schools. Time was represented by the variable Trend equal to one in January 1992 and increasing by one with each month. The PW dummy variable was included to allow for the
shapes at the mill price prior to 1996 and the fabricated 20-city price from 1996, plus 1.128 tons of portland cement at the 20-city price, plus 1,088 board-ft of 2 x 4 lumber at the 20-city price.
The Construction Cost Index is based on: 200 hours of common labor at the 20-city average of common labor rates, plus 25 cwt of standard structural steel shapes at the mill price prior to 1996 and the fabricated 20-city price from 1996, plus 1.128 tons of portland cement at the 20-city price, plus 1,088 board-ft of 2 x 4 lumber at the 20-city price.
The 20 U.S. cities that ENR maintains cost data on are: Atlanta, Baltimore, Birmingham, Boston, Chicago, Cincinnati, Cleveland, Dallas, Denver, Detroit, Kansas City, Los Angeles, Minneapolis, New Orleans, New York, Philadelphia, Pittsburgh, St. Louis, San Francisco, and Seattle.
62 The rural counties include all counties that are not in a metropolitan statistical area (MSA) plus the following counties that are in a MSA but are more rural in nature: Ashtabula, Auglaize, Brown, Carroll, Columbiana, Fulton, Jefferson, Lawrence, and Washington.
63 The variables PW, Rural, JHS, SHS, and VOC are "dummy" or binary variables, i.e., variables defined to have a value of either 0 or 1.
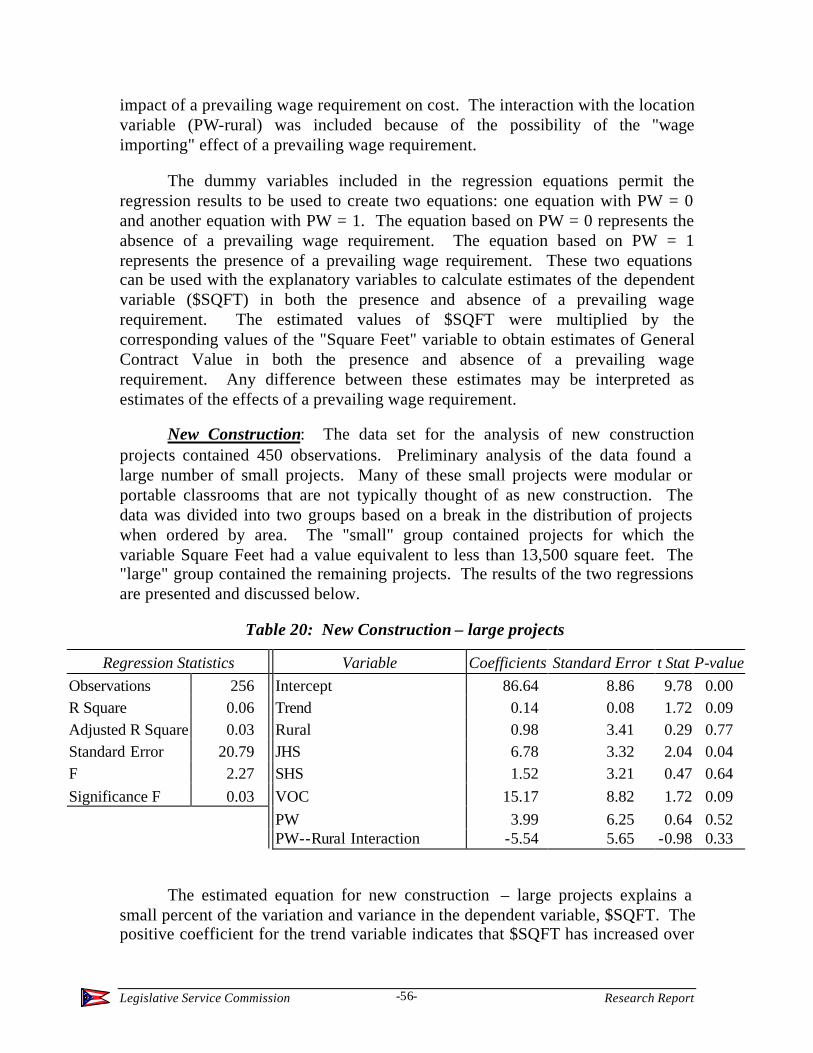
Legislative Service Commission Research Report -56-
impact of a prevailing wage requirement on cost. The interaction with the location variable (PW-rural) was included because of the possibility of the "wage importing" effect of a prevailing wage requirement.
The dummy variables included in the regression equations permit the regression results to be used to create two equations: one equation with PW = 0 and another equation with PW = 1. The equation based on PW = 0 represents the absence of a prevailing wage requirement. The equation based on PW = 1 represents the presence of a prevailing wage requirement. These two equations can be used with the explanatory variables to calculate estimates of the dependent variable ($SQFT) in both the presence and absence of a prevailing wage requirement. The estimated values of $SQFT were multiplied by the corresponding values of the "Square Feet" variable to obtain estimates of General Contract Value in both the presence and absence of a prevailing wage requirement. Any difference between these estimates may be interpreted as estimates of the effects of a prevailing wage requirement.
New Construction: The data set for the analysis of new construction projects contained 450 observations. Preliminary analysis of the data found a large number of small projects. Many of these small projects were modular or portable classrooms that are not typically thought of as new construction. The data was divided into two groups based on a break in the distribution of projects when ordered by area. The "small" group contained projects for which the variable Square Feet had a value equivalent to less than 13,500 square feet. The "large" group contained the remaining projects. The results of the two regressions are presented and discussed below.
Table 20: New Construction – large projects
Regression Statistics Variable Coefficients Standard Error t Stat P-value Observations 256 Intercept 86.64 8.86 9.78 0.00 R Square 0.06 Trend 0.14 0.08 1.72 0.09 Adjusted R Square 0.03 Rural 0.98 3.41 0.29 0.77 Standard Error 20.79 JHS 6.78 3.32 2.04 0.04 F 2.27 SHS 1.52 3.21 0.47 0.64 Significance F 0.03 VOC 15.17 8.82 1.72 0.09 PW 3.99 6.25 0.64 0.52 PW--Rural Interaction -5.54 5.65 -0.98 0.33
The estimated equation for new construction – large projects explains a small percent of the variation and variance in the dependent variable, $SQFT. The positive coefficient for the trend variable indicates that $SQFT has increased over
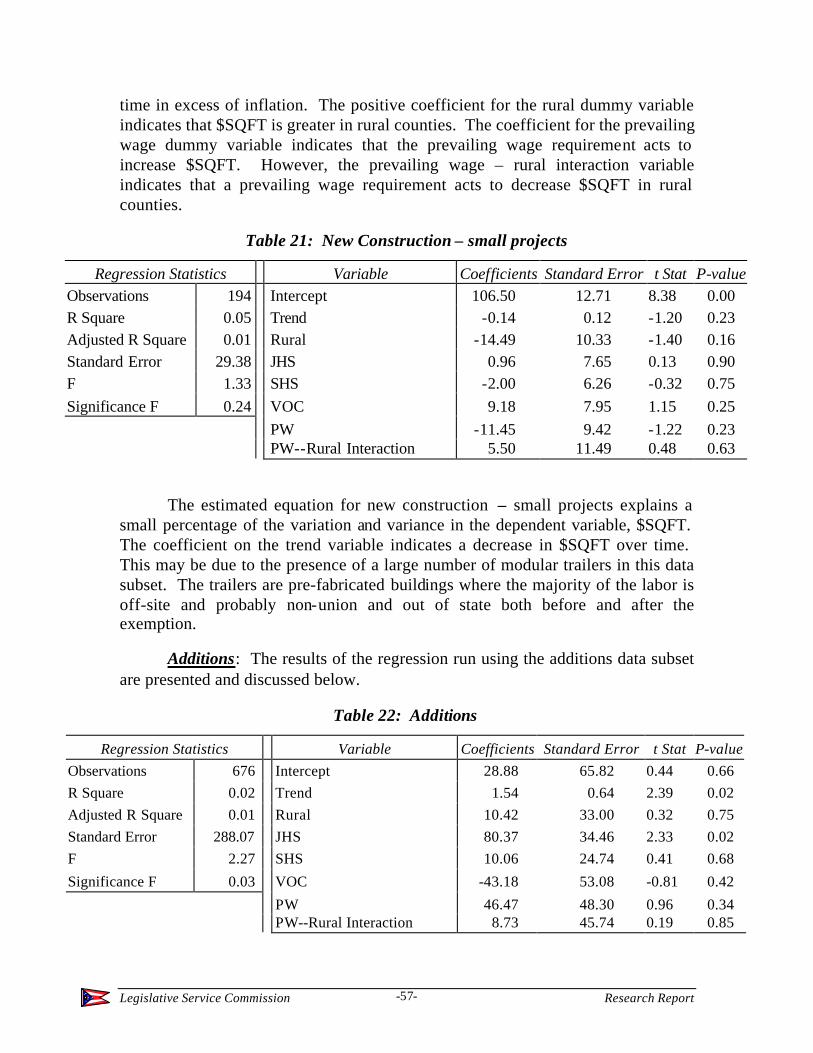
Legislative Service Commission Research Report -57-
time in excess of inflation. The positive coefficient for the rural dummy variable indicates that $SQFT is greater in rural counties. The coefficient for the prevailing wage dummy variable indicates that the prevailing wage requirement acts to increase $SQFT. However, the prevailing wage – rural interaction variable indicates that a prevailing wage requirement acts to decrease $SQFT in rural counties.
Table 21: New Construction – small projects
Regression Statistics Variable Coefficients Standard Error t Stat P-value Observations 194 Intercept 106.50 12.71 8.38 0.00 R Square 0.05 Trend -0.14 0.12 -1.20 0.23 Adjusted R Square 0.01 Rural -14.49 10.33 -1.40 0.16 Standard Error 29.38 JHS 0.96 7.65 0.13 0.90 F 1.33 SHS -2.00 6.26 -0.32 0.75 Significance F 0.24 VOC 9.18 7.95 1.15 0.25 PW -11.45 9.42 -1.22 0.23 PW--Rural Interaction 5.50 11.49 0.48 0.63
The estimated equation for new construction – small projects explains a small percentage of the variation and variance in the dependent variable, $SQFT. The coefficient on the trend variable indicates a decrease in $SQFT over time. This may be due to the presence of a large number of modular trailers in this data subset. The trailers are pre-fabricated buildings where the majority of the labor is off-site and probably non-union and out of state both before and after the exemption.
Additions: The results of the regression run using the additions data subset are presented and discussed below.
Table 22: Additions
Regression Statistics Variable Coefficients Standard Error t Stat P-value Observations 676 Intercept 28.88 65.82 0.44 0.66 R Square 0.02 Trend 1.54 0.64 2.39 0.02 Adjusted R Square 0.01 Rural 10.42 33.00 0.32 0.75 Standard Error 288.07 JHS 80.37 34.46 2.33 0.02 F 2.27 SHS 10.06 24.74 0.41 0.68
Significance F 0.03 VOC -43.18 53.08 -0.81 0.42
PW 46.47 48.30 0.96 0.34 PW--Rural Interaction 8.73 45.74 0.19 0.85
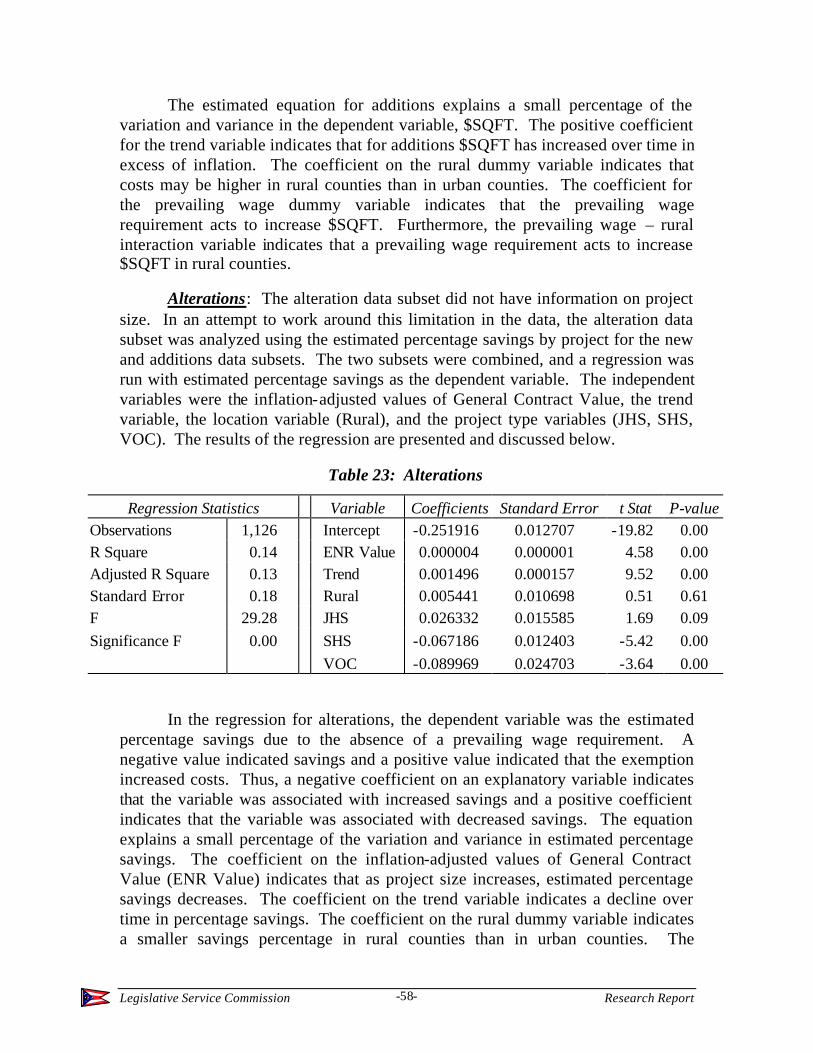
Legislative Service Commission Research Report -58-
The estimated equation for additions explains a small percentage of the variation and variance in the dependent variable, $SQFT. The positive coefficient for the trend variable indicates that for additions $SQFT has increased over time in excess of inflation. The coefficient on the rural dummy variable indicates that costs may be higher in rural counties than in urban counties. The coefficient for the prevailing wage dummy variable indicates that the prevailing wage requirement acts to increase $SQFT. Furthermore, the prevailing wage – rural interaction variable indicates that a prevailing wage requirement acts to increase $SQFT in rural counties.
Alterations: The alteration data subset did not have information on project size. In an attempt to work around this limitation in the data, the alteration data subset was analyzed using the estimated percentage savings by project for the new and additions data subsets. The two subsets were combined, and a regression was run with estimated percentage savings as the dependent variable. The independent variables were the inflation-adjusted values of General Contract Value, the trend variable, the location variable (Rural), and the project type variables (JHS, SHS, VOC). The results of the regression are presented and discussed below.
Table 23: Alterations
Regression Statistics Variable Coefficients Standard Error t Stat P-value Observations 1,126 Intercept -0.251916 0.012707 -19.82 0.00 R Square 0.14 ENR Value 0.000004 0.000001 4.58 0.00 Adjusted R Square 0.13 Trend 0.001496 0.000157 9.52 0.00 Standard Error 0.18 Rural 0.005441 0.010698 0.51 0.61 F 29.28 JHS 0.026332 0.015585 1.69 0.09 Significance F 0.00 SHS -0.067186 0.012403 -5.42 0.00 VOC -0.089969 0.024703 -3.64 0.00
In the regression for alterations, the dependent variable was the estimated percentage savings due to the absence of a prevailing wage requirement. A negative value indicated savings and a positive value indicated that the exemption increased costs. Thus, a negative coefficient on an explanatory variable indicates that the variable was associated with increased savings and a positive coefficient indicates that the variable was associated with decreased savings. The equation explains a small percentage of the variation and variance in estimated percentage savings. The coefficient on the inflation-adjusted values of General Contract Value (ENR Value) indicates that as project size increases, estimated percentage savings decreases. The coefficient on the trend variable indicates a decline over time in percentage savings. The coefficient on the rural dummy variable indicates a smaller savings percentage in rural counties than in urban counties. The
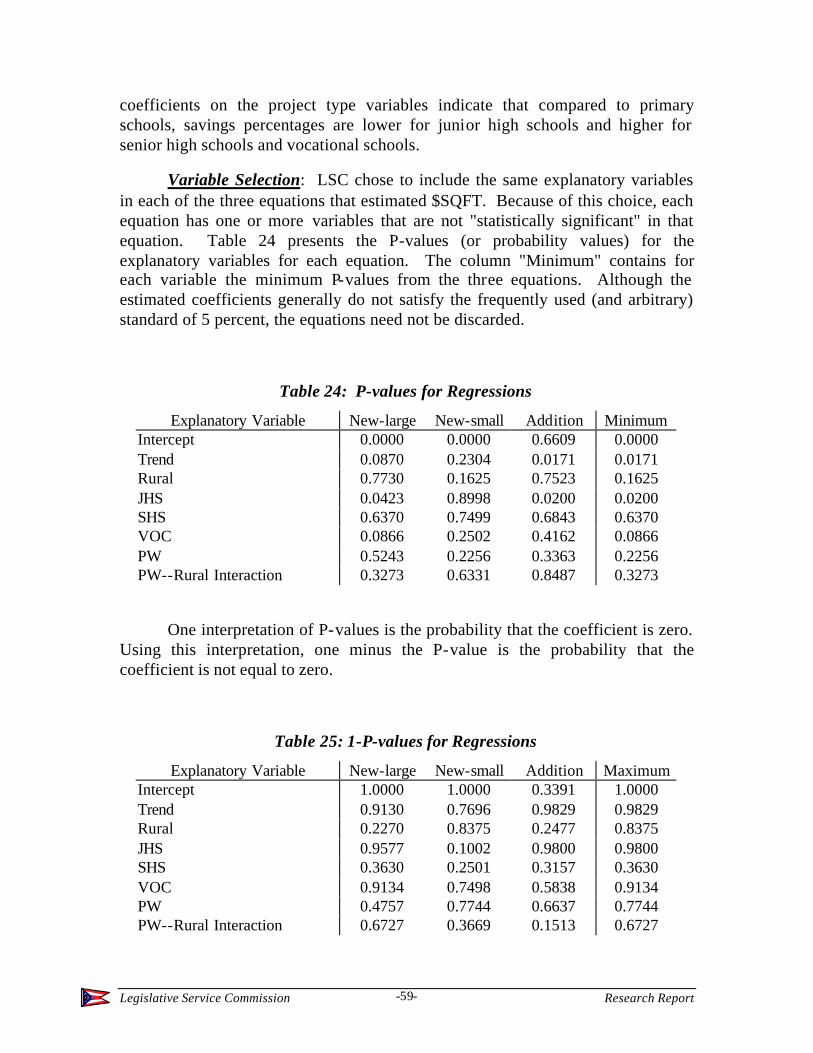
Legislative Service Commission Research Report -59-
coefficients on the project type variables indicate that compared to primary schools, savings percentages are lower for junior high schools and higher for senior high schools and vocational schools.
Variable Selection: LSC chose to include the same explanatory variables in each of the three equations that estimated $SQFT. Because of this choice, each equation has one or more variables that are not "statistically significant" in that equation. Table 24 presents the P-values (or probability values) for the explanatory variables for each equation. The column "Minimum" contains for each variable the minimum P-values from the three equations. Although the estimated coefficients generally do not satisfy the frequently used (and arbitrary) standard of 5 percent, the equations need not be discarded.
Table 24: P-values for Regressions
Explanatory Variable New-large New-small Addition Minimum Intercept 0.0000 0.0000 0.6609 0.0000 Trend 0.0870 0.2304 0.0171 0.0171 Rural 0.7730 0.1625 0.7523 0.1625 JHS 0.0423 0.8998 0.0200 0.0200 SHS 0.6370 0.7499 0.6843 0.6370 VOC 0.0866 0.2502 0.4162 0.0866 PW 0.5243 0.2256 0.3363 0.2256 PW--Rural Interaction 0.3273 0.6331 0.8487 0.3273
One interpretation of P-values is the probability that the coefficient is zero. Using this interpretation, one minus the P-value is the probability that the coefficient is not equal to zero.
Table 25: 1-P-values for Regressions
Explanatory Variable New-large New-small Addition Maximum Intercept 1.0000 1.0000 0.3391 1.0000 Trend 0.9130 0.7696 0.9829 0.9829 Rural 0.2270 0.8375 0.2477 0.8375 JHS 0.9577 0.1002 0.9800 0.9800 SHS 0.3630 0.2501 0.3157 0.3630 VOC 0.9134 0.7498 0.5838 0.9134 PW 0.4757 0.7744 0.6637 0.7744 PW--Rural Interaction 0.6727 0.3669 0.1513 0.6727
Legislative Service Commission Research Report -60-
The question of variable significance may be a non-issue. The data analyzed may be thought of as a population, not a sample. Significance tests deal with sampling error. If an analyst is working with the population of data, there is no sample and no sampling error. Therefore, significance tests are not necessary. This may be acceptable if inference is not the goal of the analysis. The results apply to the data set analyzed and that data set only. If the results are to be applied outside of the data set used to calculate the regression equation, then the data set must be treated as a sample and statistical significance is a relevant concern.
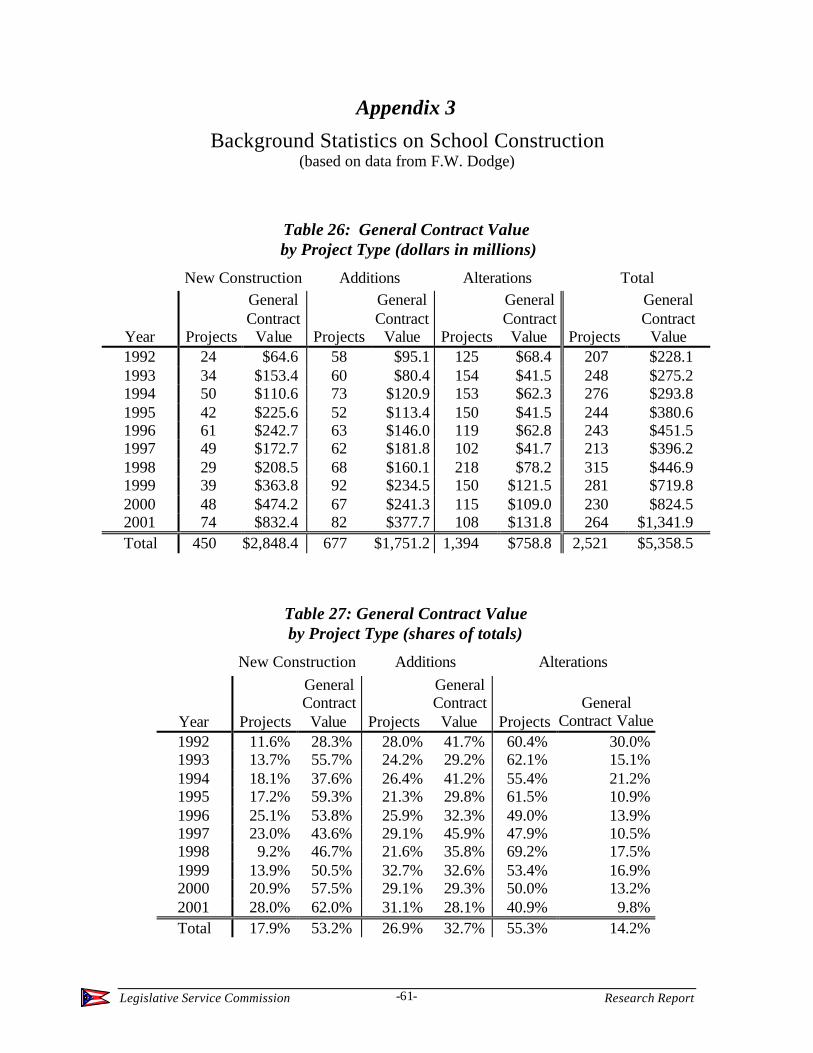
Legislative Service Commission Research Report -61-
Appendix 3
Background Statistics on School Construction (based on data from F.W. Dodge)
Table 26: General Contract Value by Project Type (dollars in millions)
New Construction Additions Alterations Total
Year Projects
General Contract
Value Projects
General Contract
Value Projects
General Contract Value Projects
General Contract
Value 1992 24 $64.6 58 $95.1 125 $68.4 207 $228.1 1993 34 $153.4 60 $80.4 154 $41.5 248 $275.2 1994 50 $110.6 73 $120.9 153 $62.3 276 $293.8 1995 42 $225.6 52 $113.4 150 $41.5 244 $380.6 1996 61 $242.7 63 $146.0 119 $62.8 243 $451.5 1997 49 $172.7 62 $181.8 102 $41.7 213 $396.2 1998 29 $208.5 68 $160.1 218 $78.2 315 $446.9 1999 39 $363.8 92 $234.5 150 $121.5 281 $719.8 2000 48 $474.2 67 $241.3 115 $109.0 230 $824.5 2001 74 $832.4 82 $377.7 108 $131.8 264 $1,341.9 Total 450 $2,848.4 677 $1,751.2 1,394 $758.8 2,521 $5,358.5
Table 27: General Contract Value by Project Type (shares of totals)
New Construction Additions Alterations
Year Projects
General Contract Value Projects
General Contract Value Projects
General Contract Value
1992 11.6% 28.3% 28.0% 41.7% 60.4% 30.0% 1993 13.7% 55.7% 24.2% 29.2% 62.1% 15.1% 1994 18.1% 37.6% 26.4% 41.2% 55.4% 21.2% 1995 17.2% 59.3% 21.3% 29.8% 61.5% 10.9% 1996 25.1% 53.8% 25.9% 32.3% 49.0% 13.9% 1997 23.0% 43.6% 29.1% 45.9% 47.9% 10.5% 1998 9.2% 46.7% 21.6% 35.8% 69.2% 17.5% 1999 13.9% 50.5% 32.7% 32.6% 53.4% 16.9% 2000 20.9% 57.5% 29.1% 29.3% 50.0% 13.2% 2001 28.0% 62.0% 31.1% 28.1% 40.9% 9.8% Total 17.9% 53.2% 26.9% 32.7% 55.3% 14.2%
Legislative Service Commission Research Report -62-
Table 28: General Contract Value by Location (dollars in millions)
Urban Rural Total
Year Projects
General Contract
Value Projects
General Contract Value Projects
General Contract Value
1992 141 $130.9 66 $97.2 207 $228.1 1993 189 $243.7 59 $31.6 248 $275.2 1994 200 $208.2 76 $85.5 276 $293.8 1995 177 $340.9 67 $39.7 244 $380.6 1996 181 $297.5 62 $154.0 243 $451.5 1997 168 $312.6 45 $83.6 213 $396.2 1998 198 $332.0 117 $114.9 315 $446.9 1999 192 $462.5 89 $257.3 281 $719.8 2000 172 $551.4 58 $273.2 230 $824.5 2001 186 $851.1 78 $490.8 264 $1,341.9 Total 1,804 $3,730.8 717 $1,627.7 2,521 $5,358.5
Table 29: General Contract Value by Location (shares of totals)
Urban Rural
Year Projects
General Contract
Value Projects
General Contract Value
1992 68.1% 57.4% 31.9% 42.6% 1993 76.2% 88.5% 23.8% 11.5% 1994 72.5% 70.9% 27.5% 29.1% 1995 72.5% 89.6% 27.5% 10.4% 1996 74.5% 65.9% 25.5% 34.1% 1997 78.9% 78.9% 21.1% 21.1% 1998 62.9% 74.3% 37.1% 25.7% 1999 68.3% 64.3% 31.7% 35.7% 2000 74.8% 66.9% 25.2% 33.1% 2001 70.5% 63.4% 29.5% 36.6% Total 71.6% 69.6% 28.4% 30.4%
Legislative Service Commission Research Report -63-
Table 30: General Contract Value Urban Projects by Type (dollars in millions)
New Construction Additions Alterations Total
Year Projects
General Contract Value Projects
General Contract
Value Projects
General Contract Value Projects
General Contract
Value 1992 13 $25.8 34 $43.3 94 $61.8 141 $130.9 1993 24 $135.9 45 $70.2 120 $37.5 189 $243.7 1994 32 $65.4 52 $93.4 116 $49.4 200 $208.2 1995 31 $208.5 39 $100.2 107 $32.2 177 $340.9 1996 38 $148.3 44 $108.4 99 $40.7 181 $297.5 1997 38 $137.5 41 $136.3 89 $38.9 168 $312.6 1998 19 $152.4 48 $131.4 131 $48.2 198 $332.0 1999 24 $209.2 63 $172.1 105 $81.2 192 $462.5 2000 30 $286.5 48 $190.8 94 $74.1 172 $551.4 2001 45 $525.9 51 $241.2 90 $84.1 186 $851.1 Total 294 $1,895.4 465 $1,287.3 1,045 $548.1 1,804 $3,730.8
Table 31: General Contract Value Urban Projects by Type (shares of totals)
New Construction Additions Alterations
Year Projects
General Contract Value Projects
General Contract
Value Projects
General Contract Value
1992 9.2% 19.7% 24.1% 33.1% 66.7% 47.2% 1993 12.7% 55.8% 23.8% 28.8% 63.5% 15.4% 1994 16.0% 31.4% 26.0% 44.9% 58.0% 23.7% 1995 17.5% 61.2% 22.0% 29.4% 60.5% 9.5% 1996 21.0% 49.9% 24.3% 36.4% 54.7% 13.7% 1997 22.6% 44.0% 24.4% 43.6% 53.0% 12.4% 1998 9.6% 45.9% 24.2% 39.6% 66.2% 14.5% 1999 12.5% 45.2% 32.8% 37.2% 54.7% 17.6% 2000 17.4% 52.0% 27.9% 34.6% 54.7% 13.4% 2001 24.2% 61.8% 27.4% 28.3% 48.4% 9.9% Total 16.3% 50.8% 25.8% 34.5% 57.9% 14.7%
Legislative Service Commission Research Report -64-
Table 32: General Contract Value Rural Projects by Type (dollars in millions)
New Construction Additions Alterations Total
Year Projects
General Contract Value Projects
General Contract Value Projects
General Contract Value Projects
General Contract
Value 1992 11 $38.8 24 $51.7 31 $6.7 66 $97.2 1993 10 $17.5 15 $10.2 34 $3.9 59 $31.6 1994 18 $45.2 21 $27.5 37 $12.9 76 $85.5 1995 11 $17.1 13 $13.2 43 $9.3 67 $39.7 1996 23 $94.4 19 $37.6 20 $22.0 62 $154.0 1997 11 $35.3 21 $45.5 13 $2.8 45 $83.6 1998 10 $56.1 20 $28.7 87 $30.1 117 $114.9 1999 15 $154.6 29 $62.4 45 $40.3 89 $257.3 2000 18 $187.6 19 $50.6 21 $34.9 58 $273.2 2001 29 $306.5 31 $136.6 18 $47.7 78 $490.8 Total 156 $953.0 212 $464.0 349 $210.7 717 $1,627.7
Table 33: General Contract Value Rural Projects by Type (shares of totals)
New Construction Additions Alterations
Year Projects
General Contract
Value Projects
General Contract
Value Projects
General Contract
Value 1992 16.7% 39.9% 36.4% 53.2% 47.0% 6.9% 1993 16.9% 55.4% 25.4% 32.2% 57.6% 12.4% 1994 23.7% 52.8% 27.6% 32.1% 48.7% 15.1% 1995 16.4% 43.2% 19.4% 33.4% 64.2% 23.4% 1996 37.1% 61.3% 30.6% 24.4% 32.3% 14.3% 1997 24.4% 42.2% 46.7% 54.5% 28.9% 3.4% 1998 8.5% 48.8% 17.1% 25.0% 74.4% 26.2% 1999 16.9% 60.1% 32.6% 24.2% 50.6% 15.7% 2000 31.0% 68.7% 32.8% 18.5% 36.2% 12.8% 2001 37.2% 62.4% 39.7% 27.8% 23.1% 9.7% Total 21.8% 58.5% 29.6% 28.5% 48.7% 12.9%
Legislative Service Commission Research Report -65-
Table 34: General Contract Value New Construction by Location (dollars in millions)
Urban Rural Total
Year Projects
General Contract
Value Projects
General Contract
Value Projects
General Contract
Value 1992 13 $25.8 11 $38.8 24 $64.6 1993 24 $135.9 10 $17.5 34 $153.4 1994 32 $65.4 18 $45.2 50 $110.6 1995 31 $208.5 11 $17.1 42 $225.6 1996 38 $148.3 23 $94.4 61 $242.7 1997 38 $137.5 11 $35.3 49 $172.7 1998 19 $152.4 10 $56.1 29 $208.5 1999 24 $209.2 15 $154.6 39 $363.8 2000 30 $286.5 18 $187.6 48 $474.2 2001 45 $525.9 29 $306.5 74 $832.4 Total 294 $1,895.4 156 $953.0 450 $2,848.4
Table 35: General Contract Value New Construction by Location (shares of totals)
Urban Rural
Year Projects
General Contract Value Projects
General Contract Value
1992 54.2% 39.9% 45.8% 60.1% 1993 70.6% 88.6% 29.4% 11.4% 1994 64.0% 59.2% 36.0% 40.8% 1995 73.8% 92.4% 26.2% 7.6% 1996 62.3% 61.1% 37.7% 38.9% 1997 77.6% 79.6% 22.4% 20.4% 1998 65.5% 73.1% 34.5% 26.9% 1999 61.5% 57.5% 38.5% 42.5% 2000 62.5% 60.4% 37.5% 39.6% 2001 60.8% 63.2% 39.2% 36.8% Total 65.3% 66.5% 34.7% 33.5%
Legislative Service Commission Research Report -66-
Table 36: General Contract Value Additions by Location (dollars in millions)
Urban Rural Total
Year Projects
General Contract
Value Projects
General Contract Value Projects
General Contract
Value 1992 34 $43.3 24 $51.7 58 $95.1 1993 45 $70.2 15 $10.2 60 $80.4 1994 52 $93.4 21 $27.5 73 $120.9 1995 39 $100.2 13 $13.2 52 $113.4 1996 44 $108.4 19 $37.6 63 $146.0 1997 41 $136.3 21 $45.5 62 $181.8 1998 48 $131.4 20 $28.7 68 $160.1 1999 63 $172.1 29 $62.4 92 $234.5 2000 48 $190.8 19 $50.6 67 $241.3 2001 51 $241.2 31 $136.6 82 $377.7 Total 465 $1,287.3 212 $464.0 677 $1,751.2
Table 37: General Contract Value Additions by Location (shares of totals)
Urban Rural
Year Projects
General Contract Value Projects
General Contract
Value 1992 58.6% 45.6% 41.4% 54.4% 1993 75.0% 87.4% 25.0% 12.6% 1994 71.2% 77.3% 28.8% 22.7% 1995 75.0% 88.3% 25.0% 11.7% 1996 69.8% 74.3% 30.2% 25.7% 1997 66.1% 75.0% 33.9% 25.0% 1998 70.6% 82.1% 29.4% 17.9% 1999 68.5% 73.4% 31.5% 26.6% 2000 71.6% 79.0% 28.4% 21.0% 2001 62.2% 63.8% 37.8% 36.2% Total 68.7% 73.5% 31.3% 26.5%
Legislative Service Commission Research Report -67-
Table 38: General Contract Value Alterations by Location (dollars in millions)
Urban Rural Total
Year Projects
General Contract
Value Projects
General Contract Value Projects
General Contract
Value 1992 94 $61.8 31 $6.7 125 $68.4 1993 120 $37.5 34 $3.9 154 $41.5 1994 116 $49.4 37 $12.9 153 $62.3 1995 107 $32.2 43 $9.3 150 $41.5 1996 99 $40.7 20 $22.0 119 $62.8 1997 89 $38.9 13 $2.8 102 $41.7 1998 131 $48.2 87 $30.1 218 $78.2 1999 105 $81.2 45 $40.3 150 $121.5 2000 94 $74.1 21 $34.9 115 $109.0 2001 90 $84.1 18 $47.7 108 $131.8 Total 1,045 $548.1 349 $210.7 1,394 $758.8
Table 39: General Contract Value Alterations by Location (shares of totals)
Urban Rural
Year Projects
General Contract Value Projects
General Contract
Value 1992 75.2% 90.3% 24.8% 9.7% 1993 77.9% 90.5% 22.1% 9.5% 1994 75.8% 79.3% 24.2% 20.7% 1995 71.3% 77.6% 28.7% 22.4% 1996 83.2% 64.9% 16.8% 35.1% 1997 87.3% 93.2% 12.7% 6.8% 1998 60.1% 61.6% 39.9% 38.4% 1999 70.0% 66.8% 30.0% 33.2% 2000 81.7% 67.9% 18.3% 32.1% 2001 83.3% 63.8% 16.7% 36.2% Total 75.0% 72.2% 25.0% 27.8%
Legislative Service Commission Research Report -68-
Appendix 4
Wage Data from the Current Population Survey
An earlier section discussed trends in the Ohio construction industry using information from the Bureau of Labor Statistics. Information was available for the broad categories "Construction" and "Special Trades Contractors." This section makes use of information collected through the Current Population Survey to provide some detail about wages for specific trades.
The Current Population Survey (CPS) is a monthly survey of about 50,000 households conducted by the Bureau of the Census for the Bureau of Labor Statistics. The survey is conducted through a scientifically selected sample designed to represent the civilian noninstitutional population. The survey provides estimates for the nation as a whole and serves as part of model-based estimates for individual states and other geographic areas. Estimates obtained from the CPS include employment, unemployment, earnings, hours of work, and other indicators. They are available by a variety of demographic characteristics including age, sex, race, marital status, and educational attainment. They are also available by occupation, industry, and class of worker.
LSC was able to obtain micro-level data from the CPS using the Federal Electronic Research and Review Extraction Tool (FERRET). Through FERRET, LSC was able to extract information from the survey responses of Ohio construction workers. Data was obtained for the years 1994 through 2001. Although the data obtained was from a scientifically selected sample designed to represent the national civilian noninstitutional population, the data obtained is not a representative sample of Ohio construction workers. Nevertheless, the data does provide information about Ohio construction wages by trades before and after the prevailing wage exemption.
The information obtained included the individual's hourly pay rate, union membership status, and industry code. Hourly pay rate was inflated to December 2001. Tables 40, 41, and 42 present a breakdown of inflation adjusted pay rates by union status and industry code before (pre exemption) and after (post exemption) August 1997. Table 43 presents a similar breakdown of the union wage premium.64
No claims of causality can be made, but the tables are generally in line with the findings of the Kessler and Katz paper. The data indicate a decline in real (inflation adjusted) construction wages. Construction wages were 5.7 percent
64 The union wage premium is the percent by which the wages of union members in a given occupation exceed the wages of non-members.
Legislative Service Commission Research Report -69-
lower in the post-exemption period. Union wages were 7.8 percent lower and non-union wages were 1.2 percent lower. The average union wage premium fell from 57.8 percent to 47.3 percent.
Table 44 provides information on the number of observations used in constructing the other tables. As mentioned above, the data obtained through the FERRET was from a scientifically selected sample designed to represent the national noninstitutional population. The data obtained is not a representative sample of Ohio construction workers. This accounts for the difference between the growth in real wages reported in the BLS data and the decline in real wages reported in the data obtained through the FERRET. Additionally, many of the cells in Table 44 have small numbers indicating that the averages in the other tables are based on a small number of observations. The data provide some information, but are not without weaknesses, so any conclusions are tentative and must be interpreted with caution.
The data extracted from the CPS is not a representative sample of Ohio construction workers, but it does describe the experiences of some Ohio construction workers before and after the exemption. The data indicate a general decline in real (inflation adjusted) construction wages. This is different from the evidence presented in the Ohio data from the Bureau of Labor Statistics. That data is from surveys designed to yield results representative of Ohio. The CPS data obtained by LSC is not representative of Ohio, but indicates the experiences of some individuals in Ohio. In the CPS data, workers indicating a union affiliation experienced a greater decline, although this was not necessarily true for specific union workers. The union wage premium for Ohio construction workers in general also declined; although, again it did not decline for workers in all trades. As with the data from the Bureau of Labor Statistics, it is not possible to discern a specific impact on school construction workers.
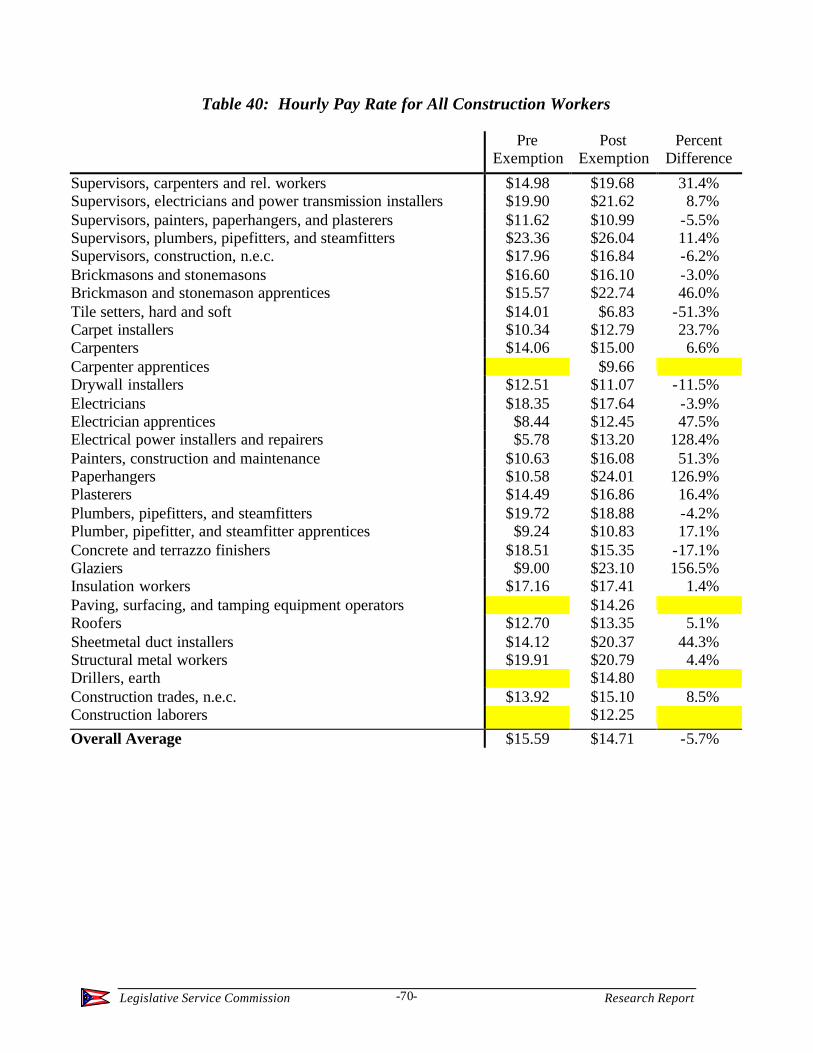
Legislative Service Commission Research Report -70-
Table 40: Hourly Pay Rate for All Construction Workers
Pre
Exemption Post
Exemption Percent
Difference
Supervisors, carpenters and rel. workers $14.98 $19.68 31.4% Supervisors, electricians and power transmission installers $19.90 $21.62 8.7% Supervisors, painters, paperhangers, and plasterers $11.62 $10.99 -5.5% Supervisors, plumbers, pipefitters, and steamfitters $23.36 $26.04 11.4% Supervisors, construction, n.e.c. $17.96 $16.84 -6.2% Brickmasons and stonemasons $16.60 $16.10 -3.0% Brickmason and stonemason apprentices $15.57 $22.74 46.0% Tile setters, hard and soft $14.01 $6.83 -51.3% Carpet installers $10.34 $12.79 23.7% Carpenters $14.06 $15.00 6.6% Carpenter apprentices $9.66 Drywall installers $12.51 $11.07 -11.5% Electricians $18.35 $17.64 -3.9% Electrician apprentices $8.44 $12.45 47.5% Electrical power installers and repairers $5.78 $13.20 128.4% Painters, construction and maintenance $10.63 $16.08 51.3% Paperhangers $10.58 $24.01 126.9% Plasterers $14.49 $16.86 16.4% Plumbers, pipefitters, and steamfitters $19.72 $18.88 -4.2% Plumber, pipefitter, and steamfitter apprentices $9.24 $10.83 17.1% Concrete and terrazzo finishers $18.51 $15.35 -17.1% Glaziers $9.00 $23.10 156.5% Insulation workers $17.16 $17.41 1.4% Paving, surfacing, and tamping equipment operators $14.26 Roofers $12.70 $13.35 5.1% Sheetmetal duct installers $14.12 $20.37 44.3% Structural metal workers $19.91 $20.79 4.4% Drillers, earth $14.80 Construction trades, n.e.c. $13.92 $15.10 8.5% Construction laborers $12.25 Overall Average $15.59 $14.71 -5.7%
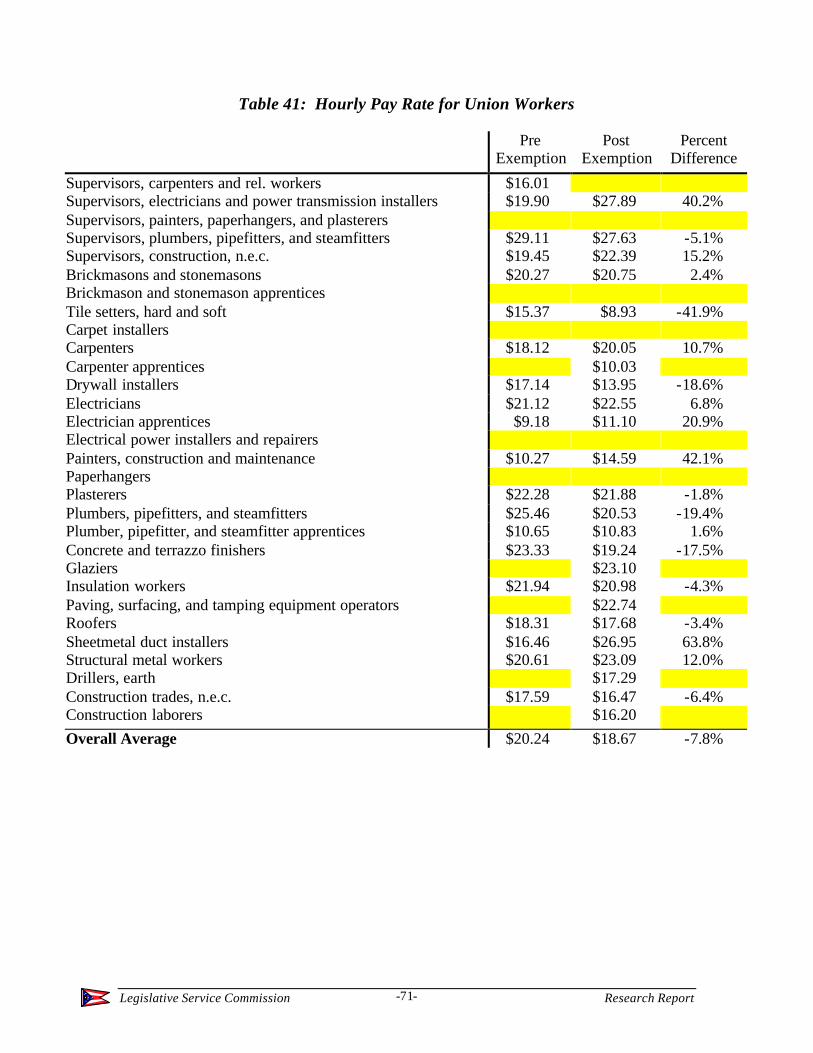
Legislative Service Commission Research Report -71-
Table 41: Hourly Pay Rate for Union Workers
Pre
Exemption Post
Exemption Percent
Difference
Supervisors, carpenters and rel. workers $16.01 Supervisors, electricians and power transmission installers $19.90 $27.89 40.2% Supervisors, painters, paperhangers, and plasterers Supervisors, plumbers, pipefitters, and steamfitters $29.11 $27.63 -5.1% Supervisors, construction, n.e.c. $19.45 $22.39 15.2% Brickmasons and stonemasons $20.27 $20.75 2.4% Brickmason and stonemason apprentices Tile setters, hard and soft $15.37 $8.93 -41.9% Carpet installers Carpenters $18.12 $20.05 10.7% Carpenter apprentices $10.03 Drywall installers $17.14 $13.95 -18.6% Electricians $21.12 $22.55 6.8% Electrician apprentices $9.18 $11.10 20.9% Electrical power installers and repairers Painters, construction and maintenance $10.27 $14.59 42.1% Paperhangers Plasterers $22.28 $21.88 -1.8% Plumbers, pipefitters, and steamfitters $25.46 $20.53 -19.4% Plumber, pipefitter, and steamfitter apprentices $10.65 $10.83 1.6% Concrete and terrazzo finishers $23.33 $19.24 -17.5% Glaziers $23.10 Insulation workers $21.94 $20.98 -4.3% Paving, surfacing, and tamping equipment operators $22.74 Roofers $18.31 $17.68 -3.4% Sheetmetal duct installers $16.46 $26.95 63.8% Structural metal workers $20.61 $23.09 12.0% Drillers, earth $17.29 Construction trades, n.e.c. $17.59 $16.47 -6.4% Construction laborers $16.20 Overall Average $20.24 $18.67 -7.8%
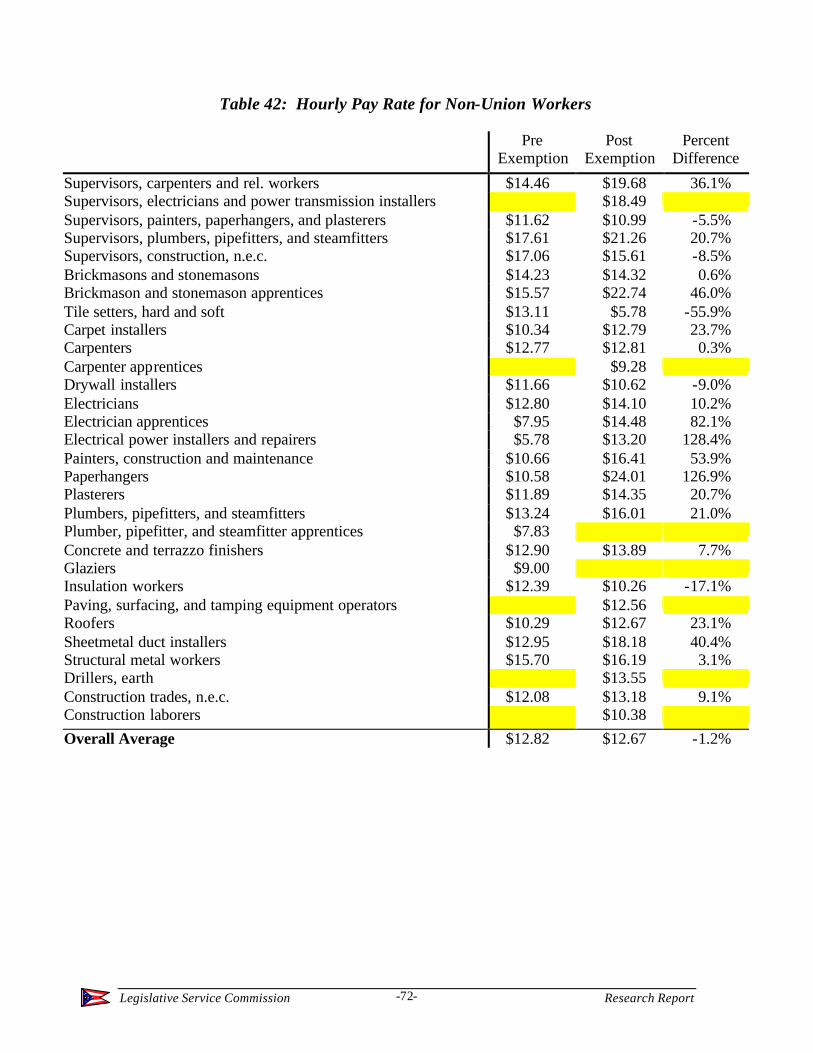
Legislative Service Commission Research Report -72-
Table 42: Hourly Pay Rate for Non-Union Workers
Pre
Exemption Post
Exemption Percent
Difference
Supervisors, carpenters and rel. workers $14.46 $19.68 36.1% Supervisors, electricians and power transmission installers $18.49 Supervisors, painters, paperhangers, and plasterers $11.62 $10.99 -5.5% Supervisors, plumbers, pipefitters, and steamfitters $17.61 $21.26 20.7% Supervisors, construction, n.e.c. $17.06 $15.61 -8.5% Brickmasons and stonemasons $14.23 $14.32 0.6% Brickmason and stonemason apprentices $15.57 $22.74 46.0% Tile setters, hard and soft $13.11 $5.78 -55.9% Carpet installers $10.34 $12.79 23.7% Carpenters $12.77 $12.81 0.3% Carpenter apprentices $9.28 Drywall installers $11.66 $10.62 -9.0% Electricians $12.80 $14.10 10.2% Electrician apprentices $7.95 $14.48 82.1% Electrical power installers and repairers $5.78 $13.20 128.4% Painters, construction and maintenance $10.66 $16.41 53.9% Paperhangers $10.58 $24.01 126.9% Plasterers $11.89 $14.35 20.7% Plumbers, pipefitters, and steamfitters $13.24 $16.01 21.0% Plumber, pipefitter, and steamfitter apprentices $7.83 Concrete and terrazzo finishers $12.90 $13.89 7.7% Glaziers $9.00 Insulation workers $12.39 $10.26 -17.1% Paving, surfacing, and tamping equipment operators $12.56 Roofers $10.29 $12.67 23.1% Sheetmetal duct installers $12.95 $18.18 40.4% Structural metal workers $15.70 $16.19 3.1% Drillers, earth $13.55 Construction trades, n.e.c. $12.08 $13.18 9.1% Construction laborers $10.38 Overall Average $12.82 $12.67 -1.2%
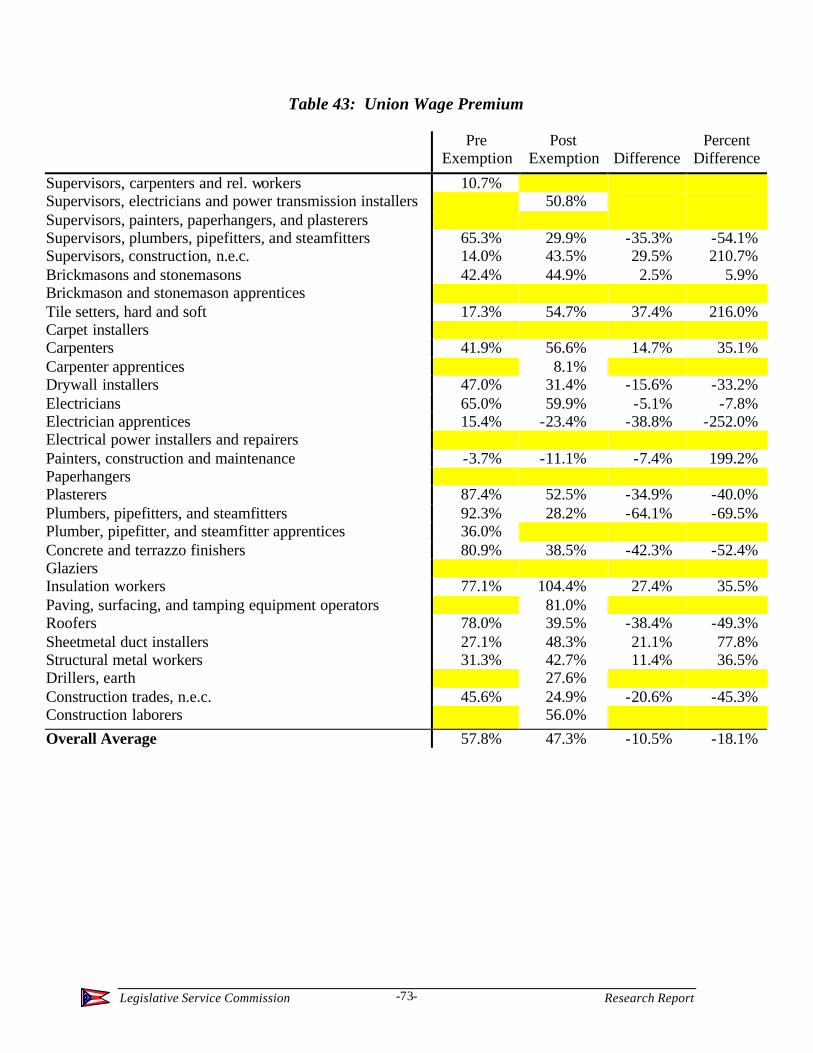
Legislative Service Commission Research Report -73-
Table 43: Union Wage Premium
Pre
Exemption Post
Exemption Difference Percent
Difference
Supervisors, carpenters and rel. workers 10.7% Supervisors, electricians and power transmission installers 50.8% Supervisors, painters, paperhangers, and plasterers Supervisors, plumbers, pipefitters, and steamfitters 65.3% 29.9% -35.3% -54.1% Supervisors, construction, n.e.c. 14.0% 43.5% 29.5% 210.7% Brickmasons and stonemasons 42.4% 44.9% 2.5% 5.9% Brickmason and stonemason apprentices Tile setters, hard and soft 17.3% 54.7% 37.4% 216.0% Carpet installers Carpenters 41.9% 56.6% 14.7% 35.1% Carpenter apprentices 8.1% Drywall installers 47.0% 31.4% -15.6% -33.2% Electricians 65.0% 59.9% -5.1% -7.8% Electrician apprentices 15.4% -23.4% -38.8% -252.0% Electrical power installers and repairers Painters, construction and maintenance -3.7% -11.1% -7.4% 199.2% Paperhangers Plasterers 87.4% 52.5% -34.9% -40.0% Plumbers, pipefitters, and steamfitters 92.3% 28.2% -64.1% -69.5% Plumber, pipefitter, and steamfitter apprentices 36.0% Concrete and terrazzo finishers 80.9% 38.5% -42.3% -52.4% Glaziers Insulation workers 77.1% 104.4% 27.4% 35.5% Paving, surfacing, and tamping equipment operators 81.0% Roofers 78.0% 39.5% -38.4% -49.3% Sheetmetal duct installers 27.1% 48.3% 21.1% 77.8% Structural metal workers 31.3% 42.7% 11.4% 36.5% Drillers, earth 27.6% Construction trades, n.e.c. 45.6% 24.9% -20.6% -45.3% Construction laborers 56.0% Overall Average 57.8% 47.3% -10.5% -18.1%
Legislative Service Commission Research Report -74-
Table 44: Number of Observations
Pre-exemption Post-exemption Union Nonunion Combined Union Nonunion Combined
Supervisors, carpenters and rel. workers 1 2 3 1 1 Supervisors, electricians and power
transmission installers 3 3 1 2 3 Supervisors, painters, paperhangers, and
plasterers 2 2 1 1 Supervisors, plumbers, pipefitters, and
steamfitters 1 1 2 3 1 4 Supervisors, construction, n.e.c. 23 38 61 8 36 44 Brickmasons and stonemasons 9 14 23 5 13 18 Brickmason and stonemason apprentices 2 2 1 1 Tile setters, hard and soft 2 3 5 1 2 3 Carpet installers 6 6 1 1 Carpenters 30 94 124 43 99 142 Carpenter apprentices 2 2 4 Drywall installers 2 11 13 3 19 22 Electricians 34 17 51 31 43 74 Electrician apprentices 2 3 5 3 2 5 Electrical power installers and repairers 1 1 2 2 Painters, construction and maintenance 2 24 26 7 32 39 Paperhangers 1 1 1 1 Plasterers 1 3 4 1 2 3 Plumbers, pipefitters, and steamfitters 26 23 49 28 16 44 Plumber, pipefitter, and steamfitter
apprentices 2 2 4 3 3 Concrete and terrazzo finishers 7 6 13 3 8 11 Glaziers 1 1 1 1 Insulation workers 4 4 8 6 3 9 Paving, surfacing, and tamping
equipment operators 1 5 6 Roofers 12 28 40 5 32 37 Sheetmetal duct installers 1 2 3 1 3 4 Structural metal workers 12 2 14 8 4 12 Drillers, earth 1 2 3 Construction trades, n.e.c. 7 14 21 21 15 36 Construction laborers 85 180 265 Total 181 304 485 271 528 799
Legislative Service Commission Research Report -75-
Appendix 5
An Example of an Omitted Variable Regression Analysis Including SFC Funding
LSC used information available in the Annual Reports of the Ohio School Facilities Commission to create a dummy variable equal to 1 if a project received SFC funding and equal to 0 if it did not. Including this variable allows for the possible effect that receiving such funding may have on project cost. The Annual Report contained information on amounts distributed to school districts each year. The information included the county in which the district was located. The data LSC obtained from F.W. Dodge did not include district names, but did include county. The attempt to match-up the two sources of information was made difficult because the amounts distributed by SFC to a district may be used on more than one project that may have more than one starting date. Because of the possibility of over-identifying (designating a project as receiving SFC funding when it did not) or under-identifying (designating a project as not receiving SFC funding when it did) SFC projects, the results of the regression run with this variable were not used in the body of this report. They are presented here as an example of the effects of an omitted variable.
The regression including the SFC dummy variable was run on the new-large data subset only. Table 45, below, presents the coefficient estimates from that regression along with the estimates from the regression on the same data set without the SFC variable. The positive coefficient on the SFC variable indicates that School Facilities Commission funding is associated with higher project costs.
Table 45: Effect of Including SFC Variable
without SFC with SFC Change Intercept 86.64 86.43 -0.21 Trend 0.14 0.14 -0.01 Rural 0.98 -0.41 -1.40 JHS 6.78 6.70 -0.09 SHS 1.52 1.22 -0.29 VOC 15.17 15.48 0.31 SFC 3.56 PW 3.99 4.50 0.51 PW - Rural Interaction -5.54 -4.13 1.41
Including the SFC variable had small negative effects on the estimated coefficient for trend variable and the JHS variable and larger negative effects on the estimated coefficient for the Rural and SHS variables. Including the SFC
Legislative Service Commission Research Report -76-
variable increased the estimated coefficients on the PW variable and the interaction of the PW and Rural variables. These increases will act to increase the estimated savings due to the prevailing wage exemption. Table 46, below, presents the effect of the change in estimated coefficients on estimated savings.
Table 46: Effect of Estimated Savings
Year without SFC with SFC Change 1997 $1,451.5 $1,992.5 $540.9 1998 $4,282.3 $6,462.8 $2,180.5 1999 $3,131.4 $7,972.4 $4,841.0 2000 $4,622.3 $10,654.0 $6,031.7 2001 $12,204.0 $20,717.8 $8,513.8 Total $25,691.5 $47,799.4 $22,107.9
If the SFC variable is omitted, 85 out of the 164 new-large projects undertaken after the prevailing wage exemption are estimated to have savings. If the SFC variable is included, all 164 projects are estimated to have savings. This analysis suggests that omitting the SFC variable from the regression used in the main body of the report results in a savings estimate that is downwardly biased.