prevoca: how well can we forecast subtropical stratocumulus with regional and global models? matt...
Post on 22-Dec-2015
215 views
TRANSCRIPT

PreVOCA: How Well Can We Forecast Subtropical
Stratocumulus with Regional and Global Models?
Matt WyantRob Wood
Chris BrethertonRoberto Mechoso
with help from participating modeling groups,
Dave Leon (U Wyo), Rhea George (UW)

Outline
• Introduction to VOCALS and PreVOCA• PreVOCA Experiment Setup• Comparison of Mean Cloud and PBL Structure• Comparison of Diurnal Cycle• Conclusions and Future Directions

VOCALS
The VAMOS Ocean-Cloud-Atmosphere-Land Study• A multiyear study of boundary layer cloud, aerosol, and
upper ocean heat/constituent transport• WHOI stratus flux-reference buoy at 20S 85W (2000+)• Annual instrumented cruises in austral spring (starting
with EPIC 2001 stratocumulus cruise).• Regional Experiment (REx) in Oct.-Nov. 2008, including
4 aircraft based in northern Chile, two ships, coastal site
• Satellite data analysis of cloud properties• Atmosphere and ocean modeling (LES to global).

Southeast Pacific Climate - A Modeling Challenge
MODIS clouddroplet conc.
World’s most persistent subtropical low cloud regime.
Cloud-aerosol interaction
SST, clouds poorly simulated by GCMs

GOAL: Assess the forecast skill and biases of global/ regional model simulations of SE Pacific boundary-layer clouds and aerosols on diurnal and longer timescales.
WHAT? Daily hindcasts for October 2006 over the SE Pacific.
WHY? Learn how to optimally use Rex (Oct-Nov 2008), satellite and cruise data for model assessment and improvement.
WHO? 14 modeling groups using regional and global models, including climate models run in forecast mode.
WHEN? Data submission is complete; analysis in progress, journal submission early 2009.
www.atmos.washington.edu/~robwood/PreVOCA/index.html
PreVOCAPreVOCA
Modeling Challenges: How well can climate, forecast and regional models predict…
• Cloud type/boundary layer structure• Cloud thickness/cloud fraction• Aerosol concentration• Mesoscale cloud features (POCS)
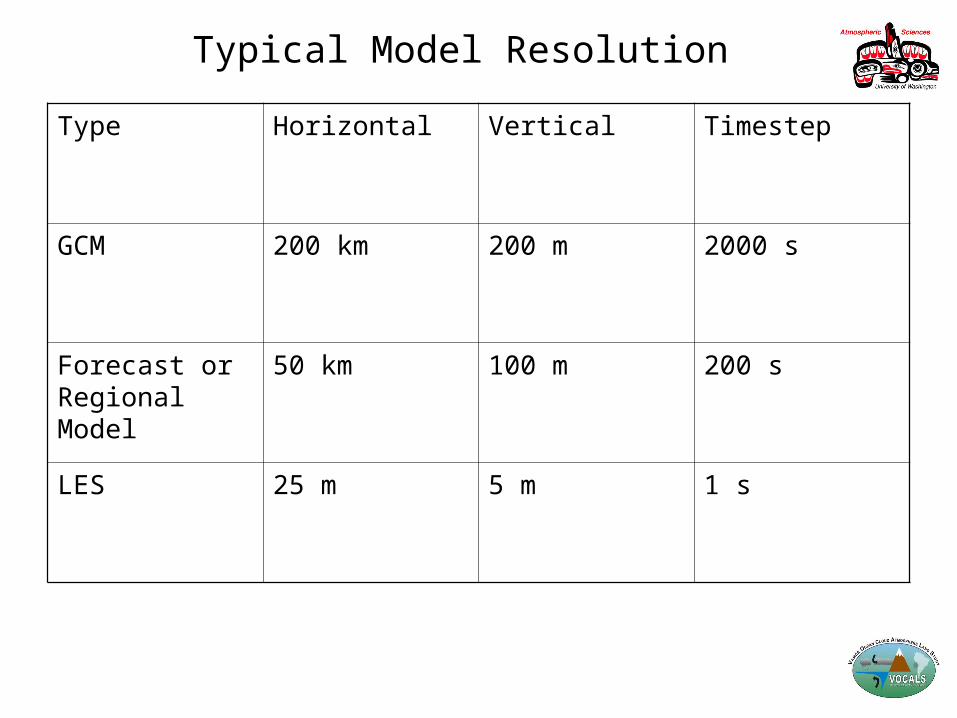
Typical Model Resolution
Type Horizontal Vertical Timestep
GCM 200 km 200 m 2000 s
Forecast or Regional Model
50 km 100 m 200 s
LES 25 m 5 m 1 s

Effects of modeling errorsError Type Effect
Cloud Fraction Surface and TOA radiation budgets → SST changes
Boundary Layer Depth and Structure
Surface fluxes, aerosol concentrations, wind profiles
LWP Radiation budgets, surface precipitation, aerosol processing
POCS Aerosol processing, radiation budgets

Pockets of Open Cells
(POCs)
200 km
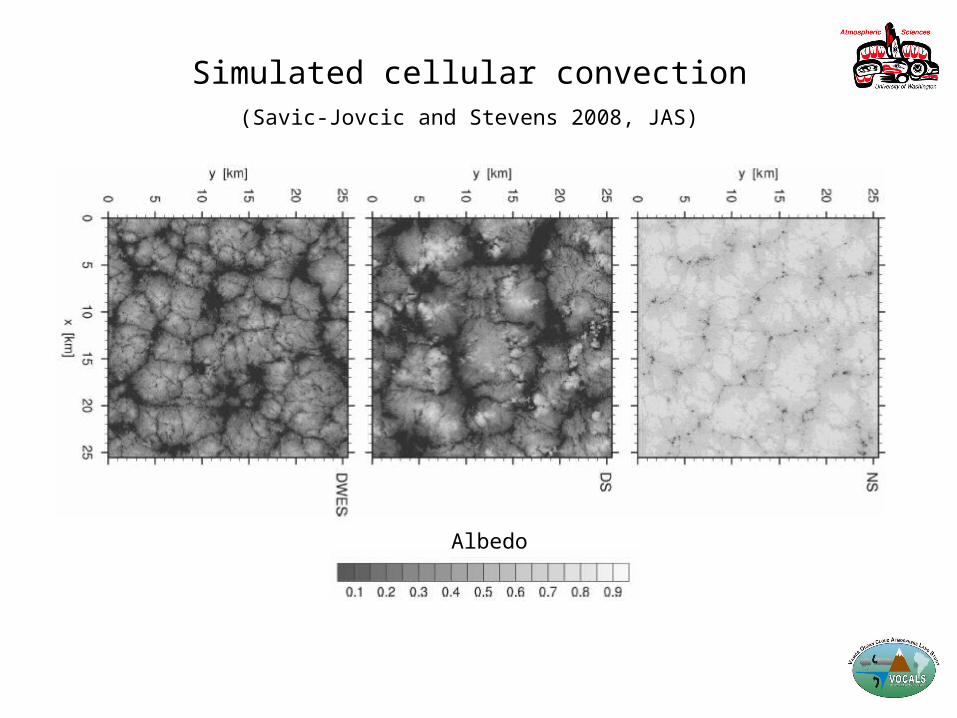
Albedo
Simulated cellular convection(Savic-Jovcic and Stevens 2008, JAS)
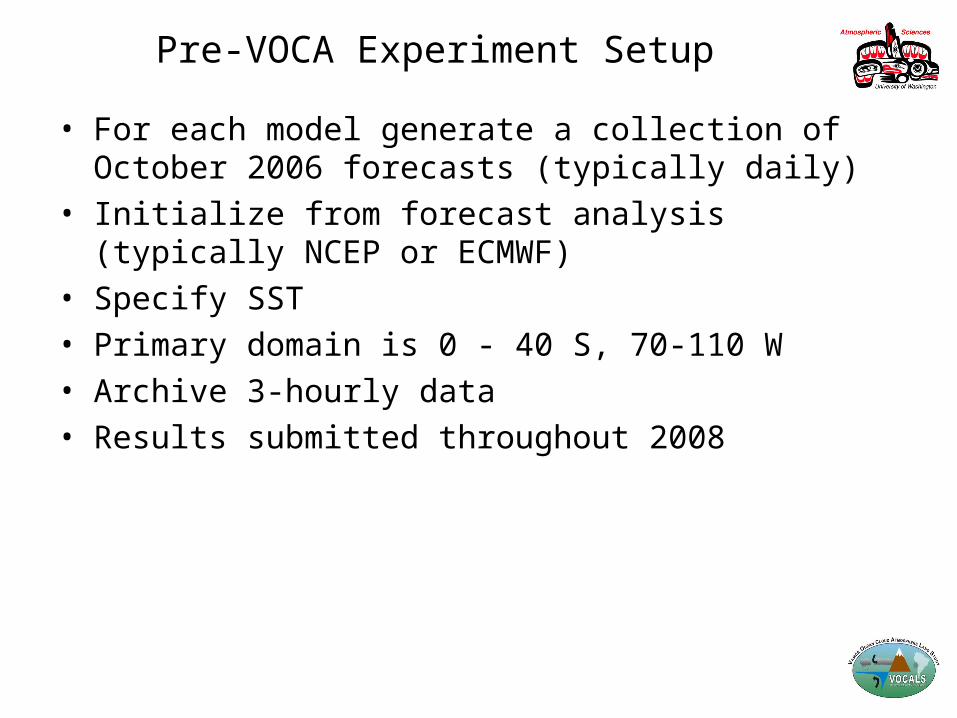
Pre-VOCA Experiment Setup
• For each model generate a collection of October 2006 forecasts (typically daily)
• Initialize from forecast analysis (typically NCEP or ECMWF)
• Specify SST• Primary domain is 0 - 40 S, 70-110 W • Archive 3-hourly data• Results submitted throughout 2008

Why Forecast Mode?
• Many model biases show up quickly (e.g. Phillips et al. 2004, Hannay et al 2008).
• Analyze before large-scale fields drift too far from reality.• Analyze after model adjusts to initialization.• In GCM’s this method is especially helpful (and cheap!)
in detecting cloud biases in situations where other model errors will compensate given enough time.

Available observational data
NOAA ESRL Stratus Cruises
Soundings, cloud-top, cloud-base, surface fluxes, drizzle properties, aerosols
ISCCP FD Radiative fluxes at surface, TOA
TMI LWP, WVP
AMSR LWP, WVP
MODIS Cloud fraction, optical depth, droplet size, cloud-top height
QuikSCAT Ocean surface winds
CALIPSO Cloud top height
COSMIC Temperature soundings
CloudSat Drizzle properties

Model Levels Resolution [km] (inner domain)
NRL COAMPS 42 81 (27)
COLA RSM 28 50
IPRC Reg_CM (IRAM) 28 ~25
LMDZ 38 50
PNNL (WRF-Chem) 44 45 (15)
UCLA (WRF) 34 45 (15)
U. Chile (WRF) 43 45
ECMWF oper. 3-12h forecast 91 ~25
ECMWF 5-day forecast 91 ~40
ECMWF coupled fcst ensemble 62 ~125
GMAO GEOS-5 DAS 72 ~56
JMA 24-30h forecast 60 ~60
NCEP oper. 12-36h forecast 64 ~38
UKMO oper. 12-36h forecast 50 ~40
NCAR CAM3.5/6 26/30 250
GFDL 24 250
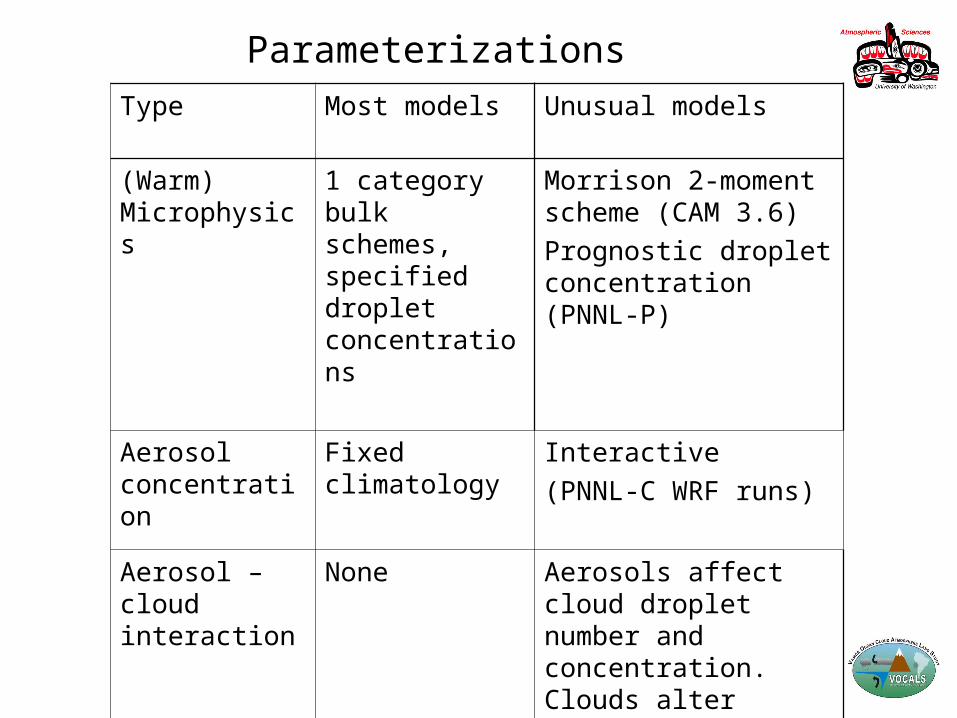
Parameterizations
Type Most models Unusual models
(Warm) Microphysics
1 category bulk schemes, specified droplet concentrations
Morrison 2-moment scheme (CAM 3.6)
Prognostic droplet concentration (PNNL-P)
Aerosol concentration
Fixed climatology
Interactive
(PNNL-C WRF runs)
Aerosol – cloud interaction
None Aerosols affect cloud droplet number and concentration. Clouds alter aerosol size and composition (PNNL-C )

Parameterizations (continued)
Type Methods
Turbulence K-profile schemes (mostly non-local) or TKE schemes
Shallow Convection varied
PBL-top Interactive with radiation or diagnosed or not treated explicitly
Cloud-fraction Function of relative humidity or static stability or determined from cloud/BL/convective scheme.

QuikSCAT winds [m s-1]
October 2006 Means

1
0.1
10
0.01
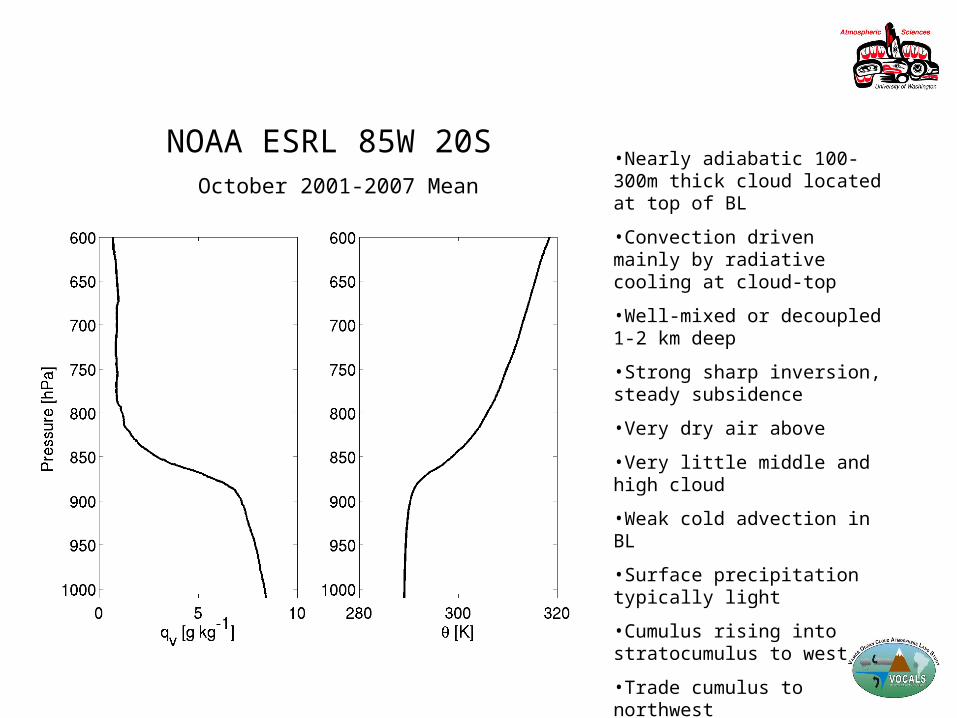
NOAA ESRL 85W 20S October 2001-2007 Mean
•Nearly adiabatic 100-300m thick cloud located at top of BL
•Convection driven mainly by radiative cooling at cloud-top
•Well-mixed or decoupled 1-2 km deep
•Strong sharp inversion, steady subsidence
•Very dry air above
•Very little middle and high cloud
•Weak cold advection in BL
•Surface precipitation typically light
•Cumulus rising into stratocumulus to west
•Trade cumulus to northwest

Oct 2006 10 m vector wind (m s-1) - models agree fairly wellG
loba
lR
egio
nal
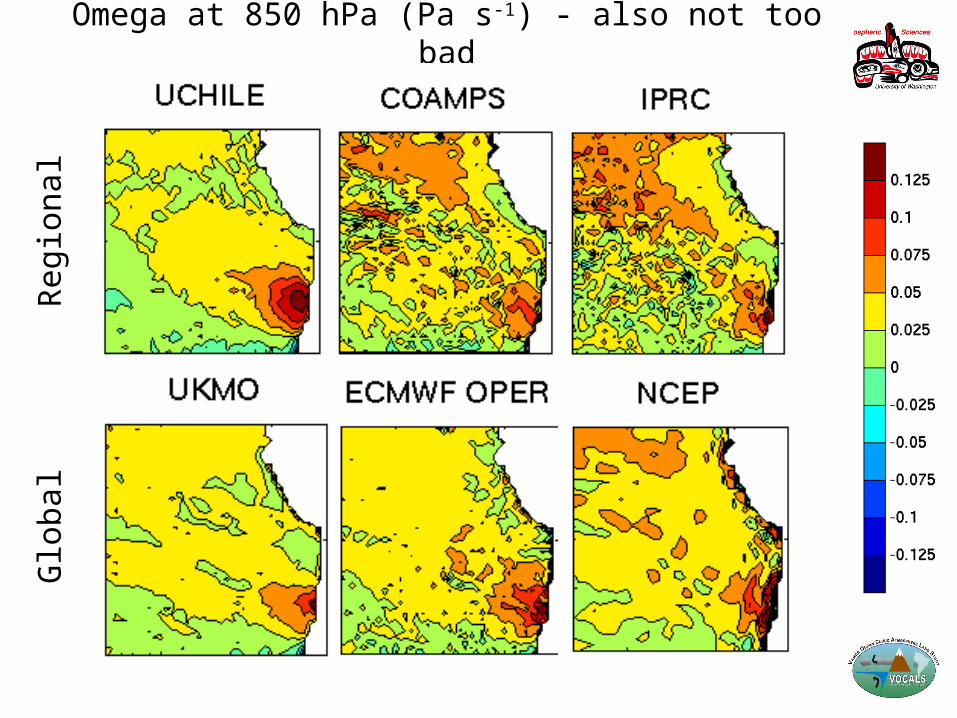
Omega at 850 hPa (Pa s-1) - also not too badG
loba
lR
egio
nal

Low Cloud Fraction

SW down at surface (W m-2)

Liquid Water Path (g m-2)
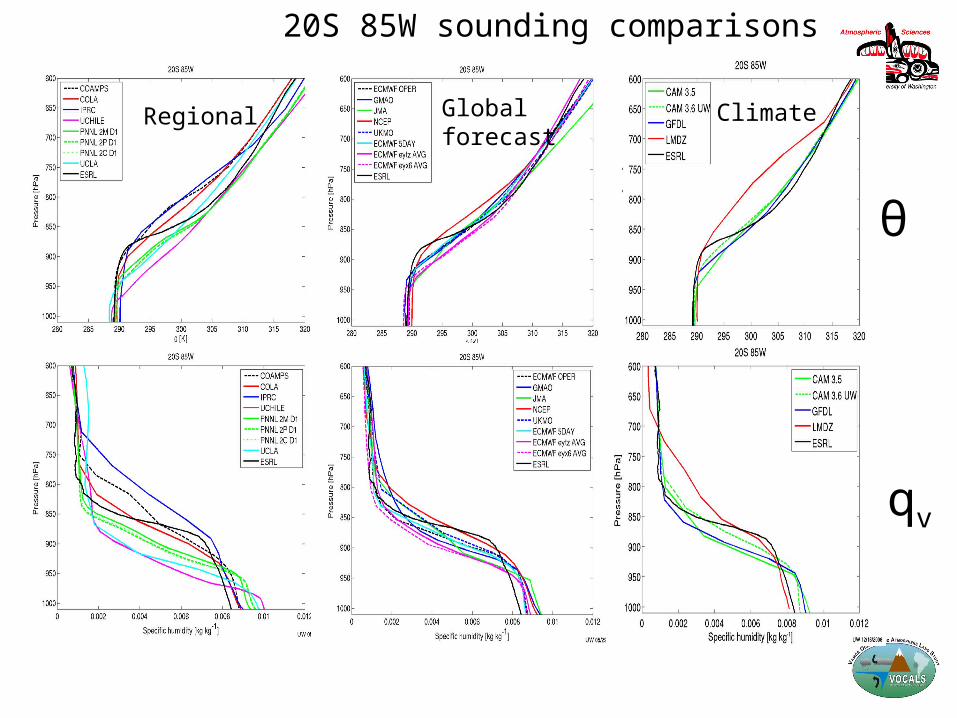
October soundings at IMET BUOY location 20S 85W sounding comparisons
Regional Global forecast
Climate
qv
θ

NCEPUKMO EC-oper
IPRCCOAMPSUChile WRF
Obs pinv
20S Cloud liquid water [g kg-1]
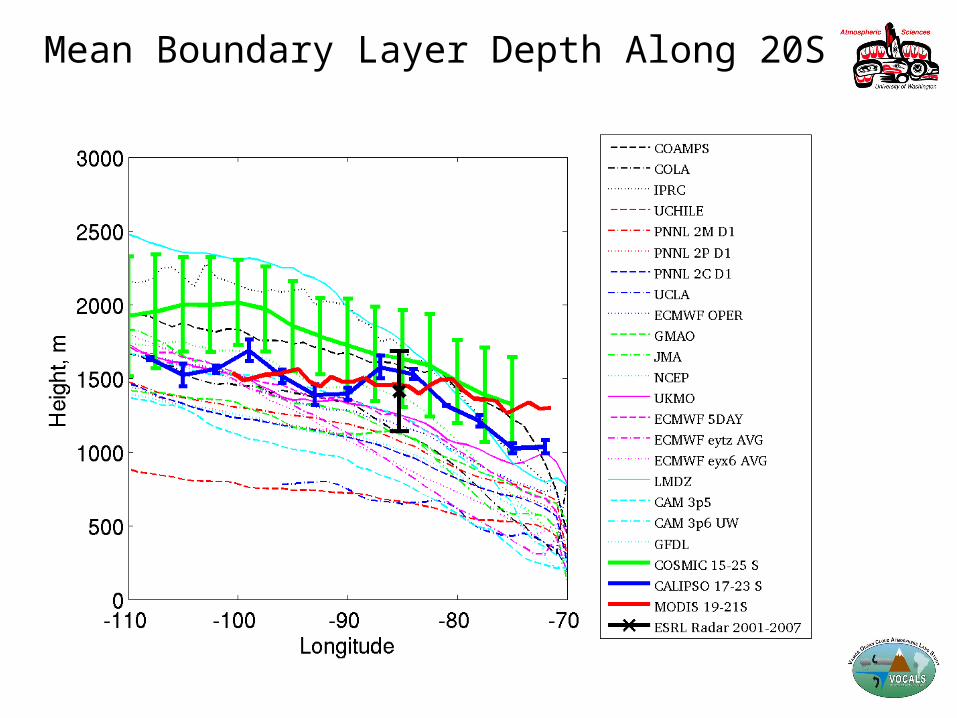
Mean Boundary Layer Depth Along 20S

Diurnal Composite LWP
0 126 2418
Hour (local)
TMI climo from
Wood et al. (2002) GRL

Diurnal Composite Low Cloud Fraction
0 126 2418
Hour (local)
EECRA compiled by Sungsu Park
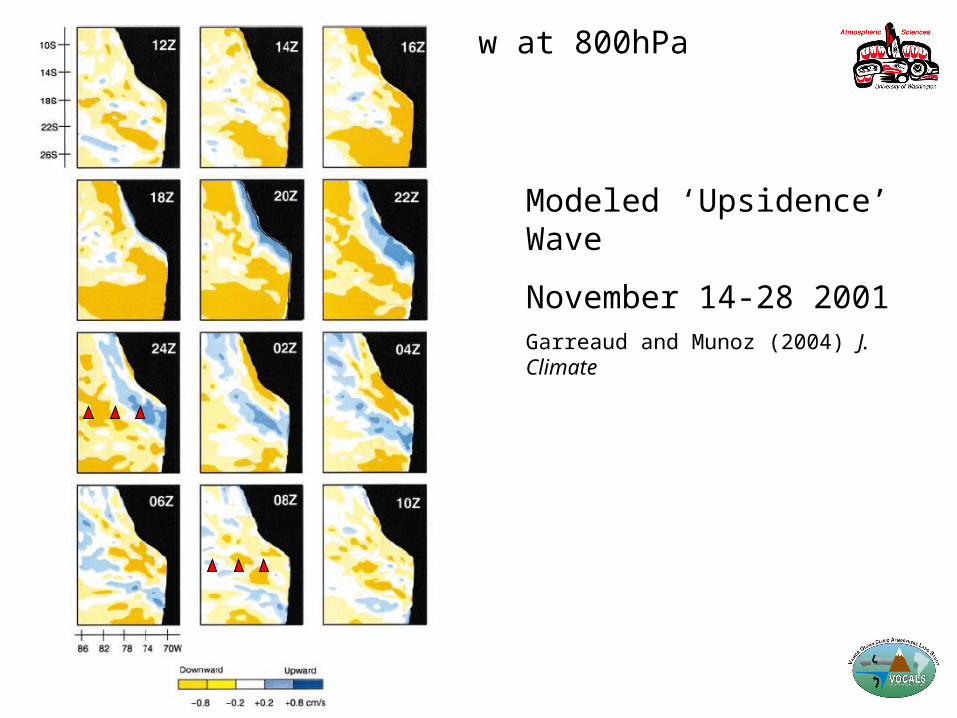
Modeled ‘Upsidence’ Wave
November 14-28 2001Garreaud and Munoz (2004) J. Climate
w at 800hPa
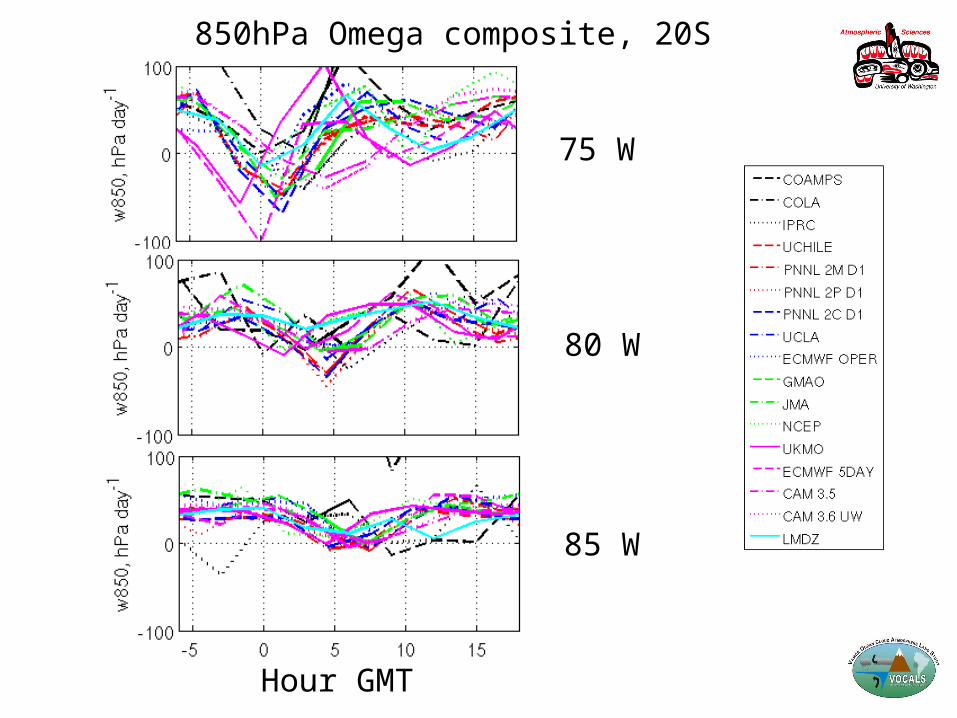
75 W
80 W
85 W
850hPa Omega composite, 20S
Hour GMT


Conclusions from PreVOCA
• Models produce similar large scale forcing in this region including subsidence waves off the Andes.
• Much scatter in PBL/Sc properties, especially among the regional models: an issue for aerosol-cloud interaction?
• UKMO and ECMWF models perform best overall, correctly capturing most geographic variations in PBL depth/structure and cloud cover.
• Sharpness of inversion challenges even the highest-resolution models.
• Most models simulate diurnal cycle of clouds with correct phase, though amplitudes are questionable in many cases.
• We are still exploring the models’ cloud response to synoptic variability.

Conclusions (continued)
• Cloud variability and aerosol feedbacks are cutting-edge challenges to the best global and regional models.
• VOCALS SE Pacific datasets are wonderful tools for assessing and improving cloud and aerosol simulations.

From PreVOCA to VOCA...
• VOCA: Similar protocol to preVOCA using REx observations from 15 Oct -15 Nov 2008
• More focus on chemical transport, aerosol concentrations and reff vs. in-situ and CALIPSO data.
• We will send out a detailed protocol early this year. All modeling groups are welcome (with or without chemical transport modeling capability).

Extra Slides

Data from REx for Model Assessment
• ~35 days of Ron Brown ship observations near 20S (cloud radar, scanning 5 cm radar, lidar, sondes, surface met/fluxes, aerosols, sulfur chemistry, oceanography)
• Numerous night/day flights sampling 20S along 70-85W (aerosols, chemistry, cloud radar, dropsondes).
NSF C-130
NOAA Ronald H Brown
UK BAe146

Great cloud radar, microphysics, aerosol data
Courtesy Dave LeonRF03