prey dna detectability half -lives: turning pcr positives...
TRANSCRIPT

Prey DNA Detectability Half-Lives: Turning PCR Positives into Quantitative Predation Rates
Bastian Egeter
https://bastianegeter.wordpress.com/https://cibio.up.pt/people/details/egeterbas/projects/505
http://inbio-envmetagen.pt/
Grant agreement 668981

Outline
Case study of diet analysis to quantify predation
Why aren’t there more studies like this?
Grant agreement 668981
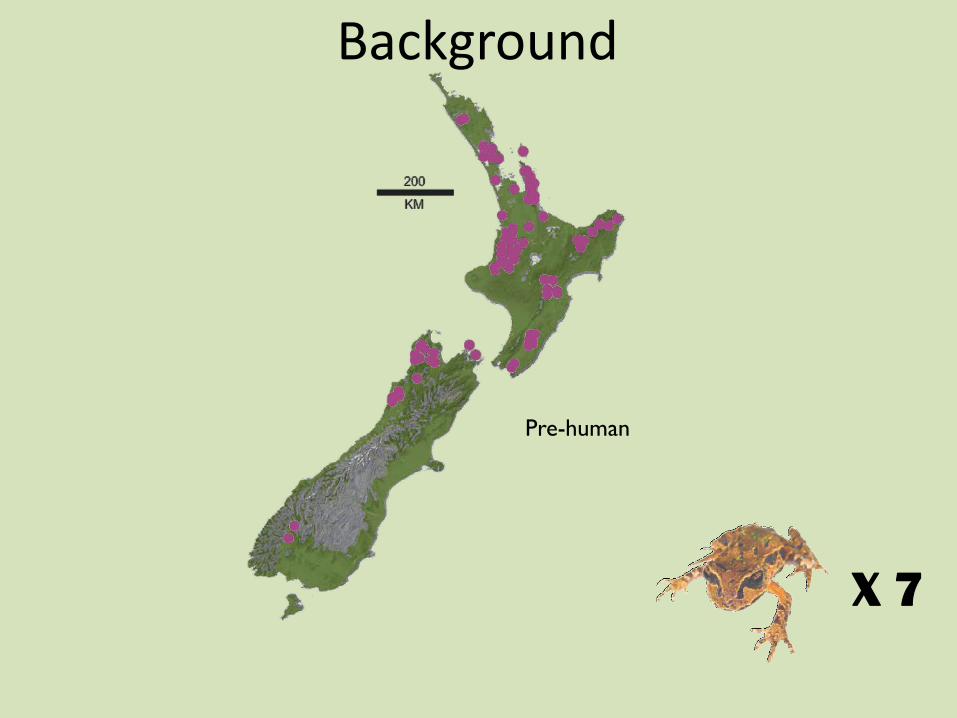
Pre-human
X 7
Background
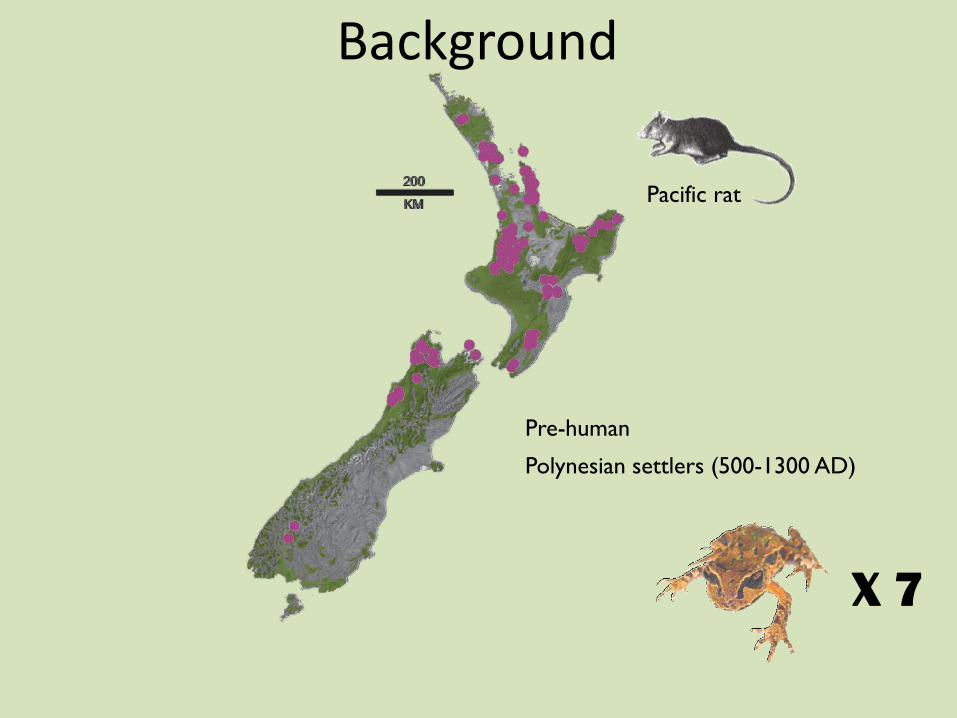
Polynesian settlers (500-1300 AD)
Pre-human
Pacific rat
X 7
Background
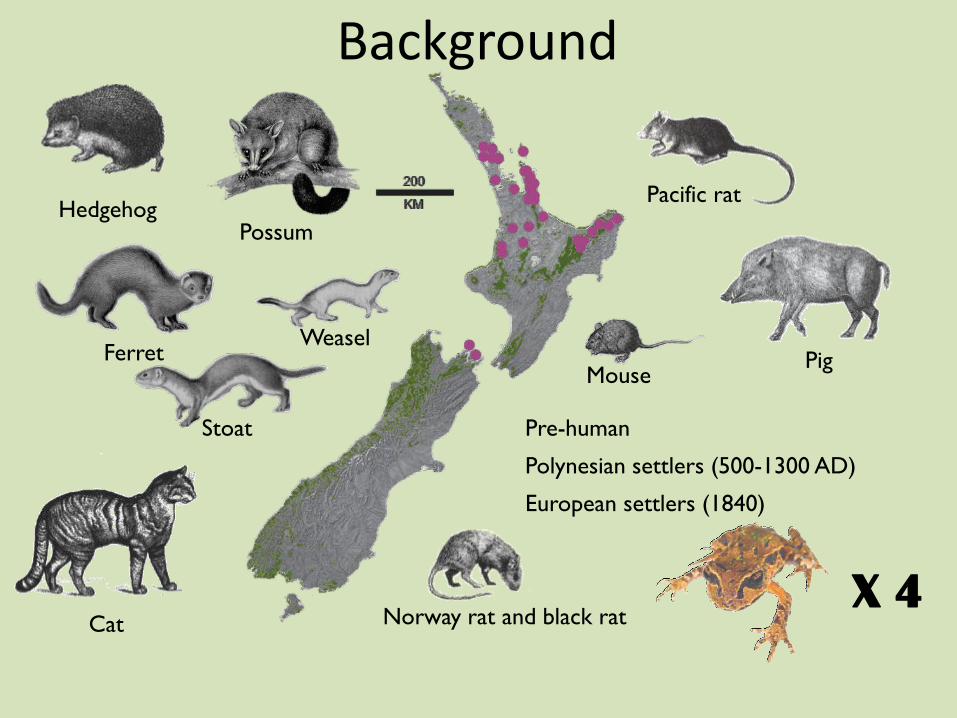
Polynesian settlers (500-1300 AD)
European settlers (1840)
Pre-human
Pacific ratHedgehog
Ferret Pig
Cat
Possum
Norway rat and black rat
Weasel
Stoat
Mouse
X 4
Background
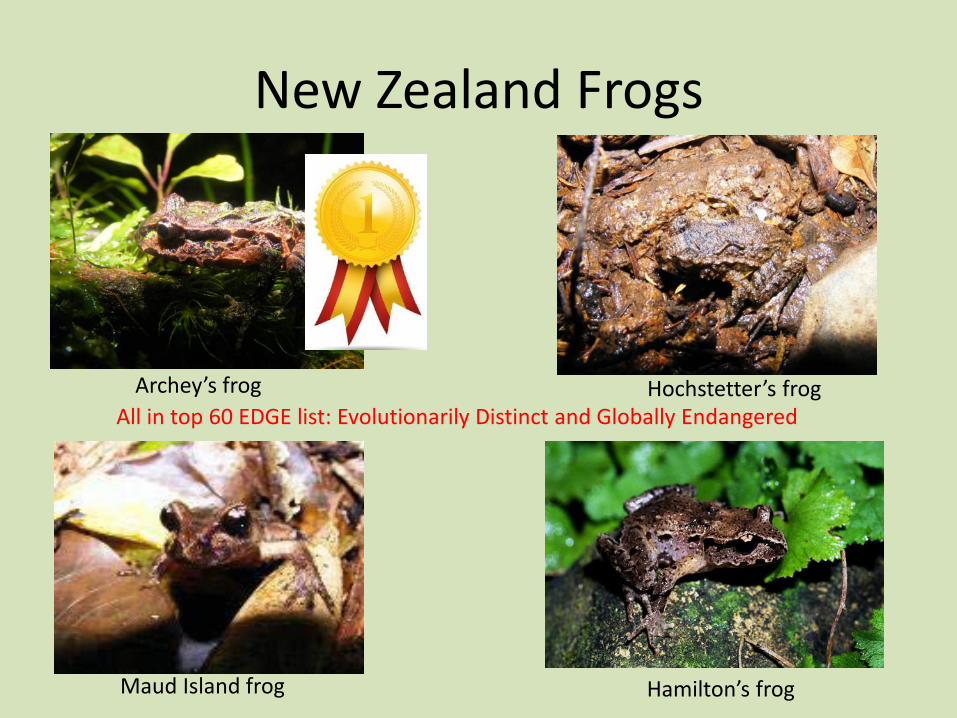
New Zealand Frogs
All in top 60 EDGE list: Evolutionarily Distinct and Globally EndangeredArchey’s frog Hochstetter’s frog
Maud Island frog Hamilton’s frog

New Zealand Frogs
Frost DR, Grant T, Faivovich J, Bain RH, Haas A, Haddad CFB, De Sa RO, Channing A, Wilkinson M, Donnellan SC, Raxworthy CJ, Campbell JA, Blotto BL, Moler P, DrewesRC, Nussbaum RA, Lynch JD, Green DM and Wheeler WC (2006) The amphibian tree of life. Bull Am Mus Nat Hist 297: 1—291
Essner Jr RL, Suffian DJ, Bishop PJ, Reilly SM 2010 Landing in basal frogs: evidence of saltational patterns in the evolution of anuran locomotion. Naturwissenschaften 97: 935
Watch video at:https://www.eurekalert.org/pub_releases/2010-07/s-pfd072110.php
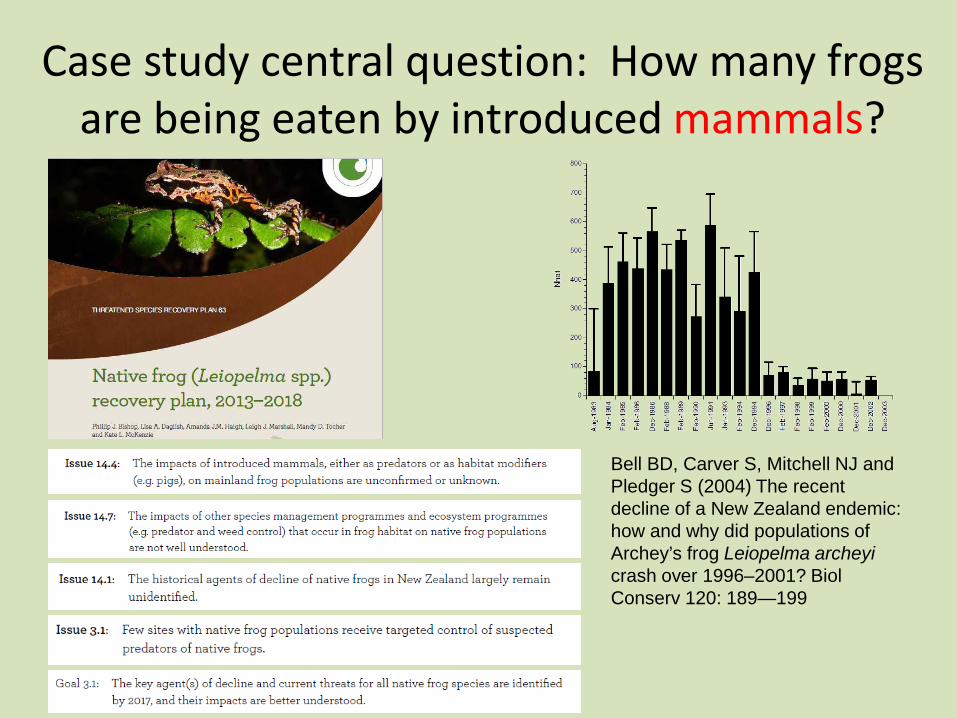
Case study central question: How many frogs are being eaten by introduced mammals?
Bell BD, Carver S, Mitchell NJ and Pledger S (2004) The recent decline of a New Zealand endemic: how and why did populations of Archey’s frog Leiopelma archeyicrash over 1996–2001? BiolConserv 120: 189—199

• 1080: €13m/yr• €50m/yr pest control
in general• half a million hectares• kills game species• kills some birds• a form of habitat
restoration
Case study central question: How many frogs are being eaten by introduced mammals?

Egeter B, Robertson BC and Bishop PJ (2015) A synthesis of direct evidence of predation on amphibians in New Zealand, in the context of global invasion biology. Herpetological Review 46: 512-519
Who is eating frogs?
n = 217 n = 20

Frog carcasses following rat predation
© Tertia Thurley& Dr. Ben Bell, 1994 © Dr. Chris Smal, 2009
© Bastian Egeter, 2010Egeter B, Bishop PJ and Robertson BC (2011) DNA detects frog predation. FrogLog99: 36-37

Frog carcasses following rat predation
Krull C, Egeter B (2016) Feral pig (Sus scrofa) predation of a green and golden bell frog (Litoria aurea). New Zealand Journal of Ecology 40(1): 191-195.

Case study central question: How many frogs are being eaten by introduced mammals?
Hedgehog consuming southern bell frog in New ZealandPhoto: Dr. Stephen Chadwick
How many prey individuals are being taken by a particular
predator?

How many frogs are being eaten by introduced mammals?
𝒑𝒑𝒑𝒑𝒑𝒑𝒑𝒑𝒑𝒑𝒑𝒑𝒑𝒑𝒑𝒑𝒑𝒑 𝒑𝒑𝒑𝒑𝒑𝒑𝒑𝒑
= 𝒑𝒑𝒑𝒑𝒑𝒑𝒑𝒑𝒑𝒑𝒑𝒑𝒑𝒑𝒑𝒑𝒑𝒑𝒑𝒑 𝒑𝒑𝒐𝒐 𝒑𝒑𝒑𝒑𝒑𝒑𝒑𝒑𝒑𝒑𝒑𝒑𝒑𝒑𝒑𝒑𝒑𝒑 𝒄𝒄𝒑𝒑𝒑𝒑𝒑𝒑𝒑𝒑𝒑𝒑𝒑𝒑𝒑𝒑𝒑𝒑𝒄𝒄 𝒑𝒑𝒑𝒑𝒑𝒑𝒑𝒑 × 𝒑𝒑𝒑𝒑𝒑𝒑𝒑𝒑𝒑𝒑𝒑𝒑𝒑𝒑𝒑𝒑 𝒑𝒑𝒑𝒑𝒑𝒑𝒑𝒑𝒑𝒑𝒑𝒑𝒑𝒑
×𝒑𝒑𝒑𝒑𝒕𝒕𝒑𝒑 𝒑𝒑𝒑𝒑𝒑𝒑𝒑𝒑 𝒑𝒑𝒂𝒂𝒑𝒑𝒑𝒑𝒂𝒂𝒑𝒑𝒂𝒂𝒂𝒂𝒑𝒑𝒑𝒑𝒑𝒑𝒑𝒑𝒑𝒑𝒄𝒄𝒑𝒑𝒑𝒑𝒑𝒑𝒑𝒑 𝒑𝒑𝒑𝒑𝒑𝒑𝒑𝒑𝒑𝒑𝒑𝒑
𝒑𝒑 = 𝒑𝒑𝒑𝒑 ×𝒑𝒑𝑷𝑷𝑷𝑷𝒑𝒑𝑫𝑫𝑷𝑷
Modified from: Dempster JP (1967) The control of Pieris rapae with DDT. I. The natural mortality of the young stages of Pieris. Journal of Applied Ecology 4(2):485-500

0.0
0.1
0.2
0.3
0.4
0.5
0.6
0.7
0.8
0.9
1.0
0 2 4 6 8 10 12 14 16 18 20
Prob
abili
ty o
f det
ectin
g pr
ey D
NA
Hours since prey ingestion
Half-life
Prey detectability half-lives
n = 10+

What have detection half-lives been used for so far?
• Proposed by Chen et al. 2000 to rank predator importance
Chen Y, Giles KL, Payton ME and Greenstone MH (2000) Identifying key cereal aphid predators by molecular gut analysis. Mol Ecol 9: 1887-1898
aphid (prey) lacewing ladybird
4h8.8h
2.2X more likely to detect aphid DNA from ladybirds
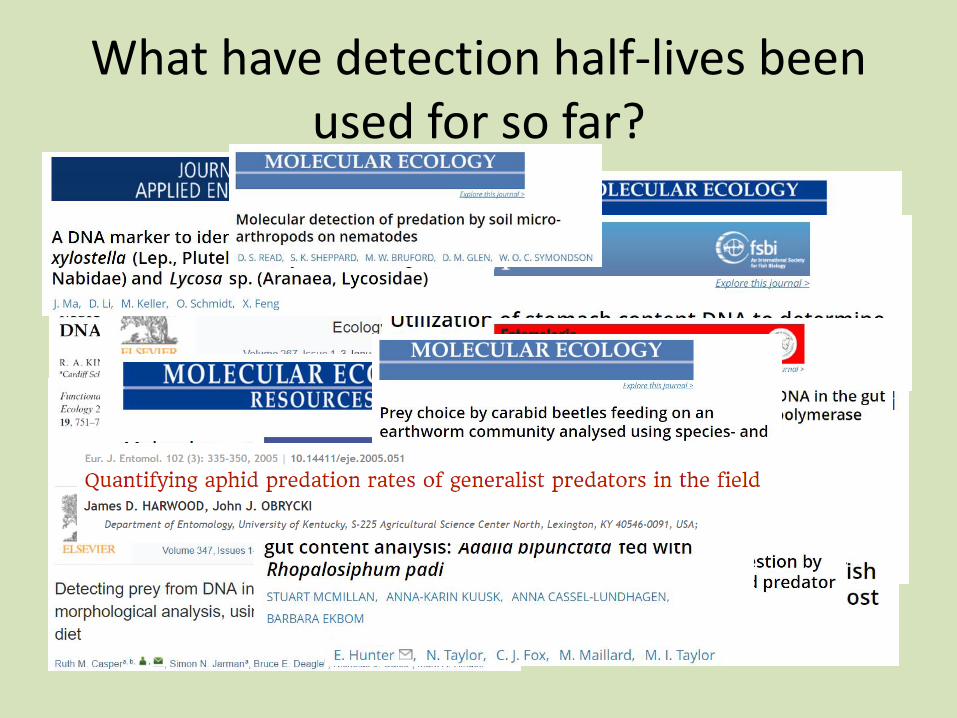
What have detection half-lives been used for so far?

Greenstone MH, Szendrei Z, Payton ME, Rowley DL, Coudron TC and Weber DC (2010) Choosing natural enemies for conservation biological control: use of the prey detectability half-life to rank key predators of Colorado potato beetle. Entomol Exp Appl 136: 97-107
What have detection half-lives been used for so far?
Colorado potato beetle (prey) Ladybird (adults)
Lebia grandis (adults)
spined soldier bug (adults)
Prey occurrence from 11 to 95% spined soldier bug (nymphs)
two-spotted stink bug (adults)
two-spotted stink bug (nymphs)
1
2
3
4
5
6
1
2
3
4
5
6

Review of 37 studies (2003-2014) none quantified impact of predation on prey

How many frogs are being eaten by introduced mammals?
𝒑𝒑𝒑𝒑𝒑𝒑𝒑𝒑𝒑𝒑𝒑𝒑𝒑𝒑𝒑𝒑𝒑𝒑 𝒑𝒑𝒑𝒑𝒑𝒑𝒑𝒑
= 𝒑𝒑𝒑𝒑𝒑𝒑𝒑𝒑𝒑𝒑𝒑𝒑𝒑𝒑𝒑𝒑𝒑𝒑𝒑𝒑 𝒑𝒑𝒐𝒐 𝒑𝒑𝒑𝒑𝒑𝒑𝒑𝒑𝒑𝒑𝒑𝒑𝒑𝒑𝒑𝒑𝒑𝒑 𝒄𝒄𝒑𝒑𝒑𝒑𝒑𝒑𝒑𝒑𝒑𝒑𝒑𝒑𝒑𝒑𝒑𝒑𝒄𝒄 𝒑𝒑𝒑𝒑𝒑𝒑𝒑𝒑 × 𝒑𝒑𝒑𝒑𝒑𝒑𝒑𝒑𝒑𝒑𝒑𝒑𝒑𝒑𝒑𝒑 𝒑𝒑𝒑𝒑𝒑𝒑𝒑𝒑𝒑𝒑𝒑𝒑𝒑𝒑
×𝒑𝒑𝒑𝒑𝒕𝒕𝒑𝒑 𝒑𝒑𝒑𝒑𝒑𝒑𝒑𝒑 𝒑𝒑𝒂𝒂𝒑𝒑𝒑𝒑𝒂𝒂𝒑𝒑𝒂𝒂𝒂𝒂𝒑𝒑𝒑𝒑𝒑𝒑𝒑𝒑𝒑𝒑𝒄𝒄𝒑𝒑𝒑𝒑𝒑𝒑𝒑𝒑 𝒑𝒑𝒑𝒑𝒑𝒑𝒑𝒑𝒑𝒑𝒑𝒑
𝒑𝒑 = 𝒑𝒑𝒑𝒑 ×𝒑𝒑𝑷𝑷𝑷𝑷𝒑𝒑𝑫𝑫𝑷𝑷
Modified from: Dempster JP (1967) The control of Pieris rapae with DDT. I. The natural mortality of the young stages of Pieris. Journal of Applied Ecology 4(2):485-500

ApproachesLab feeding trials Diet analysis
Trapping of wild mammals
tPA
p
d Searching for frogs
tDP
𝒑𝒑 = 𝒑𝒑𝒑𝒑 ×𝒑𝒑𝑷𝑷𝑷𝑷𝒑𝒑𝑫𝑫𝑷𝑷

Feeding trials (tDP)Stage 1: Faeces
Stage 2: Stomachs
𝒑𝒑 = 𝒑𝒑𝒑𝒑 ×𝒑𝒑𝑷𝑷𝑷𝑷𝒑𝒑𝑫𝑫𝑷𝑷

Results: Morphological analysis
1 hr 3 hr
3 hr1 hr
Hedgehog Hedgehog
Norway rat Ship rat

Results: Prey DNA amplification
Norway RatStomach contents

0.0
0.1
0.2
0.3
0.4
0.5
0.6
0.7
0.8
0.9
1.0
0 5 10 15 20 25 30 35 40
Prob
abili
ty o
f det
ectin
g fr
ogs a
s pre
y
Hours since prey ingestion
ship rat
mouse
Norway rat FF
Norway rat EF
hedgehog
Half-life
0.5h 10.6hGIT
6h* 12-16hGIT
Detection period (tDP)
Egeter B, Bishop PJ and Robertson BC (2015) Detecting frogs as prey in the diets of introduced mammals: a comparison between morphological and DNA-based diet analyses. Molecular Ecology Resources 15: 306—316
single line: stomachsdouble lines: faeces arrows: known GIT transit times

• Using faeces lengthens half-life > 3-fold
• Prey detection rate: 2% to 70% stomachs
• and 0% to 53% in faeces• Ship rats: 0% to 80% stomachs; 7.3h
(95%CIs 4.4-11.29h)
Detection period (tDP)
Egeter B, Bishop PJ and Robertson BC (2015) Detecting frogs as prey in the diets of introduced mammals: a comparison between morphological and DNA-based diet analyses. Molecular Ecology Resources 15: 306—316

How many frogs are being eaten by introduced mammals?
𝒑𝒑𝒑𝒑𝒑𝒑𝒑𝒑𝒑𝒑𝒑𝒑𝒑𝒑𝒑𝒑𝒑𝒑 𝒑𝒑𝒑𝒑𝒑𝒑𝒑𝒑
= 𝒑𝒑𝒑𝒑𝒑𝒑𝒑𝒑𝒑𝒑𝒑𝒑𝒑𝒑𝒑𝒑𝒑𝒑𝒑𝒑 𝒑𝒑𝒐𝒐 𝒑𝒑𝒑𝒑𝒑𝒑𝒑𝒑𝒑𝒑𝒑𝒑𝒑𝒑𝒑𝒑𝒑𝒑 𝒄𝒄𝒑𝒑𝒑𝒑𝒑𝒑𝒑𝒑𝒑𝒑𝒑𝒑𝒑𝒑𝒑𝒑𝒄𝒄 𝒑𝒑𝒑𝒑𝒑𝒑𝒑𝒑 × 𝒑𝒑𝒑𝒑𝒑𝒑𝒑𝒑𝒑𝒑𝒑𝒑𝒑𝒑𝒑𝒑 𝒑𝒑𝒑𝒑𝒑𝒑𝒑𝒑𝒑𝒑𝒑𝒑𝒑𝒑
×𝒑𝒑𝒑𝒑𝒕𝒕𝒑𝒑 𝒑𝒑𝒑𝒑𝒑𝒑𝒑𝒑 𝒑𝒑𝒂𝒂𝒑𝒑𝒑𝒑𝒂𝒂𝒑𝒑𝒂𝒂𝒂𝒂𝒑𝒑𝒑𝒑𝒑𝒑𝒑𝒑𝒑𝒑𝒄𝒄𝒑𝒑𝒑𝒑𝒑𝒑𝒑𝒑 𝒑𝒑𝒑𝒑𝒑𝒑𝒑𝒑𝒑𝒑𝒑𝒑
𝒑𝒑 = 𝒑𝒑𝒑𝒑 ×𝒑𝒑𝑷𝑷𝑷𝑷𝒑𝒑𝑫𝑫𝑷𝑷
Modified from: Dempster JP (1967) The control of Pieris rapae with DDT. I. The natural mortality of the young stages of Pieris. Journal of Applied Ecology 4(2):485-500

Study sites
𝒑𝒑 = 𝒑𝒑𝒑𝒑 ×𝒑𝒑𝑷𝑷𝑷𝑷𝒑𝒑𝑫𝑫𝑷𝑷

Study sites

Nights prey available
1 3 5 7 9 11 13 15 17 19 21 23 250.000.050.100.150.200.250.300.350.400.450.50
1 3 5
Arch
ey’s
frog
enc
ount
er ra
te (f
rogs
-m)
Site 1 Site 2
Day
trapping period
tPA
𝒑𝒑 = 𝒑𝒑𝒑𝒑 ×𝒑𝒑𝑷𝑷𝑷𝑷𝒑𝒑𝑫𝑫𝑷𝑷

Num
ber o
f shi
p ra
ts c
augh
t eac
h ni
ght
Cumulative number of ship rats caught
Rough average across sites
6.4 ship rats / ha
d
𝒑𝒑 = 𝒑𝒑𝒑𝒑 ×𝒑𝒑𝑷𝑷𝑷𝑷𝒑𝒑𝑫𝑫𝑷𝑷
Predator density


Samples testing positive
5/60 ship rat stomach samples (8.3%)
p𝒑𝒑 = 𝒑𝒑𝒑𝒑 ×
𝒑𝒑𝑷𝑷𝑷𝑷𝒑𝒑𝑫𝑫𝑷𝑷
Detection methodsuccess
Study Area Site Rats Prey Morphological DNA
Whareorino Forest 1 16 Archey´s frog No 1
Whareorino Forest 2 44 Archey´s frog No 4
Positive8%
Negative92%
if we assumed that we were detecting all predation events here then p=r(also assumes constant sampling effort and uniform rate of predation events)

Predation rate of ship rats on frogs
WF Site 1 WF Site 2 WF Site 1&2
WF – WhareorinoForest
0.00
0.05
0.10
0.15
0.20
0.25
0.30
0.35
Frog
s/ra
t/ni
ght P (uncorrected)
P (corrected for Tdp)
P (stomach emptying time alone)

Predation rate of ship rats on frogs
WF Site 1 WF Site 2 WF Site 1&2
WF – WhareorinoForest
Corrected predation rate 1.65X (1.06X to 2.72X) greater than uncorrected P
0.00
0.50
1.00
1.50
2.00
2.50
Frog
s/ha
/nig
ht
P (uncorrected)
P (corrected for Tdp)
P (stomach emptying time alone)

% of frog population eaten• 26 – 110 frogs / rat annually• 0.4 – 2 frogs / ha / night• 146 – 730 frogs / ha annually• 2600 – 9600 frogs / ha• 1.5 % to 28.1 % of population
Summary• Survey for frogs as prey using DNA• Measure detection half-lives in mammalian stomachs• Compare detection half-lives in faeces vs stomachs • Estimate the impact of rats on frogs• Estimate predation rate using DNA

Why is this type of study not more common?

Predation
Distribution
Abundance
Spatiotemporal population
trends
Niche use and
resource partitioning
Circadian rhythms
Evolution

Global conservation/ Resource management
Problem species
Impact of introduced faunaPest predator: e.g. preying on pollinators, crop damage →
biomanipulation
High Value Species
Commercially valued prey: e.g. game
Commercially valued predator: e.g. fish
Conservation-valued prey
Conservation-valued predator
Top down effect on environmental microbiome, nutrient resources →
agricultural productivity

Why is this type of study not more common?
• %F versus bulk– PCR vs HTS

Baker R, Buckland A, Sheaves M (2014) Fish gut content analysis: robust measures of diet composition. Fish and Fisheries 15: 170–177
Sample sizes > 100
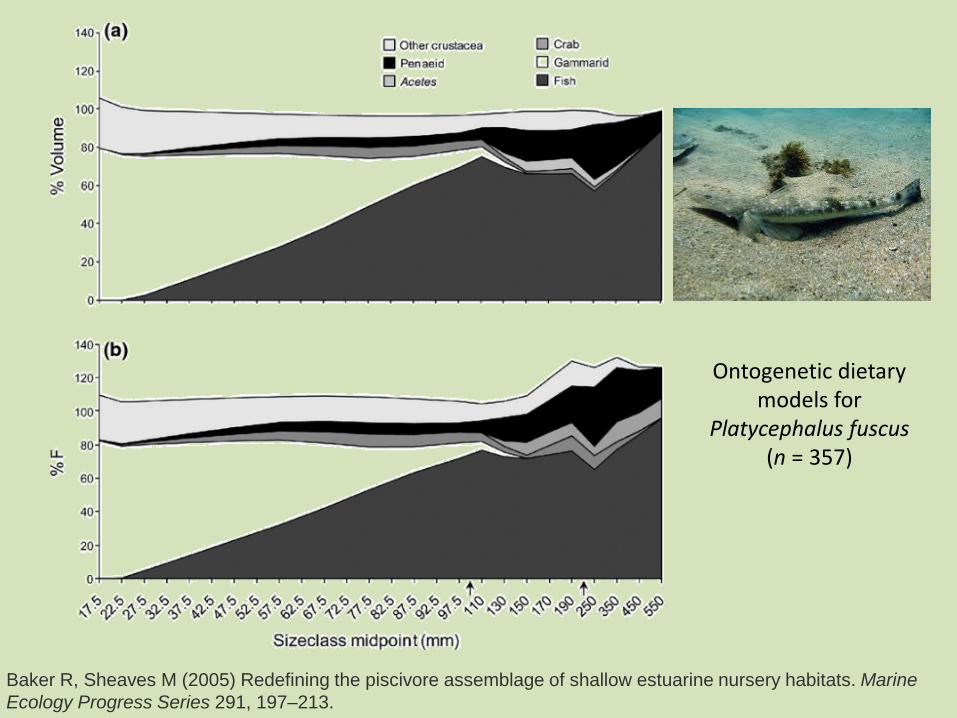
Ontogenetic dietary models for
Platycephalus fuscus(n = 357)
Baker R, Sheaves M (2005) Redefining the piscivore assemblage of shallow estuarine nursery habitats. Marine Ecology Progress Series 291, 197–213.

Why is this type of study not more common?
• %F versus bulk– PCR vs HTS
• Lots of work• People and their study
species• Not many predation models

Dempster model
𝒑𝒑 = 𝒑𝒑𝒑𝒑 ×𝒑𝒑𝑷𝑷𝑷𝑷𝒑𝒑𝑫𝑫𝑷𝑷
Predicted number of prey attacked
Obs
erve
d nu
mbe
r of p
rey
atta
cked
Naranjo SE and Hagler JR (2001) Toward the quantification of predation with predator gut immunoassays: a new approach integrating functional response behavior. Biological Control 20: 175-189

Bayesian models
• Average time since feeding• Reaches same conclusions as other models,
but better measures of uncertainty
Welch KD, Schofield MR, Chapman EG and Harwood JD (2014) Comparing rates of springtail predation by web‐building spiders using Bayesian inference. Molecular ecology 23: 3814-3825

Why is this type of study not more common?
• %F versus bulk– PCR vs HTS
• Lots of work• People and their study
species• Not many predation models• One (or more) prey
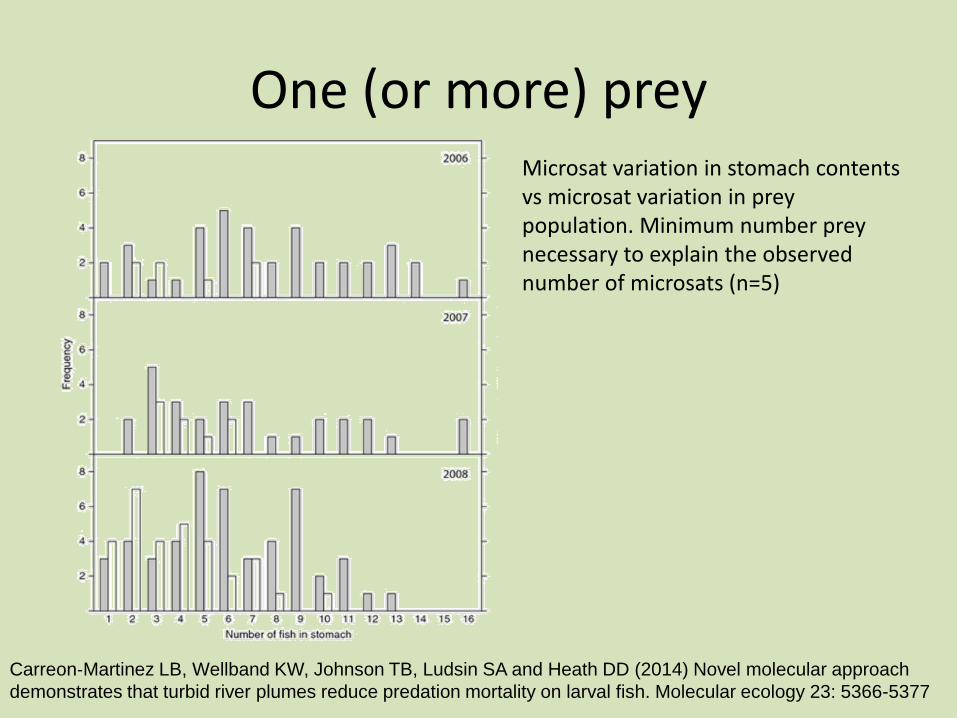
One (or more) prey
Carreon‐Martinez LB, Wellband KW, Johnson TB, Ludsin SA and Heath DD (2014) Novel molecular approach demonstrates that turbid river plumes reduce predation mortality on larval fish. Molecular ecology 23: 5366-5377
Microsat variation in stomach contents vs microsat variation in prey population. Minimum number prey necessary to explain the observed number of microsats (n=5)

Why is this type of study not more common?
• %F versus bulk– PCR vs HTS
• Lots of work• People and their study species• Not many predation models• One (or more) prey• Lab diversity (collaboration)• Factors affecting half-lives

• Number of individuals in a sample• Multiple prey approach, HTS• A few good mesocosm experiments• Same questions as metabarcoding• Approximating half-life based on known GIT• Answer questions about biocontrol, biomanipulation,
invasive species, resource management, agri-environment, pollinators, pure ecology
The future

Acknowledgements
SRARNZ
EcogeckoConsultants
Phil Bishop, Bruce Robertson, Cailín Roe, Luke Easton, Kim Garrett, Murray McKenzie, Ken Miller, Nicky McHugh, Tania King, Karen Judge, Deb Wilson, Otago Frog Team, Lisa Daglish, Kate McKenzie, Oliver
Overdyck, Sarah Cosio, Alison Davis, Duncan Emerson, Dave Smith, Tim Darviole, Allison Ernst, Debra Kriger, Jess, Pia Goldsmith, James Barnaville, Lucy Ferris, Rhodri Hardy, Michaela Blomquist, Beth Haines, Rob
Wood, Justyna Miklas, Alan Mackern, Edgrado Moreno, Christy Reynolds, Roc Taull, Kate Morozova, Devin, Stephanie Hicks and Chris Smal