prez forum mid-cap 2012 - homepage - ipsen group · +14.4% in € million group sales growth :...
TRANSCRIPT
Ipsen
Oddo – Forum Mid-Cap 2012
Lyon, January 5th – 6th, 2012
Pierre Kemula – Investor Relations Officer
Stéphane Durant des Aulnois – Investor Relations Manager
2 Ipsen – Forum Mid-cap 2012
DisclaimerThis presentation includes only summary information and does not purport to be comprehensive. Forward-
looking statements, targets and estimates contained herein are for illustrative purposes only and are based
on management’s current views and assumptions. Such statements involve known and unknown risks and
uncertainties that may cause actual results, performance or events to differ materially from those
anticipated in the summary information. Actual results may depart significantly from these targets given the
occurrence of certain risks and uncertainties, notably given that a new product can appear to be promising
at a preparatory stage of development or after clinical trials but never be launched on the market or be
launched on the market but fail to sell notably for regulatory or competitive reasons. The Group must deal
with or may have to deal with competition from generic that may result in market share losses, which could
affect its current level of growth in sales or profitability. The Company expressly disclaims any obligation or
undertaking to update or revise any forward-looking statements, targets or estimates contained in this
presentation to reflect any change in events, conditions, assumptions or circumstances on which any such
statements are based unless so required by applicable law.
All product names listed in this document are either licensed to the Ipsen Group or are registered
trademarks of the Ipsen Group or its partners.
The implementation of the strategy has to be submitted to the relevant staff representation authorities in
each country concerned, in compliance with the specific procedures, terms and conditions set forth by each
national legislation.
3 Ipsen – Forum Mid-cap 2012
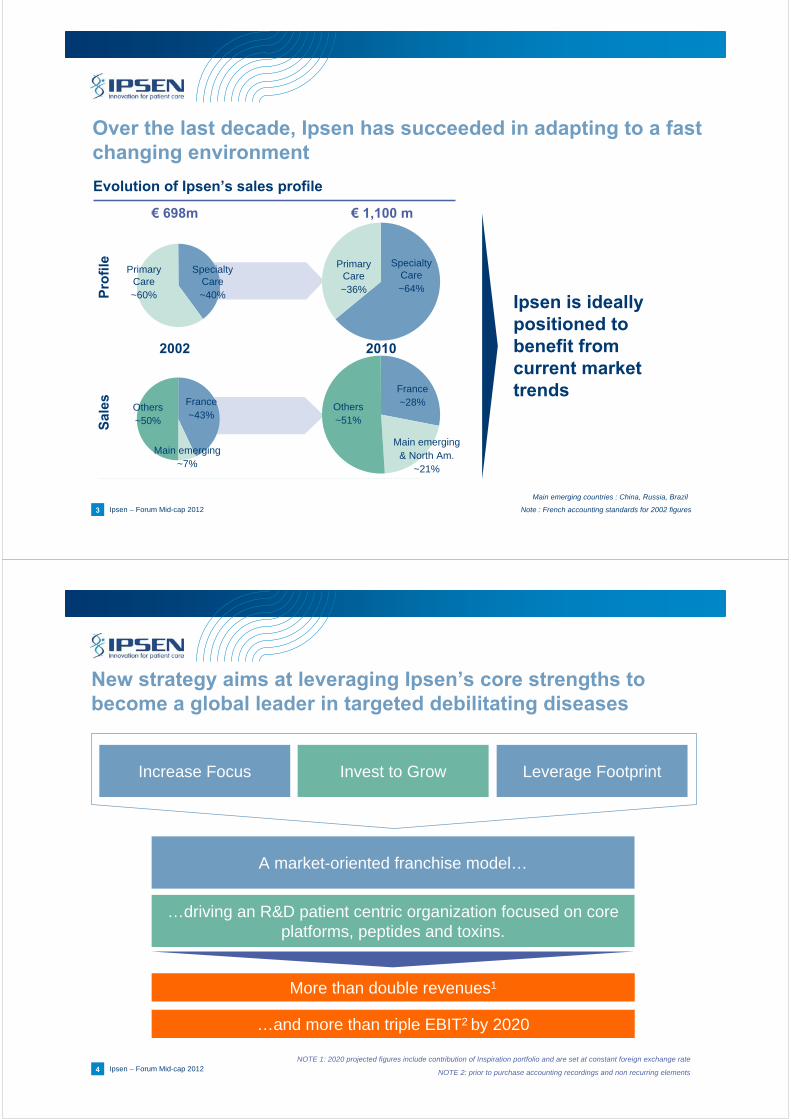
Over the last decade, Ipsen has succeeded in adapting to a fast changing environment
Evolution of Ipsen’s sales profile
€ 698m € 1,100 m
2002 2010
Sal
esP
rofi
le
France~43%
Others~50%
Main emerging~7%
France~28%Others
~51%
Main emerging & North Am.
~21%
Primary Care~60%
Specialty Care~40%
Primary Care~36%
Specialty Care~64%
Main emerging countries : China, Russia, Brazil
Note : French accounting standards for 2002 figures
Ipsen is ideally positioned to benefit from current market trends
4 Ipsen – Forum Mid-cap 2012
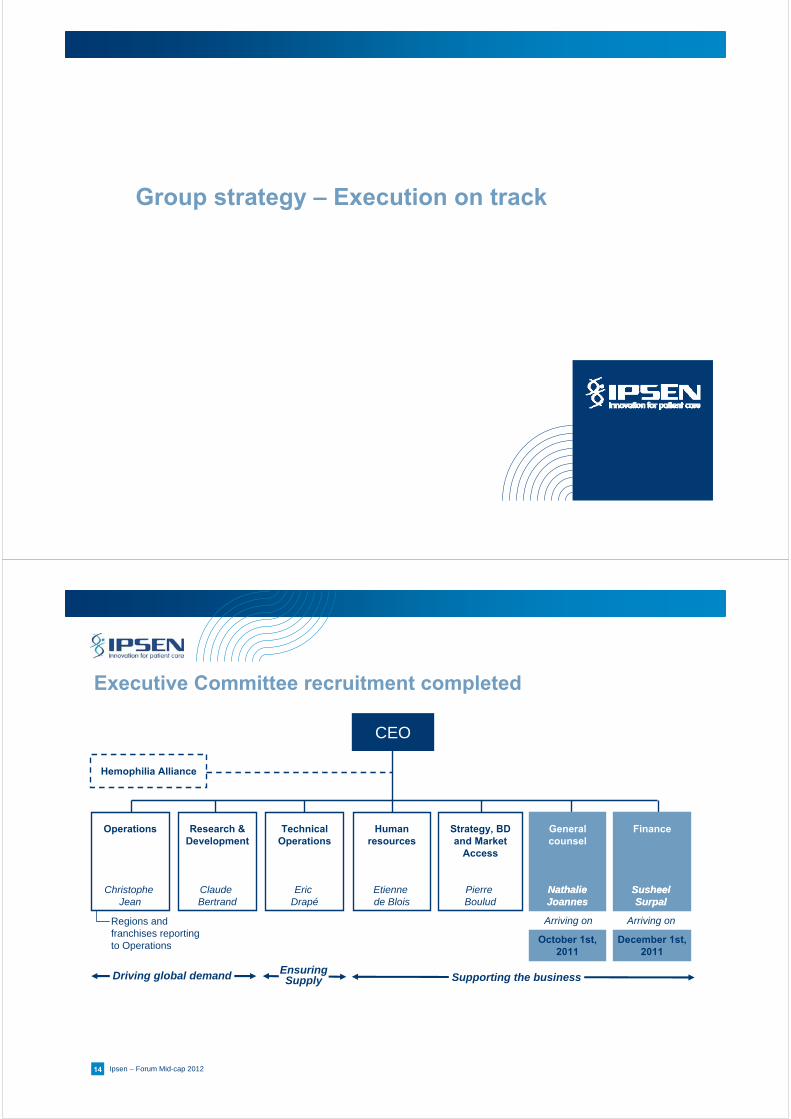
Increase Focus Invest to Grow Leverage Footprint
A market-oriented franchise model…
…driving an R&D patient centric organization focused on core platforms, peptides and toxins.
More than double revenues1
…and more than triple EBIT2 by 2020
NOTE 1: 2020 projected figures include contribution of Inspiration portfolio and are set at constant foreign exchange rate
NOTE 2: prior to purchase accounting recordings and non recurring elements
New strategy aims at leveraging Ipsen’s core strengths tobecome a global leader in targeted debilitating diseases

5 Ipsen – Forum Mid-cap 2012
An integrated R&D “push-pull” model to fulfill patient/ commercial requirements
NOTE 1 : Proof of Concept is the evidence that a drug is safe and capable of treating a specific patient population
R&D Push FRANCHISE pull
PoC1Phase IIa Phase IIb
Peptides
Toxins
Endocrinology/ Somatuline®
Neurology/Dysport®
External Other
Uro-oncology/Decapeptyl®
Increase Focus Invest to Grow Leverage Footprint
6 Ipsen – Forum Mid-cap 2012
Franchise focused on medical and marketing…
FRANCHISE
MARKETING
Define and roll out global marketing strategy
Product marketing expertise
Define Target Product Profile (TPP)
MEDICAL
Medical input and narrative
Lead Ph IIb and Ph III clinical trials
Medical training
Countries are responsible for P&L performance
Increase Focus Invest to Grow Leverage Footprint

7 Ipsen – Forum Mid-cap 2012
…with differentiated focus along the value chain
Primary care and Short Stature in a commercial optimization strategy
Research Late dev.(PhIIb & PhIV)
Manufacturing Operations
Endocrinology/ Somatuline®
Neurology/ Dysport®
Uro-oncology/ Decapeptyl®
Hemophilia
Early dev.(end of PhIIa)
Ipsen or Partner Ipsen or Partner
Ipsen or Partner Ipsen or PartnerPartner Partner Ipsen or Partner
Ipsen or PartnerIpsen or Partner
Increase Focus Invest to Grow Leverage Footprint
8 Ipsen – Forum Mid-cap 2012
Key decisions made
8
2020 strategy implies important choices
Increase focus
• Close R&D activities at Barcelona site
• Terminate one third of R&D projects
• Regions and countries to manage Short Stature in commercial optimization
perspective
• Explore new commercial partnership opportunities in French primary care
• Ensure sustainable future to Dreux manufacturing site
Increase Focus Invest to Grow Leverage Footprint

9 Ipsen – Forum Mid-cap 2012
Invest to grow: a rich Ph III program
Phase 1 Phase 2 Phase 3 Filing
Glabellar Lines
Dysport®
Neurology
Somatuline®
Endocrinology
Decapeptyl®
Oncology
Hemophilia (Inspiration)
Somatuline® - Acromegaly Japan
Somatuline® - Non Functioning NET
Somatuline® - Functioning NET - US
TASQ CRPC (Active Biotech)
IB1001 (Inspiration Inc.)
OBI-1 (Inspiration Inc.)
10 on-going phase IIIs, 4 for NMEs, 6 for life cyle management
Dysport® - Spasticity AUL
Dysport® - Next Generation
Dysport® - Spasticity ALL
Dysport® - PLL
Dysport® - Spasticity PUL
Dysport® - NDO
Fipamezole - Dyskinesia
Cervical Dystonia
Increase Focus Invest to Grow Leverage Footprint
EuropeUSA
10 Ipsen – Forum Mid-cap 2012
Ipsen differentiated from 10 peers1 in terms of Ph III intensity2
NOTE 1 : 10 peers selected with a criteria such as Sales, EBIT, R&D to sales ratio, PE, Headcount, Therapeutic Areas, Geographical reach…Peers include: Lundbeck, Meda, Almirall, Shire, Biogen Idec, Allergan, Novo Nordisk, Merck Serono, Actelion and Orion
NOTE 2 : Based on available and disclosed information as of august 2011Note 3 : Number of Ph III for a single indication
Ipsen and its peers1 - Intensity of Ph III programs
Peer Distribution
N° of Ph III programs3
3 peers
10
7
4
1 peer3 peers
3
1 peer Ipsen
0
5
1 peer 1 peer
8
Increase Focus Invest to Grow Leverage Footprint

11 Ipsen – Forum Mid-cap 2012
Leverage Ipsen’s extensive commercial reach as a major growth driver
Ipsen recorded sales in 115 countries in 2010
Direct commercial presenceIndirect commercial presence
Key
Increase Focus Invest to Grow Leverage Footprint
Enhanced commercial efforts to Somatuline® and Dysport® to capture sales full potential
Inspiration opportunity
Move teams to the East Coast
US China
Support strong Decapeptyl® growth in China
Register Dysport® and Somatuline®
Further leverage Ipsen’s profitable commercial reach
12 Ipsen – Forum Mid-cap 2012
Implementation: main milestones to success
Define strategy
New extended Executive Committee staffed
R&D « PoC » machine implemented
TASQ filed in Europe
Franchise org. implemented
French primary care commercial activities partnered
US platform reorganized
Barcelona R&D site closed
IB1001 filed in Europe
IB1001 filed in the USA
OBI-1 PhIII (Acquired H) enrollment completed
OB-1 PhIIICongenital H. initiated
Dysport® CD CTA1 filing in China
Somatuline® F. NET filed in the US
Somatuline® NF NET filed WW
Somatuline® New device rolled out globally
Dysport® A.& P. L.L spasticity filed
Dysport® A.U.L filed
Dysport® P.U.L filed in the US
Dysport® NG filed
Dysport® P.U.L filedin Brazil
5 new Pre clinical candidates (vs. June 2011) O/W 3 reach POC
Dysport® NDO Ph III initiated
2011 2012 2013 2014 2015
Reinforce Uro-oncology franchise
Merge R&D
Somatuline®
Acromegaly CTA1 filing in China
Smecta® EDL assessment (China)
NOTE 1: CTA or filing for Clinical Trial Authorization
Subject to the relevant staff representation authorities in each country concerned, in compliance with the specific procedures, terms and conditions set forth by each national legislation
Inspiration option assessment
OBI-1 Acquired H. filed in the US
Smecta® EDL assessment (China)
Inspiration option assessment
Smecta® EDL assessment (China)
Sale of Apokyn®
Group strategy – Execution on track
14 Ipsen – Forum Mid-cap 2012
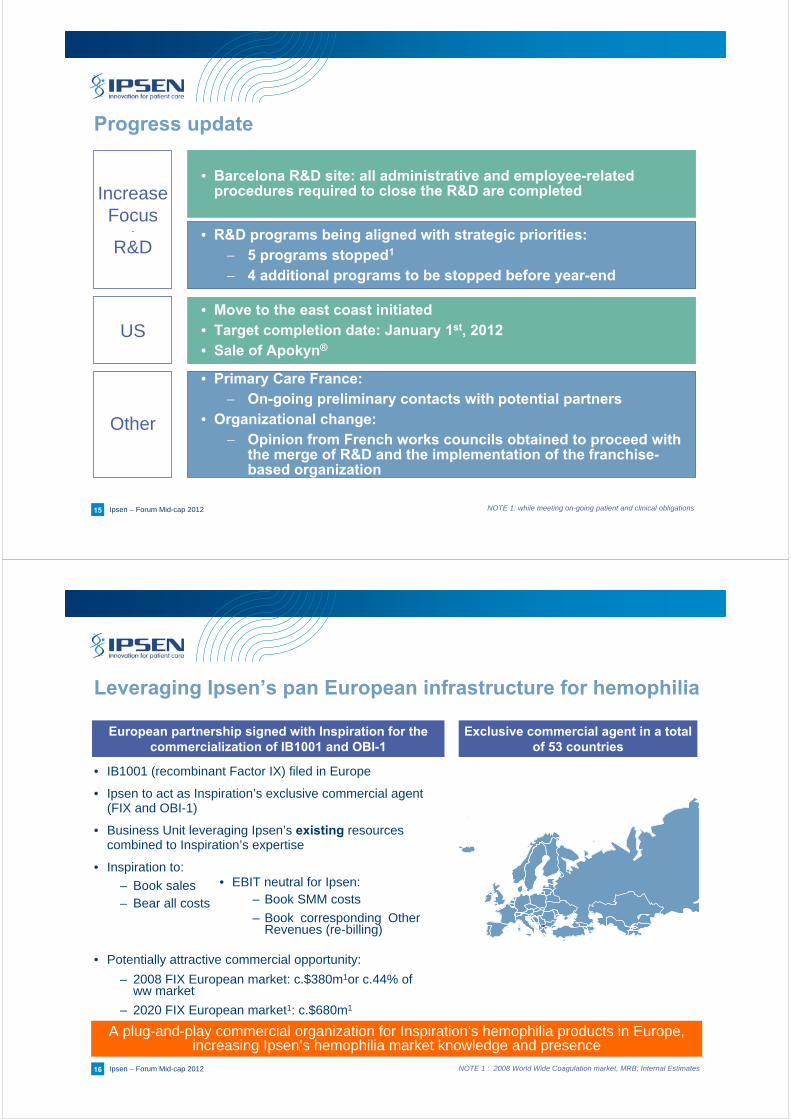
Executive Committee recruitment completed
Hemophilia Alliance
Supporting the businessDriving global demand Ensuring Supply
CEO
General counsel
Strategy, BD and Market
Access
Human resources
Finance
Regions and franchises reporting to Operations
Etienne de Blois
Pierre Boulud
Research & Development
Technical Operations
Operations
ChristopheJean
Claude Bertrand
Eric Drapé
NathalieJoannes
SusheelSurpal
October 1st, 2011
December 1st, 2011
Arriving on Arriving on
NathalieJoannes
SusheelSurpal
15 Ipsen – Forum Mid-cap 2012
Progress update
• Barcelona R&D site: all administrative and employee-related procedures required to close the R&D are completedIncrease
Focus-
R&D• R&D programs being aligned with strategic priorities:
5 programs stopped1
4 additional programs to be stopped before year-end
NOTE 1: while meeting on-going patient and clinical obligations
• Move to the east coast initiated• Target completion date: January 1st, 2012• Sale of Apokyn®
US
• Primary Care France: On-going preliminary contacts with potential partners
• Organizational change: Opinion from French works councils obtained to proceed with
the merge of R&D and the implementation of the franchise-based organization
Other
16 Ipsen – Forum Mid-cap 2012
Leveraging Ipsen’s pan European infrastructure for hemophilia
• IB1001 (recombinant Factor IX) filed in Europe
• Ipsen to act as Inspiration’s exclusive commercial agent (FIX and OBI-1)
• Business Unit leveraging Ipsen’s existing resources combined to Inspiration’s expertise
• Inspiration to:
– Book sales– Bear all costs
• Potentially attractive commercial opportunity:
– 2008 FIX European market: c.$380m1or c.44% of ww market
– 2020 FIX European market1: c.$680m1
European partnership signed with Inspiration for the commercialization of IB1001 and OBI-1
A plug-and-play commercial organization for Inspiration’s hemophilia products in Europe, increasing Ipsen’s hemophilia market knowledge and presence
NOTE 1 : 2008 World Wide Coagulation market, MRB; Internal Estimates
Exclusive commercial agent in a total of 53 countries
• EBIT neutral for Ipsen: – Book SMM costs
– Book corresponding Other Revenues (re-billing)
17 Ipsen – Forum Mid-cap 2012
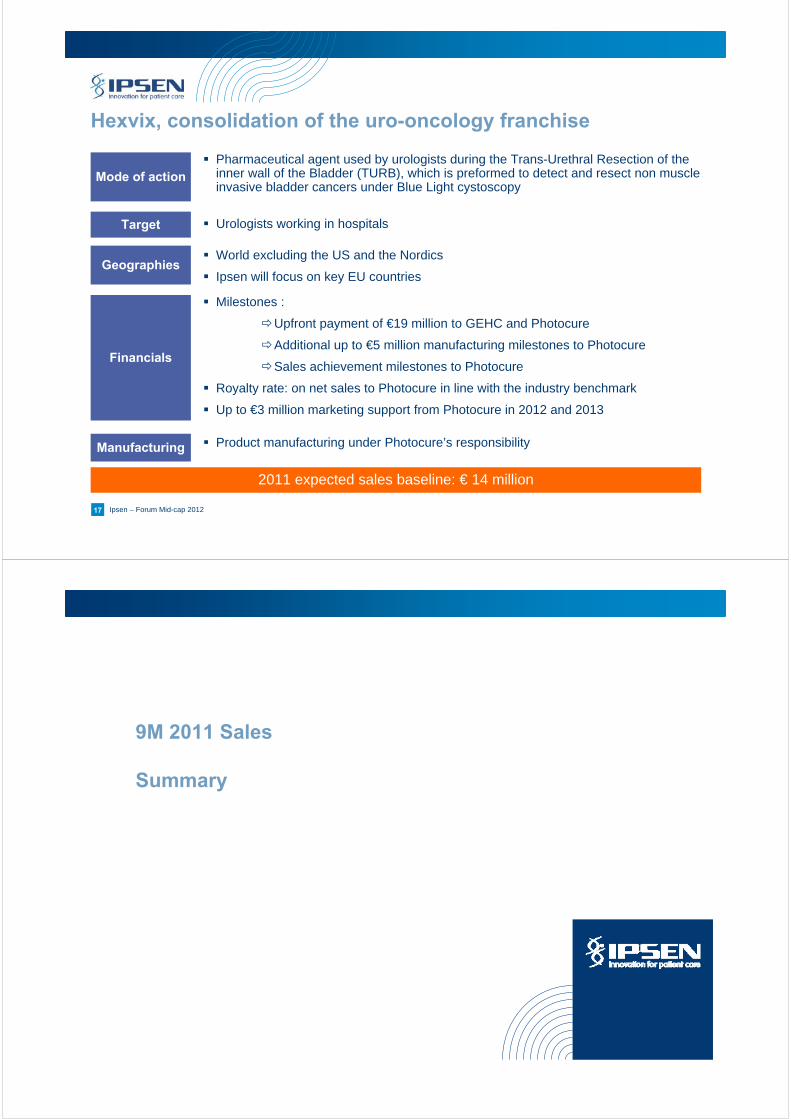
Hexvix, consolidation of the uro-oncology franchise
Geographies
Mode of action
Financials
World excluding the US and the Nordics
Ipsen will focus on key EU countries
Pharmaceutical agent used by urologists during the Trans-Urethral Resection of the inner wall of the Bladder (TURB), which is preformed to detect and resect non muscle invasive bladder cancers under Blue Light cystoscopy
Milestones :
Upfront payment of €19 million to GEHC and Photocure
Additional up to €5 million manufacturing milestones to Photocure
Sales achievement milestones to Photocure
Royalty rate: on net sales to Photocure in line with the industry benchmark
Up to €3 million marketing support from Photocure in 2012 and 2013
2011 expected sales baseline: € 14 million
Manufacturing Product manufacturing under Photocure’s responsibility
Target Urologists working in hospitals
9M 2011 Sales
Summary
19
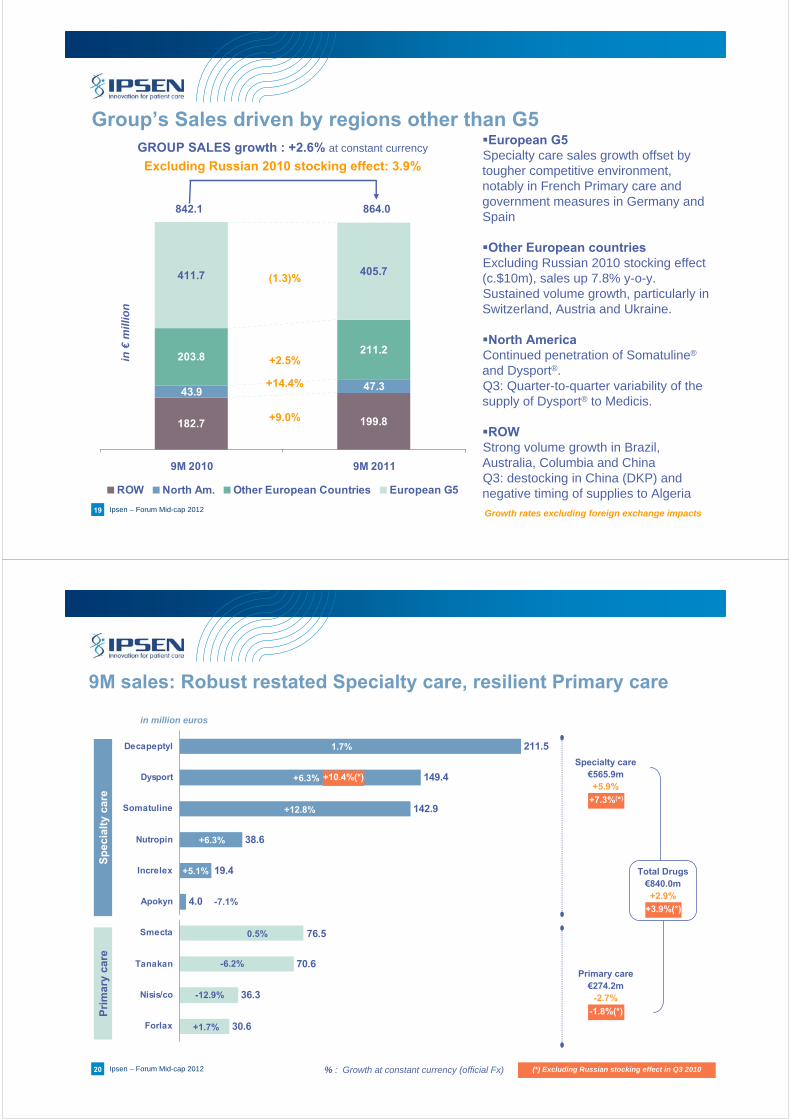
Group’s Sales driven by regions other than G5
Growth rates excluding foreign exchange impacts
European G5 Specialty care sales growth offset by tougher competitive environment, notably in French Primary care and government measures in Germany and Spain
Other European countriesExcluding Russian 2010 stocking effect (c.$10m), sales up 7.8% y-o-y.Sustained volume growth, particularly in Switzerland, Austria and Ukraine.
North AmericaContinued penetration of Somatuline®
and Dysport®.Q3: Quarter-to-quarter variability of the supply of Dysport® to Medicis.
ROWStrong volume growth in Brazil, Australia, Columbia and China Q3: destocking in China (DKP) and negative timing of supplies to Algeria
199.8182.7
47.343.9
211.2203.8
405.7411.7
9M 2010 9M 2011
ROW North Am. Other European Countries European G5
+9.0%
(1.3)%
+2.5%
+14.4%
in €
mil
lio
n
GROUP SALES growth : +2.6% at constant currency
Excluding Russian 2010 stocking effect: 3.9%
842.1 864.0
Ipsen – Forum Mid-cap 2012
20 Ipsen – Forum Mid-cap 2012
211.5
149.4
142.9
30.6
36.3
70.6
76.5
4.0
19.4
38.6
Forlax
Nisis/co
Tanakan
Smecta
Apokyn
Increlex
Nutropin
Somatuline
Dysport
Decapeptyl
9M sales: Robust restated Specialty care, resilient Primary care
+5.1%
+6.3%
+1.7%
-12.9%
0.5%
in million euros
1.7%
-6.2%
Sp
ecia
lty
care
Pri
mar
y ca
re
+12.8%
+6.3%
% : Growth at constant currency (official Fx)
-7.1%
Specialty care€565.9m+5.9%
Total Drugs€840.0m+2.9%
+7.3%(*)
Primary care€274.2m
-2.7%
-1.8%(*)
+3.9%(*)
(*) Excluding Russian stocking effect in Q3 2010
+10.4%(*)
21 Ipsen – Forum Mid-cap 2012
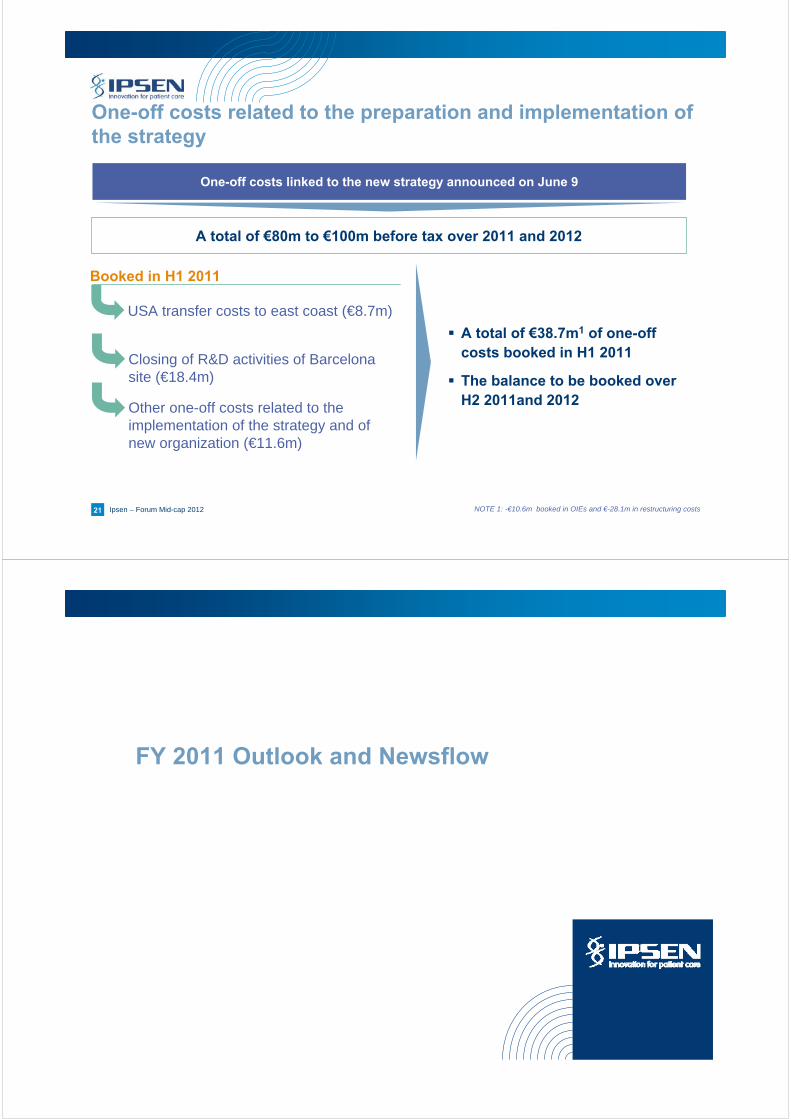
Other one-off costs related to the implementation of the strategy and of new organization (€11.6m)
One-off costs related to the preparation and implementation of the strategy
USA transfer costs to east coast (€8.7m)
Closing of R&D activities of Barcelona site (€18.4m)
One-off costs linked to the new strategy announced on June 9
A total of €80m to €100m before tax over 2011 and 2012
A total of €38.7m1 of one-off costs booked in H1 2011
The balance to be booked over H2 2011and 2012
NOTE 1: -€10.6m booked in OIEs and €-28.1m in restructuring costs
Booked in H1 2011
FY 2011 Outlook and Newsflow

23 Ipsen – Forum Mid-cap 2012
Revised 2011 financial objectives
The above objectives are set at constant currency
2011 objective excludes any potential non recurring items
NOTE 1 :before non recurring elements particularly related to the preparation and implementation of the Group’s strategy
Recurring Adjusted1
operating incomeUpper range of 190 million euros to 200 million
euros
Specialist Care
Drug sales
Primary Care
Drug sales
Drug Sales growthclose to + 8.0% year-on-year
Drug sales decrease of (3.0%) to (5.0%) year-on-year
Specialist Care
Drug sales
Primary Care
Drug sales
Drug Sales growthclose to + 8.0% year-on-year
Drug sales decrease of (8.0%) to (10.0%) year-on-year,
pending evolution in France
March 2011
August2011
24 Ipsen – Forum Mid-cap 2012
News flow – upcoming catalysts
After the sale of Apokyn®, maximize the value of Increlex® in the US while meeting the
obligations to patients and partners
Filing of IB1001 in the US (H1 2012)
New future for Primary Care France and Dreux manufacturing plant
New US platform fully operational
NOTE 1: subject to workers’ council opinion

25 Ipsen – Forum Mid-cap 2012
Appendices
Zoom on
Endocrinology/ Somatuline®

27 Ipsen – Forum Mid-cap 2012
Global Somatostatin Analog (SSA) market in 2010 : ~ 1.1 billion euros…
Note 1: Actual (Somatuline® + Sandostatin) reported salesOthers : based on company reported sales ; IMS MIDAS MAT Q4 2010
2010 SSA market: ~€ 1.1bn
Solid SSA market growth (+9%1 in 2009 and +18%1 in 2010)
A fairly balanced geographical split between Europe (42% of total sales), the US (35%) and the RoW (23%)
Somatuline®, an established product in Europe both in Acromegaly and in NET with 55% SSA market share in France and 32% SSA market Share in G5
Ramping up acromegaly sales in the US with only 2.4% SSA long acting market share in 2010
Europe42%
USA35%
RoW23%
Geographical split of the SSA market
Examples of Ipsen market shares in SSA
market
Q4, 2010 market figures
32%
2%
55%
G5 North America France
28 Ipsen – Forum Mid-cap 2012
… exceeding 1.6 billion euros in 2020, driven by NET
NET incidence over 30 years Steady 3.8%1 CAGR until 2020
Note 1: Company’s internal dataNote 2: US Surveillance Epidemiology and End Results (SEER) 2008
Incidence per 100,000 for NET between 1973 - 20042
2020 SSA market: ~€1.6bn1 (+ 45% or 3.8% CAGR)
Growth in the SSA market mainly driven by:
NET • Studies suggest that NET incidence has been
growing rapidly over the past several decades, particularly in the US
• Increased awareness of NETs results in a wider availability of improved diagnostic techniques
The US• +4.6%1 expected market growth in the US
between 2010-2020 (world most solid growth)SEER9 SEER13 SEER17
Inci
den
ce p
er 1
00,0
00
Inci
den
ce p
er 1
00,0
00 f
or
Neu
roen
do
crin
etu
mo
rs
0
1
2
3
4
5
6
1973
1974
1975
1976
1977
1978
1979
1980
1981
1982
1983
1984
1985
1986
1989
1990
1991
1992
1993
1994
1995
1996
1997
1998
1999
2000
2001
2002
2003
2004
0
100
200
300
400
500
600Incidence of neuroendocrine tumors
Incidence of all malignant neoplasms

29 Ipsen – Forum Mid-cap 2012
Great potential lies ahead for Somatuline®…
… while SSA market is expected to grow 3.8% CAGR until 2020
Number of indications
RevenuesSmall Large
Somatuline®
in the US
Somatuline®
in EU + RoW
Current Somatuline®
market share
Target Somatuline®
market share
Somatuline®
in EU + RoW
Full Potential
Medium
Somatuline®
in the US
30 Ipsen – Forum Mid-cap 2012
Improve visibility & clinical development
Geographic and indication footprint
Investment and capabilities
Partnerships
Leverage product differentiation
Now
Tomorrow
Key
NET and the US : two main growth drivers
Ipsen to work on key levers to reach full potential

31 Ipsen – Forum Mid-cap 2012
New additional elements of differentiation
New device Retractable needle to ensure full dose
release Optimal safety for hospital care
practitioners/ patients Health economic benefits related to
absence of clogging and no need for reconstitution
Increased extended dosing interval worldwide
Approved in the US in March 2011
From one injection every 4 weeks (60-90mg) to every 6-8 weeks (120mg)
Increased comfort for the patients
Economic benefit
10 step reconstitution needed
32 Ipsen – Forum Mid-cap 2012
Partnerships to explore new treatment paradigm
Drive guidance on patients profiles who would benefit most from both agents
Build upon respective best-in-class position to develop medical education on gastro-entero-pancreatic NET (GEP NET) management
&
Medical education initiative kicked off at ENETS(joint symposium on March 11th 2011 in Lisbon)
Innovative partnership with Pfizer Europe in Neuro Endocrine Tumors (NET)

33 Ipsen – Forum Mid-cap 2012
New indications: Functioning NET in the US and Non Functioning NET worldwide
Functioning NET for US labelNon Functioning NET worldwide -
CLARINET Recruitment target: 100 patients
Global recruitment status on target for completion end of 2012
Carcinoid syndrome initially slow to recruit due to trial design and ongoing competitive trials
12 countries planned (US + 11 ROW countries), 66 sites (56 Row + 10 US)
RECRUITMENT COMPLETED end of April 2011
200 patients accrued (45 centers in 14 countries)
Note 1: WHO The Atlas of Heart Disease and Stroke, Dr Judith MacKay and Dr George A. Mensah
Brazil Croatia Czech Rep. India Latvia Poland
Russia Serbia South Africa Turkey Ukraine
USA Austria Belgium Czech Rep. Denmark France Germany India
Italy Poland Slovakia Spain Sweden UK US
Somatuline®, potentially the only SSA with functioning and non-functioning NET label
34 Ipsen – Forum Mid-cap 2012
Somatuline® Autogel 2020: a globalized reach
Acromegaly
Geography/Indication
Functioning NET
Europe US China Brazil Russia
Ipsen presence
Non functioning
NET-
LatAm and Asia covered through partnerships
-
Zoom on
Neurology/ Dysport®
36 Ipsen – Forum Mid-cap 2012
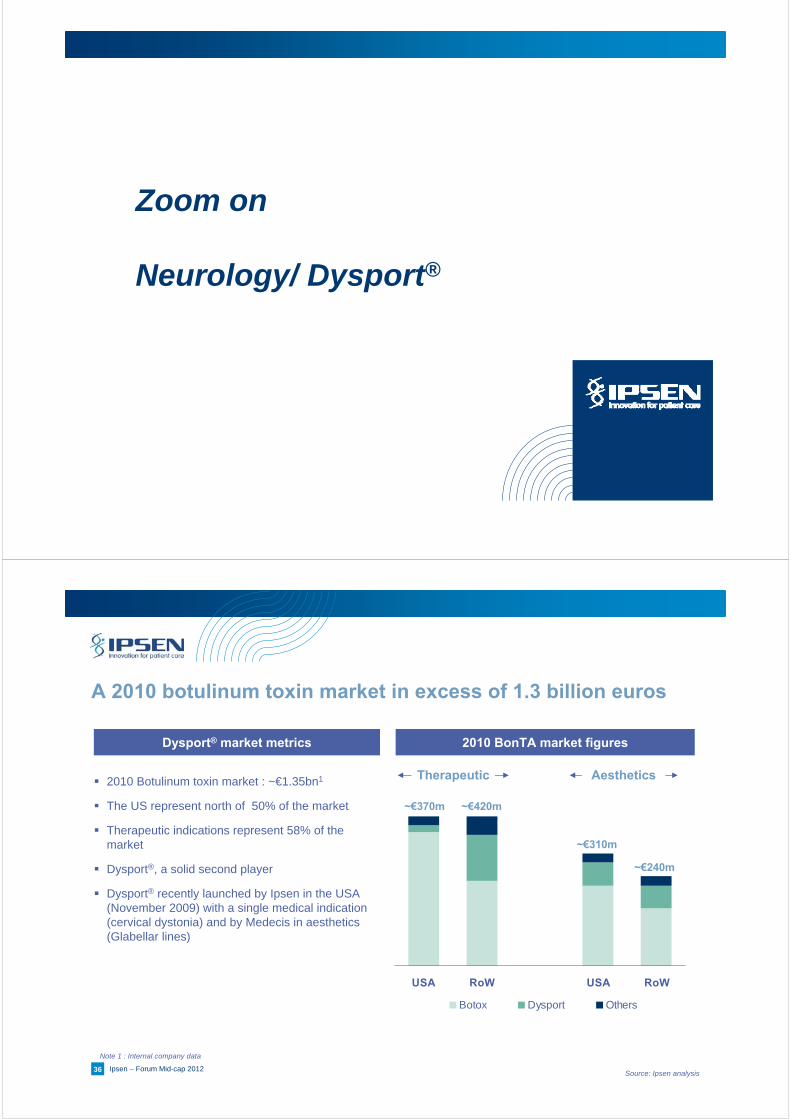
A 2010 botulinum toxin market in excess of 1.3 billion euros
Dysport® market metrics 2010 BonTA market figures
Source: Ipsen analysis
Note 1 : Internal company data
USA RoW USA RoW
Botox Dysport Others
Therapeutic Aesthetics
~€370m ~€420m
~€310m
~€240m
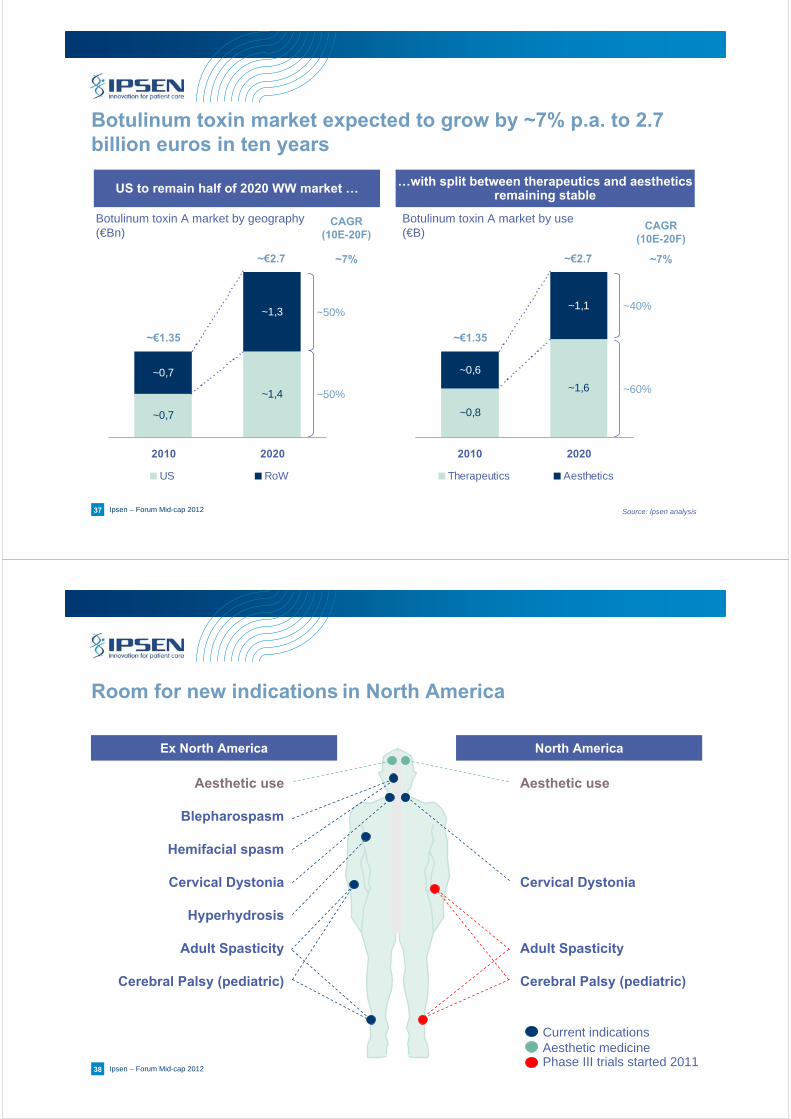
2010 Botulinum toxin market : ~€1.35bn1
The US represent north of 50% of the market
Therapeutic indications represent 58% of the market
Dysport®, a solid second player
Dysport® recently launched by Ipsen in the USA (November 2009) with a single medical indication (cervical dystonia) and by Medecis in aesthetics (Glabellar lines)
37 Ipsen – Forum Mid-cap 2012 Source: Ipsen analysis
Botulinum toxin A market by geography(€Bn)
Botulinum toxin A market by use(€B)
CAGR(10E-20F)
~7%
~50%
CAGR(10E-20F)
US to remain half of 2020 WW market … …with split between therapeutics and aesthetics remaining stable
~0,8
~1,6
~0,6
~1,1
2010 2020
Therapeutics Aesthetics
~€1.35
~€2.7
~0,7
~1,4
~0,7
~1,3
2010 2020
US RoW
~€1.35
~€2.7
~50%
~40%
~60%
~7%
Botulinum toxin market expected to grow by ~7% p.a. to 2.7 billion euros in ten years
38 Ipsen – Forum Mid-cap 2012
Room for new indications in North America
Ex North America
Aesthetic use
Blepharospasm
Hemifacial spasm
Cervical Dystonia
Hyperhydrosis
Adult Spasticity
Cerebral Palsy (pediatric)
Aesthetic use
Cervical Dystonia
Adult Spasticity
Cerebral Palsy (pediatric)
Phase III trials started 2011Aesthetic medicineCurrent indications
North America
39 Ipsen – Forum Mid-cap 2012
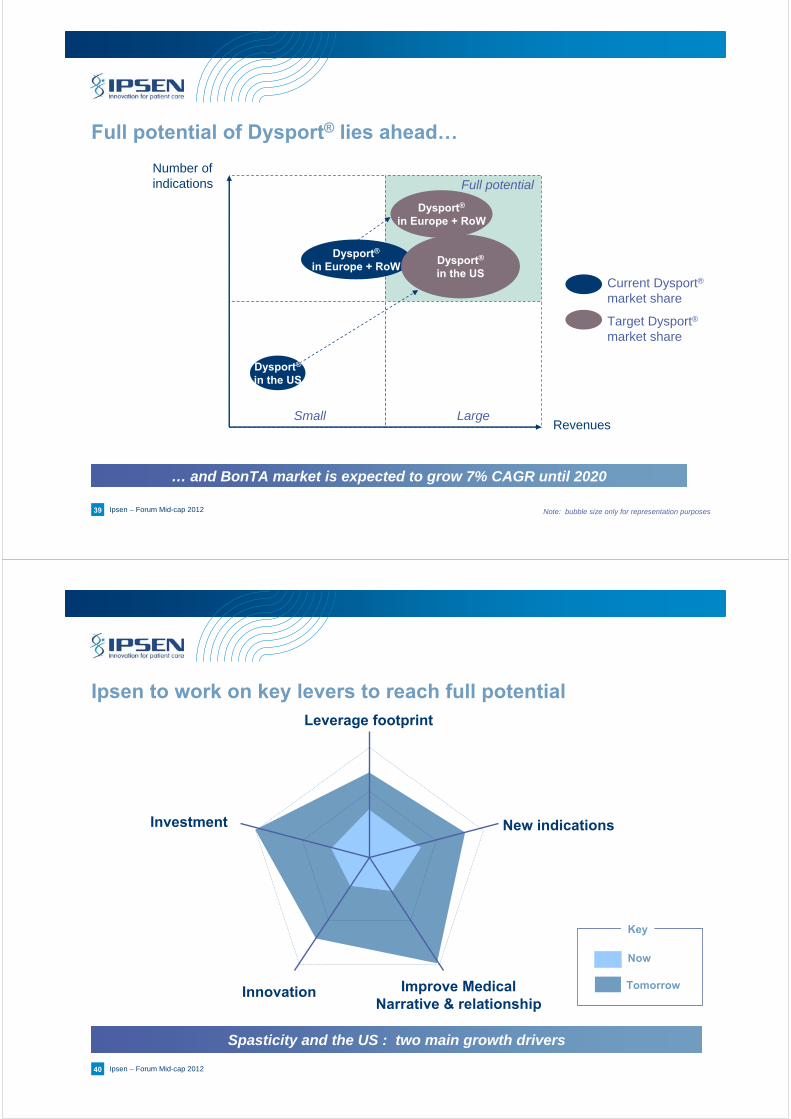
Full potential of Dysport® lies ahead…
… and BonTA market is expected to grow 7% CAGR until 2020
Number of indications
Dysport®
in Europe + RoW
Full potential
Small Large
Dysport®
in the US
Dysport®
in Europe + RoW
Current Dysport®
market share
Target Dysport®
market share
Revenues
Dysport®
in the US
Note: bubble size only for representation purposes
40 Ipsen – Forum Mid-cap 2012
Ipsen to work on key levers to reach full potential
Improve MedicalNarrative & relationship
New indications
Innovation
Investment
Leverage footprint
Now
Tomorrow
Key
Spasticity and the US : two main growth drivers
41 Ipsen – Forum Mid-cap 2012
1.Glabellar Lines
1.Cervical Dystonia2.Adult arm spasticity3.Blepharospasm4.Hemifacial spasm5.Paediatric per
equinus spasticiy (Cerebral palsy)
6.Hyperhidrosis7.Pediatric Lower
Limb8.Pediatric Upper
Limb9.Neurogenic
Detrusor Over-activity
Dysport® 2020 footprint aspiration : More geographies, more indications
1.Cervical Dystonia2.Adult arm spasticity3.Blepharospasm4.Hemifacialspasm5.Paediatric per
equinus spasticiy (Cerebral palsy)
6.Adult leg spasticity (in three EU markets)
7.Hyperhidrosis8.Pediatric arm
spasticity9.Neurogenic
Detrusor Over-activity
1.Glabellar Lines2.Canthal Lines
1.Glabellar Lines2.Canthal Lines
1.Cervical Dystonia2.Adult Upper Limb3.Adult Lower Limb4.Pediatric Lower
Limb5.Pediatric Upper
Limb6.Neurogenic
Detrusor Over-activity
1.Cervical Dystonia2.Adult arm spasticity3.Blepharospasm4.Hemifacialspasm5.Paediatric per
equinus spasticiy (Cerebral palsy)
6.Adult leg spasticity7.Hyperhidrosis8.Pediatric Upper
Limb9.Neurogenic
Detrusor Over-activity
1.Glabellar Lines 1.Glabellar Lines
1.Cervical Dystonia2.Other indications
under assessmentTherapeutic
Geography/Therapeutic area
Europe US China Brazil Russia
Aesthetic
42 Ipsen – Forum Mid-cap 2012
New indications: Focus on spasticity and urology indications
Focus on spasticity in the short term… … and in urology in the longer term
Current spasticity indications: Adult upper (ex-US) and lower limb (limited
markets)
Pediatric lower limb (ex-US)
Spasticity, a major short-term growth opportunity:
Stroke : 15 million people worldwide every year. 5 million are left permanently disabled1
World-wide Adult and Pediatric Ph III program (4 trials):
4 new indications in the US
New and/ or Improved labeling ex-US
Leverage current access to prescriber base:
Clear synergies with Uro-oncology franchise in Europe
Clear WW synergies with neuro-rehabilitation environment
Neurogenic Detrusor Overactivity: Ph IIa started (NCT01357980):
First patient screened in May 2011
Limited cost and high probability of success
Urology indications, a significant mid term growth potential
Note 1: WHO The Atlas of Heart Disease and Stroke, Dr Judith MacKay and Dr George A. Mensah

43 Ipsen – Forum Mid-cap 2012
Dysport® Next Generation: a potential new exciting opportunity
The first ready-to-use toxin A…
…is a breakthrough innovation bringing clear differentiation vs. competitors
…saves time by avoiding reconstitution
…improves safety (dilution/dosage, reconstitution, single use product …)
…has very positive qualitative and quantitative market research results1 (c. 500 participants) :
83% of potential adopters on time saving and improved safety grounds
A WW Ph III program to assess safety and efficacy:
Indication : Cervical Dystonia
350 patients
71 sites (42 in Europe, 29 in the US)
First patients recruited in Europe
US recruitment pending feedback from FDA in Q3 2011
A complex manufacturing process with technical hurdles to be addressed
Ipsen team fully mobilized to bring R&D project to fruition
Potentially, a major change in market paradigm
A potentially transforming project
Note 1: with Neurologists and Neuro–rehabilitators
Zoom on
Uro-Oncology/ Decapeptyl®

45 Ipsen – Forum Mid-cap 2012
A franchise with renewed growth opportunities
Decapeptyl®
for hormone-sensitive tumors
Tasquinimod
for castrate resistant tumors
Once a day oral formulation in PhIII
Hexvix®
for bladder cancer detection
46 Ipsen – Forum Mid-cap 2012
Risk of true long acting GnRH analogs generics entry expected to be low
Only hybrids of leuprorelin are available today1
Hybrids are currently not substitutable and priced 20-25% below original products
In Germany, the 2 leuprorelin hybrids have reached less than 10% MS in 3 years2 with no impact on class price yet
Hybrids represent a moderate threat to GnRHa established brands compared to true generics
Impact of hybrids on market shares MEU (*) in Germany
Hybrids rather than true generics
No true generics of GnRH analogs anticipated, only Hybrids
Note 1 : goserelin hybrid has been withdrawn from the 2 markets where they were launched (UK and GER)
Note 2 : despite promotional investments and push from payers
0%
10%
20%
30%
40%
50%
2006 2007 2008 2009 2010
Suprefact EnantoneEligard Zoladex Decapeptyl Leupro Hybrids
(*) MEU = Monthly equivalent units
Source: Insight Health, OdV data - Germany
47 Ipsen – Forum Mid-cap 2012
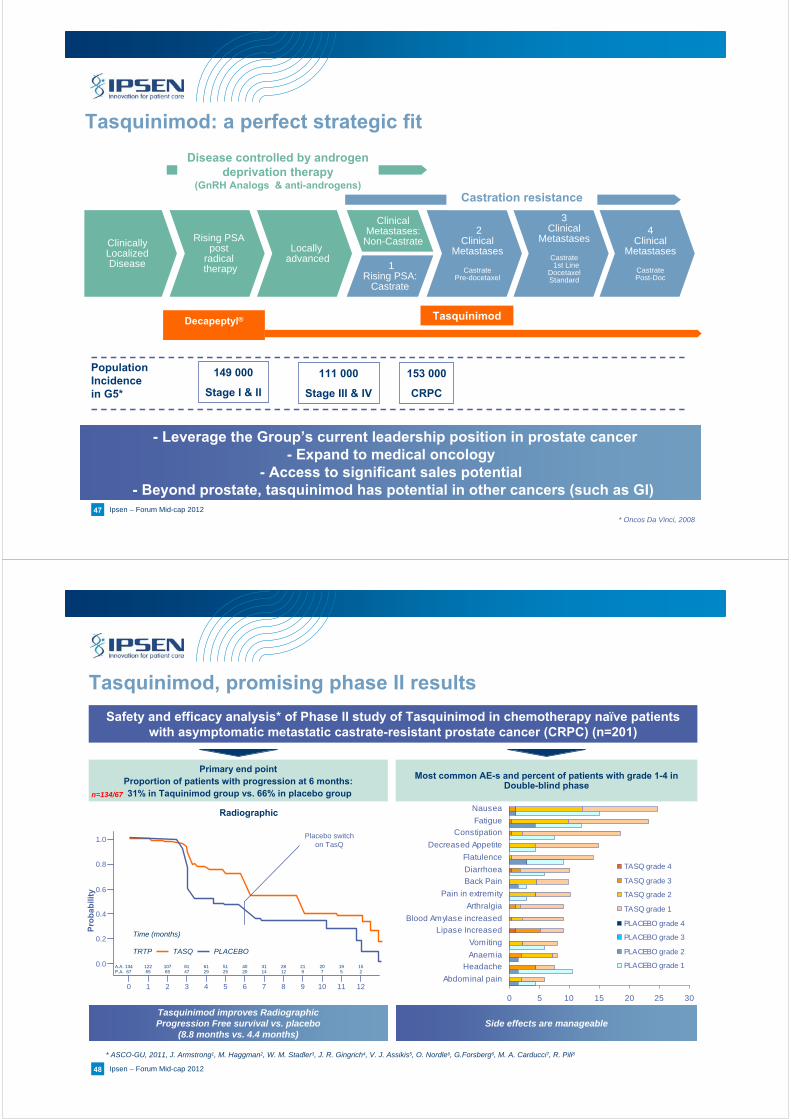
- Leverage the Group’s current leadership position in prostate cancer - Expand to medical oncology
- Access to significant sales potential- Beyond prostate, tasquinimod has potential in other cancers (such as GI)
* Oncos Da Vinci, 2008
111 000
Stage III & IV
149 000
Stage I & II
153 000
CRPC
Population Incidence in G5*
Decapeptyl® Tasquinimod
Rising PSA post
radical therapy
ClinicallyLocalizedDisease 1
Rising PSA:Castrate
ClinicalMetastases:
Non-Castrate2
ClinicalMetastases
CastratePre-docetaxel
3Clinical
Metastases
Castrate1st Line
DocetaxelStandard
4Clinical
Metastases
CastratePost-Doc
Locally advanced
Tasquinimod: a perfect strategic fit
Disease controlled by androgen deprivation therapy
(GnRH Analogs & anti-androgens)Castration resistance
48 Ipsen – Forum Mid-cap 2012
Tasquinimod, promising phase II results
Safety and efficacy analysis* of Phase II study of Tasquinimod in chemotherapy naїve patients with asymptomatic metastatic castrate-resistant prostate cancer (CRPC) (n=201)
* ASCO-GU, 2011, J. Armstrong1, M. Haggman2, W. M. Stadler3, J. R. Gingrich4, V. J. Assikis5, O. Nordle6, G.Forsberg6, M. A. Carducci7, R. Pili8
Primary end point Proportion of patients with progression at 6 months:31% in Taquinimod group vs. 66% in placebo group
Most common AE-s and percent of patients with grade 1-4 in Double-blind phase
Tasquinimod improves Radiographic Progression Free survival vs. placebo
(8.8 months vs. 4.4 months)Side effects are manageable
0 5 10 15 20 25 30
Nausea
Fatigue
Constipation
Decreased Appetite
Flatulence
Diarrhoea
Back Pain
Pain in extremity
Arthralgia
Blood Amylase increased
Lipase Increased
Vomiting
Anaemia
Headache
Abdominal pain
TASQ grade 4
TASQ grade 3
TASQ grade 2
TASQ grade 1
PLACEBO grade 4
PLACEBO grade 3
PLACEBO grade 2
PLACEBO grade 1
n=134/67
Pro
bab
ility
1.0
0.8
0.6
0.4
0.2
0.0
0 1 2 3 4 5 6 7 8 9 10 11 12
67 65 65 47 29 25 20 14 12 9 7 5 2P.A.134 122 107 81 61 51 40 31 28 21 20 19 15A.A.
TRTP TASQ PLACEBO
Time (months)
Radiographic
Placebo switchon TasQ
49 Ipsen – Forum Mid-cap 2012
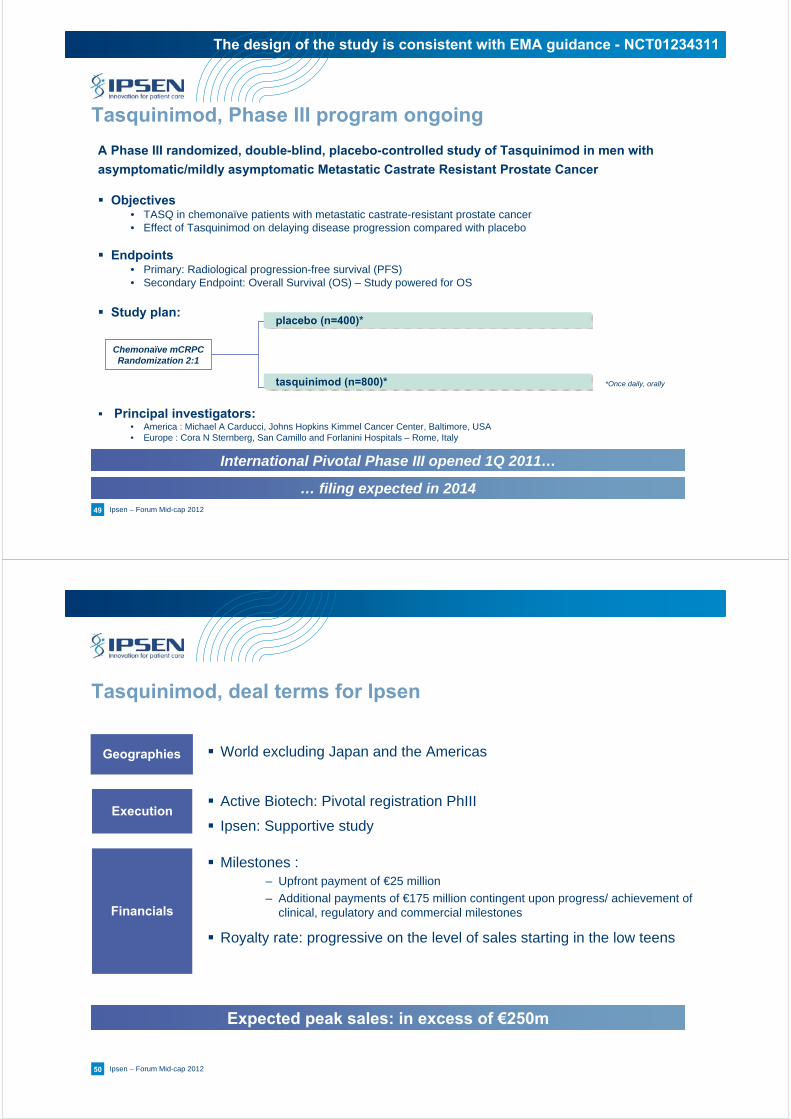
Tasquinimod, Phase III program ongoing
Objectives• TASQ in chemonaïve patients with metastatic castrate-resistant prostate cancer• Effect of Tasquinimod on delaying disease progression compared with placebo
Endpoints• Primary: Radiological progression-free survival (PFS)• Secondary Endpoint: Overall Survival (OS) – Study powered for OS
Study plan:
Principal investigators:• America : Michael A Carducci, Johns Hopkins Kimmel Cancer Center, Baltimore, USA• Europe : Cora N Sternberg, San Camillo and Forlanini Hospitals – Rome, Italy
A Phase III randomized, double-blind, placebo-controlled study of Tasquinimod in men with
asymptomatic/mildly asymptomatic Metastatic Castrate Resistant Prostate Cancer
International Pivotal Phase III opened 1Q 2011…
The design of the study is consistent with EMA guidance - NCT01234311
*Once daily, orally
placebo (n=400)*
tasquinimod (n=800)*
Chemonaïve mCRPCRandomization 2:1
… filing expected in 2014
50 Ipsen – Forum Mid-cap 2012
Tasquinimod, deal terms for Ipsen
Geographies
Execution
Financials
World excluding Japan and the Americas
Active Biotech: Pivotal registration PhIII
Ipsen: Supportive study
Milestones :– Upfront payment of €25 million
– Additional payments of €175 million contingent upon progress/ achievement of clinical, regulatory and commercial milestones
Royalty rate: progressive on the level of sales starting in the low teens
Expected peak sales: in excess of €250m
Zoom on:
Hemophilia
52 Ipsen – Forum Mid-cap 201252
A full fledged hemophilia
franchise, with potentially 4 products
…with a broad potential
inhibitor therapy offering (OBI-1,
FVIIa)…
…differentiated with
OBI-1, the only recombinant porcine FVIII
product...
…and the first recombinant competitor in hemophilia B
therapy, IB1001
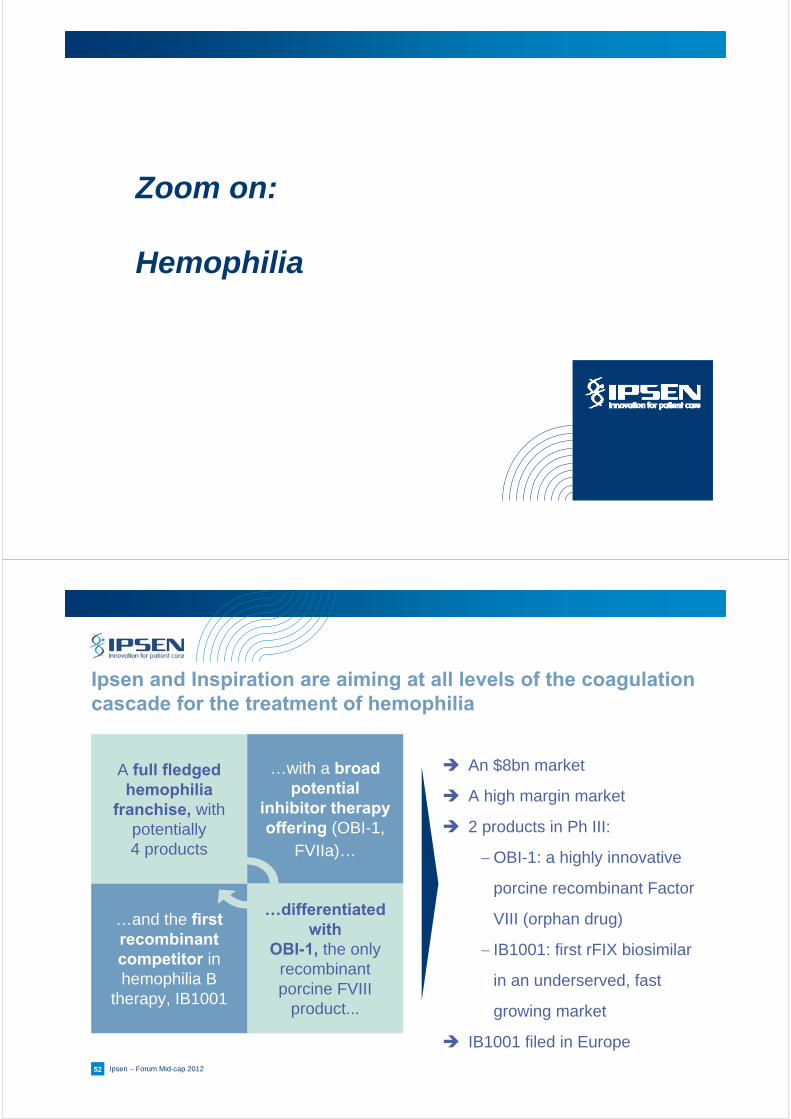
Ipsen and Inspiration are aiming at all levels of the coagulation cascade for the treatment of hemophilia
An $8bn market
A high margin market
2 products in Ph III:
OBI-1: a highly innovative
porcine recombinant Factor
VIII (orphan drug)
IB1001: first rFIX biosimilar
in an underserved, fast
growing market
IB1001 filed in Europe
53 Ipsen – Forum Mid-cap 2012
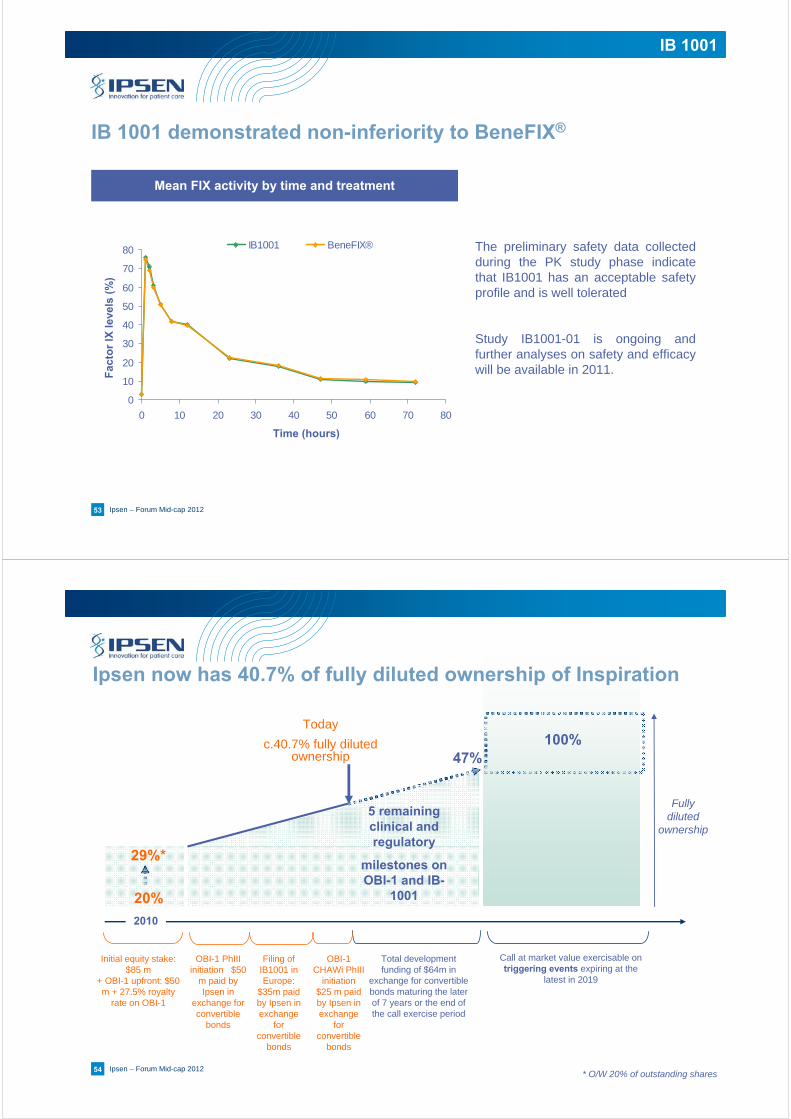
IB 1001 demonstrated non-inferiority to BeneFIX®
The preliminary safety data collected during the PK study phase indicate that IB1001 has an acceptable safety profile and is well tolerated
Study IB1001-01 is ongoing and further analyses on safety and efficacy will be available in 2011.
Mean FIX activity by time and treatment
0
10
20
30
40
50
60
70
80
0 10 20 30 40 50 60 70 80
IB1001 BeneFIX®
Fac
tor
IX l
evel
s(%
)
Time (hours)
IB 1001
54 Ipsen – Forum Mid-cap 201254
100%
Initial equity stake: $85 m
+ OBI-1 upfront: $50 m + 27.5% royalty
rate on OBI-1
Total development funding of $64m in
exchange for convertible bonds maturing the later of 7 years or the end of the call exercise period
Call at market value exercisable on triggering events expiring at the
latest in 2019
Fully diluted
ownership
2010
Ipsen now has 40.7% of fully diluted ownership of Inspiration
20%
47%
29%*
* O/W 20% of outstanding shares
Today
c.40.7% fully diluted ownership
OBI-1 PhIIIinitiation $50
m paid by Ipsen in
exchange for convertible
bonds
Filing of IB1001 in Europe:
$35m paid by Ipsen in exchange
for convertible
bonds
5 remaining clinical and regulatory
milestones on OBI-1 and IB-
1001
OBI-1 CHAWi PhIII
initiation $25 m paid by Ipsen in exchange
for convertible
bonds
Detailed H1 2011 Financial Results
56 Ipsen – Forum Mid-cap 2012
21.6
24.7
45.2
52.0
2.9
12.9
26.0
95.0
105.0
139.2
Forlax
Nisis/co
Tanakan
Smecta
Apokyn
Increlex
Nutropin
Somatuline
Dysport
Decapeptyl
+5.6%
+8.4%
+8.0%
(16.0)%
+3.4%
Sales in € million
(1.2)%
(7.3)%
Sp
ecia
lty
care
Pri
mar
y ca
re
+13.3%
+17.4%
Specialty Care
€381.0m+7.9%
Primary Care
€185.6m+0.1%
DrugSales
€566.6m+5.2%
H1 2011 sales: robust specialty care, resilient primary care
% : sales growth at constant currency
(0.5)%
57
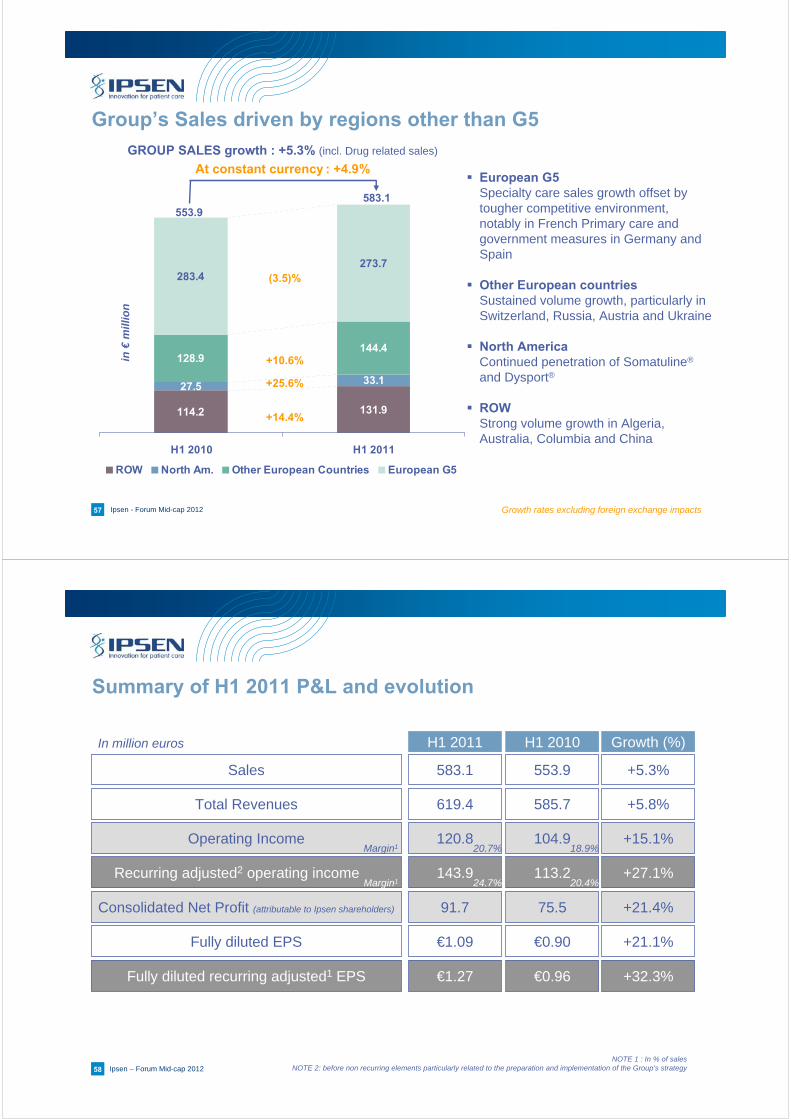
Group’s Sales driven by regions other than G5
Growth rates excluding foreign exchange impacts
European G5 Specialty care sales growth offset by tougher competitive environment, notably in French Primary care and government measures in Germany and Spain
Other European countriesSustained volume growth, particularly in Switzerland, Russia, Austria and Ukraine
North AmericaContinued penetration of Somatuline®
and Dysport®
ROWStrong volume growth in Algeria, Australia, Columbia and China
131.9114.2
33.127.5
144.4128.9
273.7283.4
H1 2010 H1 2011
ROW North Am. Other European Countries European G5
+14.4%
(3.5)%
+10.6%
+25.6%
in €
mil
lio
n
GROUP SALES growth : +5.3% (incl. Drug related sales)
At constant currency : +4.9%
553.9583.1
Ipsen - Forum Mid-cap 2012
58 Ipsen – Forum Mid-cap 2012
Summary of H1 2011 P&L and evolution
58
Sales
Operating Income
Recurring adjusted2 operating income
Consolidated Net Profit (attributable to Ipsen shareholders)
Total Revenues
Fully diluted EPS
Fully diluted recurring adjusted1 EPS
583.1
120.8
143.9
91.7
619.4
€1.09
€1.27
553.9
104.9
113.2
75.5
585.7
€0.90
€0.96
+5.3%
+15.1%
+27.1%
+21.4%
+5.8%
+21.1%
+32.3%
H1 2011 H1 2010 Growth (%)In million euros
NOTE 1 : In % of salesNOTE 2: before non recurring elements particularly related to the preparation and implementation of the Group’s strategy
Margin1 20.7% 18.9%
Margin1 24.7% 20.4%

59 Ipsen – Forum Mid-cap 2012
Other revenues evolution
18.0
12.7
14.1
16.9
4.2
2.1
H1 2010 H1 2011
Other revenues Milestones Royalties received
(16.8)%
+ 42.2%
Other Revenues evolution: +14.4% or
+7.1% excluding Inspiration Inc.
31.7
in €
mil
lio
n
+96.0%
36.3 Royalties Received Royalties received in H1 2011 doubled with increased royalties from Medicis, Galderma and Menarini
MilestonesDecrease mainly due to accelerated recognition of 2010 taspoglutide Deffered Revenues
Other revenuesInvoicing of OBI-1’s development costs to Inspiration Inc. and income from the Group’s Co-promotion contracts in France
60 Ipsen – Forum Mid-cap 2012
H1 2010 H1 2011
COGS (€m)
22.1%(1) 20.7%(1)
Research & Development (€m)
Sales & Marketing (€m)
H1 2010 H1 2011
+8.5%
(0.1)% Selling expenses
Royalties paid
+0.8%
G&A (€m)
(1.4)%
205.6203.9
120.9122.6
182.2 182.0
H1 2010 H1 2011
+3.9%Drug-related R&D
Industrial development(including invoice to Inspiration inc.)
+6.7% as reported
105.899.1
86.1 89.7
H1 2010 H1 2011
(2.1)%
7.9%(1) 7.3%(1)
42.643.6
(1) In % of sales
+28.0%10.513.4
21.7 23.5
P&L expenses under control

61 Ipsen – Forum Mid-cap 2012
In € million
104.9
3.6
113.2
4.6
Reported EBIT PPA Other RecurringAdjusted EBIT
R epo rted EB IT Expenses linkedwith the strategy
anno unced o nJune 9th, 2011
P P A Others R ecurringA djusted EB IT
+15.1% As reported
+ 27.1%Recurring adjusted
H1 2010 actuals
H1 2011 actuals
17.21.6
143.8
38.7
120.8
Recurring adjusted1 Operating Income has improved by 27.1 %
Mainly Barcelona R&D site & US restructuring
Proceeds from litigation
Reorganization costs
NOTE 1: before non recurring elements particularly related to the preparation and implementation of the Group’s strategy
62 Ipsen – Forum Mid-cap 2012
H1 2010 H1 2011
P&L – below EBIT
H1 2010 H1 2011
Income from Associates (€m)
(4.1)
Financial result (€m)
Inspiration
Consolidated result (€m)
H1 2010 H1 2011
H1 2010 H1 2011
80.8
107.5
PPA & expenses linked to the new strategy
+32.9%
Recurring Adjusted1
(5.1)
Effective tax rate (% of PBT)
(3.8)
1.2
Litigation
20.4%
PPA
Inspiration
+ 32.3%1
NOTE 1: before non recurring elements particularly related to the preparation and implementation of the Group’s strategyNOTE 2 : Fully diluted recurring adjusted EPS
EPS2: €1.27
EPS2: €0.96
21.5%

63 Ipsen – Forum Mid-cap 2012
Balance sheetAssets Liabilities
2010 H1 2011 2010 H1 2011
Goodwill 299.1 290.7 Equity 1 077.2 1 072.8
Investment in associated companies(incl. Goodwill Inspiration Inc.)
57.9 49.4 Minority interests 2.0 2.2
Property, Plans & equipments
282.3 275.2 Total Equity 1 079.2 1 075.0
Intangible assets 166.5 182,7 Long-term financial debts 15.3 17.1
Other non-current assets 232.6 253.0Other non-current liabilities
250.6 235.0
Total non-current assets 1 038.4 1 050.9Other current liabilities
324.7 337.4
Total current assets 639.8 624.5 Short-term debts 7.7 10.5
Incl. Cash and cash equivalent 178.1 159.6Liabilities / discontinued operations
0.7 0.5
Discontinued operations - -
Total assets 1 678.2 1 675.5 Total Liabilities 1 678.2 1675.5
Net Cash 156.0 132.0
In € million
64 Ipsen – Forum Mid-cap 2012
Cash flow statement
3.753.1Deferred revenues from partnerships
In million euros H1 2010 H1 2011
Cash Flow before change in working capital 98.6 123.8
Increase/ Decrease in working capital (17.0) (30.2)
Net cash flow generated by operating activities 134.7 97.3
Investment in Tangible and Intangible assets (25.5) (44.2)
Investment in Inspiration
Subscription in Inspiration’s bonds
(57.6)
(35.5)
-
(0.8) Others (5.6) (3.1)
Net cash flow used in investing activities (124.3) (48.1)
Net change in borrowings (0.2) (0.2) Dividends paid (62.3) (66.5) Others (1.0) (0.4)
Net cash flow used in financing activities (63.4) (67.1)
Discontinued operations (0.0) -Change in cash and cash equivalent (53.0) (17.9)
Impact of exchange rate fluctuations 11.7 (5.0) Closing cash & cash equivalents 164.1 155.0
Closing Net Cash 142.1 132.0

65 Ipsen – Forum Mid-cap 2012
Deferred revenues
12.916.2
31.025.6
167.6
233.4
H1 2010 H1 2011 Payments recognised as revenues in (n+2) and beyond
Payments recognised as revenues in (n+1)
Payments recognised as revenues in (n)
(17.4)%
(28.2)%
(26.6)%
Total Milestones cashed-in and not yet recognized as revenues
Main evolutions
In €
mill
ion
206.1
280.6
(20.4)%
• 2010: accelerated recognition of the
remaining taspoglutide deferred
revenues from Roche
• H1 2010: important milestones
revenue from Inspiration ($50m) and
Menarini (€18m)