price close relative to pcomp (rhs) - … · fy18-20f, driven by large rollouts for its jollibee,...
TRANSCRIPT

Company Note │ Alpha series Food & Beverages│Philippines│May 15, 2018 Shariah Compliant
IMPORTANT DISCLOSURES, INCLUDING ANY REQUIRED RESEARCH CERTIFICATIONS, ARE PROVIDED AT THE END OF THIS REPORT. IF THIS REPORT IS DISTRIBUTED IN THE UNITED STATES IT IS DISTRIBUTED BY CIMB SECURITIES (USA), INC. AND IS CONSIDERED THIRD-PARTY AFFILIATED RESEARCH.
Powered by the EFA Platform
INITIATION
Jollibee Foods Corp The bee is king ■ Jollibee Foods Corporation (JFC) is the largest QSR operator in the Philippines, with
3,797 outlets worldwide as of end-FY17. ■ We forecast JFC’s net profit to rise 13.5% p.a. over FY18-20F, underpinned by strong
SSSG and its aggressive expansion plan. ■ Initiate coverage with a Hold rating as we believe the stock is fully valued. Our DCF-
based target price is Php300 (WACC: 9.36%).
Largest QSR operator in the Philippines Jollibee Foods Corporation (JFC) is the largest quick service restaurants (QSR) operator in the Philippines, with 3,797 outlets (PH: 2,875, overseas: 922) as of end-FY17. It commands 55.4% sales value market share in the Philippine fast food industry (2017), according to Euromonitor. We believe JFC is poised to benefit from the country’s buoyant consumer spending, underpinned by growing disposable income and higher average ticket size per order.
Expansion in the Philippines warranted, far from saturation We forecast JFC to grow its domestic store network at a CAGR of 8% over FY18-20F, driven by large rollouts for its Jollibee, Chowking and Mang Inasal brands. According to the company, it has identified c.350 cities where it can operate profitably and now operates in 200-250 of those localities, leaving it enough room for domestic expansion. In our view, low penetration in second- and third-tier municipalities and rising GDP are key catalysts for JFC’s domestic expansion.
Foreign businesses becoming a significant contributor to topline JFC’s foreign businesses contributed 21% of system-wide sales in 2017. In FY18F, it aims to open another 200-250 stores (gross additions) abroad, centred on the SuperFood Group’s expansion. In our view, JFC’s timely expansion overseas is strategic given: i) its foreign brands cater to the middle-income segment, which has higher purchasing power and, hence, these brands command higher price points, and ii) higher price points generally lead to wider margins (foreign GPM: 65-70% vs. PH GPM: 55-57%).
Domestic inflationary pressures to push raw materials higher Despite price increases across JFC’s domestic brands, its dependence on imported raw materials (20-25% of total COGS) may affect margins as the peso has depreciated 4% YTD. Moreover, inflationary pressures from the government’s tax reform programme may raise operating expenses, particularly wages and distribution/transportation expenses. Hence, we expect the EBIT margin to narrow 10bp to 5% in FY18F.
Forecast net profit CAGR of 13.5% in FY18-20F We forecast 13.5% FY18-20F net profit CAGR, underpinned by 17% revenue CAGR, driven by: i) JFC’s dominance in the Philippine market, and ii) its growing foreign business. We believe that Smashburger operations may dampen FY18F earnings, although we project Smashburger to break even by end-FY19F or early-FY20F. We project a 50bp dip in JFC’s net margin to 4.6% in FY18F before improving 4.8% by 2020F, due to inflationary pressures and the peso weakening.
Initiate with Hold and DCF-based target price of Php300 We initiate coverage on JFC with a Hold rating as we believe the stock is fully valued already. Our DCF-based target price of Php300 implies an FY18F P/E of 40x. We like JFC as it is the country’s largest QSR operator, with good growth potential overseas. Re-rating catalysts are stronger system-wide sales growth, robust contribution from its newly-opened stores and faster-than-expected turnaround in its Smashburger operations.
Downside risks are high inflation and stiff competition.
SOURCES: CGS-CIMB RESEARCH, COMPANY REPORTS
Philippines
HOLD (previously NOT RATED) Consensus ratings*: Buy 6 Hold 6 Sell 3
Current price: PHP285.0
Target price: PHP300.0
Previous target: PHP
Up/downside: 5.3%
CIMB / Consensus: 7.6%
Reuters: JFC.PS
Bloomberg: JFC PM
Market cap: US$5,911m
PHP309,687m
Average daily turnover: US$4.08m
PHP212.6m
Current shares o/s: 1,087m
Free float: 43.5% *Source: Bloomberg
Key changes in this note
Not applicable.
Source: Bloomberg
Price performance 1M 3M 12M
Absolute (%) -1.6 -2.4 33.8
Relative (%) 0.8 6.4 34.6
Major shareholders % held Honey Dynamic Corporation 25.1
Honeysea Corporation 11.8
Insert
Analyst(s)
Daphne Ashley SZE
T (63) 2 888 5827 E [email protected]
Financial Summary Dec-16A Dec-17A Dec-18F Dec-19F Dec-20F
Revenue (PHPm) 113,811 131,577 159,259 185,141 210,350
Operating EBITDA (PHPm) 10,461 11,415 13,395 15,554 17,882
Net Profit (PHPm) 6,165 7,109 7,766 9,097 10,418
Core EPS (PHP) 5.64 6.49 7.09 8.31 9.52
Core EPS Growth 24.6% 15.1% 9.2% 17.1% 14.5%
FD Core P/E (x) 50.51 43.88 40.18 34.29 29.95
DPS (PHP) 1.86 2.18 2.35 2.75 3.15
Dividend Yield 0.65% 0.76% 0.82% 0.97% 1.11%
EV/EBITDA (x) 28.38 26.27 22.45 19.33 16.83
P/FCFE (x) 48.16 50.25 45.65 53.76 57.11
Net Gearing (15.5%) (15.0%) (11.1%) (9.4%) (7.3%)
P/BV (x) 9.30 7.64 6.80 5.98 5.29
ROE 19.2% 19.1% 17.9% 18.6% 18.8%
% Change In Core EPS Estimates
CIMB/consensus EPS (x) 0.98 0.99 0.98
91.0
112.4
133.9
180
230
280
Price Close Relative to PCOMP (RHS)
2
4
6
May-17 Aug-17 Nov-17 Feb-18
Vol m

2
Food & Beverages│Philippines
Jollibee Foods Corp│May 15, 2018
The bee is king
Investment Highlights
JFC is the dominant fast food chain in the Philippines, and is far from saturation
The Jollibee brand has been a staple for every Filipino household, largely due to its flagship products, expansive reach of 1,062 branches nationwide and local brand market share of 31%, translating into a 45% system-wide sales contribution in 2017.
As of end-2017, the JFC’s (inclusive of six local brands) key city penetration is c.85%. However, the company notes that among the Philippines’ c.1,500 total municipalities, penetration is only c.10% (multiple stores in the same municipality are only counted once).
JFC identified c.350 cities in which it can operate profitably (e.g. municipalities with sufficient average household incomes). It now operates in 200-250 of those localities so there is still room for domestic expansion. JFC plans to open 250-300 stores (gross adds) in FY18F, mostly in the provincial areas. We think there is still room to grow locally due to: i) low penetration in second- and third-tier municipalities, ii) rising gross regional domestic product (GRDP), and iii) growing population density in the provinces nearest to Metro Manila.
We forecast JFC to grow its domestic store network at a CAGR of 8% over FY18-20F, driven by large rollouts for its Jollibee, Chowking and Mang Inasal brands. In our view, JFC’s local expansion plan seems to be on track given its portfolio’s strong brand equity and its scalable operations. Given its deep knowledge of the local market, we think JFC will remain a significant QSR operator despite local and foreign competitors. For FY18F, 70% of JFC’s store openings will be in the provincial areas, particularly South Luzon and Visayas.
Figure 1: Domestic store network (in branches) Figure 2: Domestic store network location (2017)
SOURCES: SB EQUITIES ESTIMATES, COMPANY REPORTS SOURCE: COMPANY REPORTS
Foreign business ramping up; all eyes on the US
After overcoming initial challenges in its China business, 2017 proved to be a turnaround year for JFC’s foreign business, driven by double-digit system-wide sales contribution from its China and Southeast Asia/Middle East (SAME) segments.
In FY18F, it aims to maintain its growth momentum by opening another 200-250 stores (gross additions) abroad, its highest gross opening target to date, centred on the SuperFood Group’s aggressive 90-140 target store openings this year.
In our view, JFC’s timely expansion overseas is strategic given: i) its foreign brands cater to the middle-income class, which has higher purchasing power and hence, these brands command higher price points, and ii) higher price
2,643 2,875
3,107 3,386
3,645
-
500
1,000
1,500
2,000
2,500
3,000
3,500
4,000
2016 2017 2018F 2019F 2020F
Metro Manila 37%
VisMin 25%
Luzon (exc. MM) 38%

3
Food & Beverages│Philippines
Jollibee Foods Corp│May 15, 2018
points generally lead to overall margin improvement (foreign GPM: 65-70% vs. PH GPM: 55-57%). This will help cushion it from inflationary pressures in the domestic business, in our view.
China. JFC’s China businesses, led by Yonghe King and Hong Zhuang Yuan, had a solid 2017, driven by new product rollouts and its delivery service. China’s burgeoning fast food delivery market’s sales surged 23% yoy to US$32bn (Rmb31.9bn) in 2017, according to major food delivery firm Meituan Waimai.
In 2017, the company said that 20%/30% of Yonghe King/ Hong Zhuang Yuan, system-wide sales came from delivery services. The China business is expected to open another 50-60 stores (gross additions) in FY18F, out of which about 35 will be Yonghe King stores.
Dunkin, the company’s latest China venture, has yet to break even given its exploratory phase (2017: 15 stores) as management is tweaking its business model while looking for the appropriate positioning of the brand in the market. With the stabilisation of its China business, we believe JFC will likely focus on organic growth, with no plans to acquire more local brands nor divest any of its existing brands.
United States. With the consolidation of Smashburger into JFC’s books starting Apr 2018, we think the spotlight is on the US given that it is still trying to carve out its niche there with a local brand. We expect Smashburger to break even by late-FY19F or early-FY20F given that the company has 20 more planned closures for the year (vs. 2017: 50). The company continues to suffer from: i) weak operations arising from poor locations, and ii) lack of standardised training among store personnel, both of which are now being addressed by JFC. While there are challenges ahead, we believe that a turnaround in JFC’s Smashburger investment in the medium term could push foreign sales even higher.
With these developments, we project the number of international stores to expand at a CAGR of 15% over FY17-20F. Furthermore, with its aggressive expansion for both its domestic and foreign businesses, we expect JFC to grow its system-wide sales by a FY17-20F CAGR of 17%, including Smashburger’s consolidation.
Figure 3: International store network (in branches) Figure 4: JFC’s system-wide sales (in Php m)
SOURCES: SB EQUITIES ESTIMATES, COMPANY REPORTS SOURCES: SB EQUITIES ESTIMATES, COMPANY REPORTS
Domestic inflationary pressures to push costs higher
JFC imports 20-25% of its raw materials: beef from Australia (12-15% of raw materials), frozen potatoes (5%) and pork (3-4%) from the US and dairy from New Zealand. With the recent steep depreciation of the peso, its margin may contract despite 1-2% price increases implemented by the company every now and then. While the cost of inventories-to-revenues ratio has come down from its peak in 2015 (2015: 48.8% vs. 2017: 47.7%), we expect this to remain elevated in the short term with the current peso trend.
On top of this, the tax reform programme led to the price of sweetened beverages rising by Php10/litre and gasoline prices rising by Php2-3/litre in 2018,
611
922
1,110
1,265
1,420
-
200
400
600
800
1,000
1,200
1,400
1,600
2016 2017 2018F 2019F 2020F
0%
5%
10%
15%
20%
25%
-
50,000
100,000
150,000
200,000
250,000
300,000
2016 2017 2018F 2019F 2020F
System wide sales (in Php m) Growth

4
Food & Beverages│Philippines
Jollibee Foods Corp│May 15, 2018
which could dampen EBIT margins. As JFC’s domestic consumers are price elastic, it could affect demand for its products, in our view.
Figure 5: Cost of sales breakdown (2017)
SOURCE: COMPANY REPORTS
Outlook
Data from Euromonitor show that, in 2016, fast food’s retail value rose 12% yoy to Php193.5bn, underpinned by 8,577 stores (+11% yoy) and 1.2bn transactions (+9% yoy). The report highlighted that the Jollibee brand has a sales value share of 31%. The same report estimated that the fast food industry in the country is set to post 7% FY16-21F CAGR in sales to Php276.9bn in FY21F while store growth is poised to deliver a CAGR of 6% over the same period to 11,613 stores.
Figure 6: Fast food sales growth (in Php m) Figure 7: Number of fast food outlets
SOURCE: EUROMONITOR SOURCE: EUROMONITOR
The Philippines’ consumer spending story continues…
73% of the country’s GDP comes from consumer spending (2017). Filipinos typically spend 4% of their annual household expenditure in restaurants and 42% on food and non-alcoholic beverages (according to PSA). We believe that JFC stands to benefit from this consumption pattern.
As evidenced by the household consumption final expenditure (HCFE) table below, a broad representation of consumer spending in the country, we can see that the HCFE is directly related to JFC’s sales figures. Given the existing trend, we think that as HCFE continues to grow at least 5% annually, rationally, we expect JFC’s sales to follow.
Cost of inventories, 58%
Salaries, wages, 10%
Others, 8%
Rent, 9%
Contracted services, 7%
Electricity and other utilities, 4%
Depreciation and amortisation, 4%
-
50,000
100,000
150,000
200,000
250,000
300,000
2016 2017 2018F 2019F 2020F 2021F
0
2,000
4,000
6,000
8,000
10,000
12,000
14,000
2016 2017 2018F 2019F 2020F 2021F

5
Food & Beverages│Philippines
Jollibee Foods Corp│May 15, 2018
Figure 8: Household final expenditure (2017) Figure 9: HCFE against JFC sales (Php m)
SOURCES:PHILIPPINE STATISTICS AUTHORITY SOURCES: PSA, JFC COMPANY REPORTS
Another potential key driver of the country’s economic growth is its favourable population demographics. We think the Philippines is in a demographic sweet spot as its population of 102.5m (in 2016) is fairly young. The Philippines Statistics Authority (PSA) estimates that Filipinos aged 24 years and below will comprise roughly 50% of the population in 2015-20F. Given the high English proficiency rate, we believe that the Philippines is well positioned to reap demographic dividends in the form of a higher per capita income and spending power.
Figure 10: PH population distribution (2016) Figure 11: PH GDP per capita
SOURCES:PHILIPPINE STATISTICS AUTHORITY, INDEX MUDI SOURCES: PSA. WORLD BANK
Overseas businesses set to take a larger bite of the pie
The China business is currently the largest foreign business of JFC, contributing c.10% of its overall system-wide sales (as at end-FY17). While it initially experienced challenges in the domestic arena, the turnaround in 2017 proved to be a game changer for JFC. Looking ahead, growth in the Chinese fast food industry is set to slow from 4% 2017 CAGR to 2% FY17-22F CAGR amid a shift to healthier alternatives and a variety of choices in consumer food service (according to a report by WaiMai). Against this backdrop, we think Yonghe King’s aggressive brand building strategy and product innovation should be able to propel topline growth.
Furthermore, with the additional stake of Smashburger, JFC projects international business contribution to go up to 30% in FY18F (FY17: 21%). In the US where 50m Americans (c.17% of US consumers) eat at fast food chains
Food and Non-alcoholic beverages,
42%
Housing, water,
electricity, gas and
other fuels, 12%
Furnishings, household
equipment , 4%
Transport, 11%
Communication, 3%
Miscellaneous goods and
services, 28%
-
20,000
40,000
60,000
80,000
100,000
120,000
-
2,000,000
4,000,000
6,000,000
8,000,000
10,000,000
12,000,000
14,000,000
HCFE (LHS) JFC domestic sales (RHS)
0.0%
1.0%
2.0%
3.0%
4.0%
5.0%
6.0%
7.0%
8.0%
9.0%
10.0%
2,300
2,400
2,500
2,600
2,700
2,800
2,900
3,000
3,100
2012 2013 2014 2015 2016 2017
GDP per capita (LHS) GDP Growth (RHS)
GDP per capita growth (RHS)

6
Food & Beverages│Philippines
Jollibee Foods Corp│May 15, 2018
daily and consumer spending in quick service restaurants (QSR) reached US$290.2bn (+3% yoy) in 2017 (source: Statista), we believe that the US market is another key market to look into for JFC.
SWOT Analysis
Figure 12: SWOT analysis
SOURCE: SB EQUITIES
We believe JFC’s strength lies in its strong brand recognition and deep local knowledge. Having more than 2,000 outlets nationwide has enabled the group to garner c.55% local brand share in 2017 (Euromonitor). We believe JFC’s good track record and experienced management team allows the company to venture into new businesses/markets using tried and tested methodologies. Moreover, its ability to serve quality menus at budget price points through a scalable business model allows it to have cost advantages over its competitors. On the balance sheet side, its efficient working capital turnover minimises the risk of needing additional debt to fund daily operations.
In our view, JFC’s weakness is its dependence on imported raw materials. Hence, fluctuations in foreign exchange could adversely affect the company’s margins. On top of this, JFC’s market could be limited to Filipinos as menu items are native to the Filipino taste palette (e.g. too sweet or oily for other cultures).
Meanwhile, growth opportunities include expansion into new markets, pursuing attractive brand acquisitions and its growing network of franchisees. As of end-2017, JFC enjoyed a 58:42 split in favour of company-owned stores. However, reducing company-owned stores to a 50:50 split whilst growing its store network could help reduce operating expenses and administrative issues (e.g. manpower management), boosting bottomline growth, in our view.
Threats include intense competition among QSR operators, such as McDonald’s (subsidiary of Alliance Global Investments, AGI PM, Not Rated) and KFC (Unlisted), as well as unfavourable changes in consumer behaviour. More importantly, changes in economic patterns could have an adverse impact on consumption expenditure patterns, which, in turn, could negatively affect sales directly.
Financials
Net profit to deliver 14% FY18-20F CAGR
In our view, JFC’s net profit could record a 3-year CAGR of 14% (FY18-20F), underpinned by i) JFC’s dominance in the Philippine market, ii) its growing China business, iii) worldwide store expansion, iv) acceleration in the US business, led by Smashburger’s turnaround, and v) earnings-accretive acquisitions and JVs. We remain positive on JFC’s growth outlook and forecast JFC’s net profit attributable to parent to increase from Php7.1bn in FY17 to Php10.4bn in FY20F.
Moreover, we expect JFC’s net sales to rise by 17% p.a. in FY18-20F, driven by the company’s aggressive store rollout plan, stable SSSG and increasing average ticket size due to rising disposable income. Aside from store network expansion, we also see JFC benefiting from the higher disposable income of Filipinos arising from the government’s tax reform package.
Strengths Weaknesses
Largest QSR operator in the Philippines
JFC’s market could be limited to Filipinos due
to menu items
Strong brand recognition Dependence on imported raw materials
Good track record and experienced management team
Scalable operation
Strong balance sheet
Opportunities Threats
Acquisition of new brands Intense competition among foreign QSR chains
Penetration in new markets Rising raw material costs
Growing network of franchisees Change in consumer behaviour
Depreciating peso

7
Food & Beverages│Philippines
Jollibee Foods Corp│May 15, 2018
Figure 13: P&L summary and forecasts
SOURCES: SB EQUITIES ESTIMATES, COMPANY REPORTS
Margins likely to be pressured; recovery in the medium term
We expect a 50bp dip in net profit margin on the back of inflationary pressures and the recent depreciation of the peso as 20-25% of its raw materials are imported. However, we expect this to gradually improve in FY18-19F, driven by stable revenue and EBITDA growth, on top of cost rationalisation measures.
Stable gross profit margins. We keep our gross profit margins stable at 18.2% for FY18F despite rising COGS, underpinned by JFC’s implementation of gradual price increases across its domestic brands. The company mentioned that it raised prices by 1% in the past year, but, due to the inflationary pressures brought about by the Tax Reform for Acceleration and Inclusion (TRAIN) programme, it has already raised prices by 2% once in 1Q18. We believe the company could implement more price hikes in the succeeding quarters to offset rising raw materials COGS. In addition, higher revenue contribution from its higher-margin foreign business could partly offset weakness in the domestic cost structure, in our view.
EBIT margin contraction. As a result of rising opex attributable to the stable increase in manpower costs driven by Smashburger’s consolidation into JFC’s books, we estimate the EBIT margin to decline by 10bp before stabilising over the medium term.
As of FY17, the manpower cost-to-net sales ratio (under G&A) stood at 5.5% (+40bp yoy), attributable to domestic minimum wage increases across the board in 2H17. Moving forward, we forecast another round of domestic minimum wage increases in FY18F to counteract rising commodity prices in the local arena.
Figure 14: JFC’s profit margins
SOURCES: SB EQUITIES RESEARCH, COMPANY REPORTS
Healthy balance sheet with net cash position; negative cash conversion cycle
We expect JFC to remain in a net cash position of Php3.8bn at end-FY18F as the company has minimal debt (2017 D/E: 0.38x) and a robust negative cash conversion cycle. During FY17, the company had net cash of Php4.99bn, consisting of interest-bearing debt of Php16bn and Php21bn in cash. We like JFC’s efficient use of working capital as we believe there is enough capacity for capital expenditure allocation without the need to borrow. We estimate capex of Php12bn-15.8bn p.a. for FY18-20F as we see the company ramping up its domestic and foreign businesses in the next three years.
in Php m 2016 2017 2018F 2019F 2020F
Net sales (ex. Royalty fees) 107,924 124,664 150,711 175,216 199,030
Revenue 113,811 131,577 159,259 185,141 210,350
EBIT 6,465 6,670 7,895 9,483 11,154
Net income 6,054 6,673 7,396 8,747 10,115
Net income attributable to parent 6,165 7,109 7,766 9,097 10,418
Net sales (ex. Royalty fees) growth 16% 21% 16% 14%
Revenue growth 15.6% 21.0% 16.3% 13.6%
EBIT growth 3.2% 18.4% 20.1% 17.6%
Net income growth 10.2% 10.8% 18.3% 15.6%
Net income attributable to parent growth 15.3% 9.2% 17.1% 14.5%
2016 2017 2018F 2019F 2020F
Gross profit margins 18.4% 18.2% 18.2% 18.3% 18.4%
EBIT margins 5.7% 5.1% 5.0% 5.1% 5.3%
Net income margins 5.3% 5.1% 4.6% 4.7% 4.8%

8
Food & Beverages│Philippines
Jollibee Foods Corp│May 15, 2018
Figure 15: Net cash position
SOURCES: SB EQUITIES RESEARCH, COMPANY REPORTS
Risks
Rising cost of sales
JFC’s risk of margin compression is high, in our view, given the continuous devaluation of the Philippine peso, along with inflationary effects from the government’s recent tax reform programme. As 20-25% of JFC’s raw materials are imported, its exposure to externally-driven factors could adversely affect margins in the short term despite the company’s gradual price increases.
Competition amongst QSR players
JFC operates in a highly competitive industry, which consists of foreign players. Among its main competitors both in the Philippines and abroad are:
McDonald’s entered the Philippines in 1981 and became a Filipino-owned company in 2005 under the AGI Group. It currently operates more than 500 stores in the country, with a sales value brand share of 18.4% in 2017, according to Euromonitor.
KFC first started operating in the Philippines in 1967. Euromonitor estimates that it had a sales value brand share of 4.4% in 2017.
Execution risks
With the company’s aggressive expansion targets, execution risks in the form of slow ramp-up of new stores and Smashburger’s performance could dampen the outlook of the company.
Changes in economic activity
As economic growth in the Philippines is heavily driven by consumption, any changes in economic activity (e.g. interest rate hikes, inflation bubble, recession) could adversely affect consumers’ consumption patterns, which, in turn, could negatively affect the profitability targets of the company.
Valuation and recommendation
Initiate coverage with a Hold rating
We initiate coverage on Jollibee Foods Corporation with a Hold rating (given limited upside from current share price) and a target price of Php300, derived from the discounted cash flow (DCF) method with a WACC of 7.67%. Potential re-rating catalysts are stronger system-wide sales growth, robust contribution from its newly-opened stores and a faster-than-expected turnaround from its Smashburger operations. Downside risks are a highly inflationary environment and stiff competition among QSR players both here and abroad.
in Php m 2016 2017 2018F 2019F 2020F
Total interest-bearing debt 12,155 16,117 21,108 23,603 25,599
Cash 16,733 21,107 24,942 27,169 28,560
Net cash (debt) 4,578 4,990 3,834 3,566 2,961
Cash conversion cycle -33.9 -37.1 -35.3 -34.3 -34.5

9
Food & Beverages│Philippines
Jollibee Foods Corp│May 15, 2018
Figure 16: DCF Valuation
SOURCE: SB EQUITIES ESTIMATES
Figure 17: Key assumptions
SOURCES: SB EQUITIES ESTIMATES
DCF-based TP of Php300 implies FY18F P/E of 40x
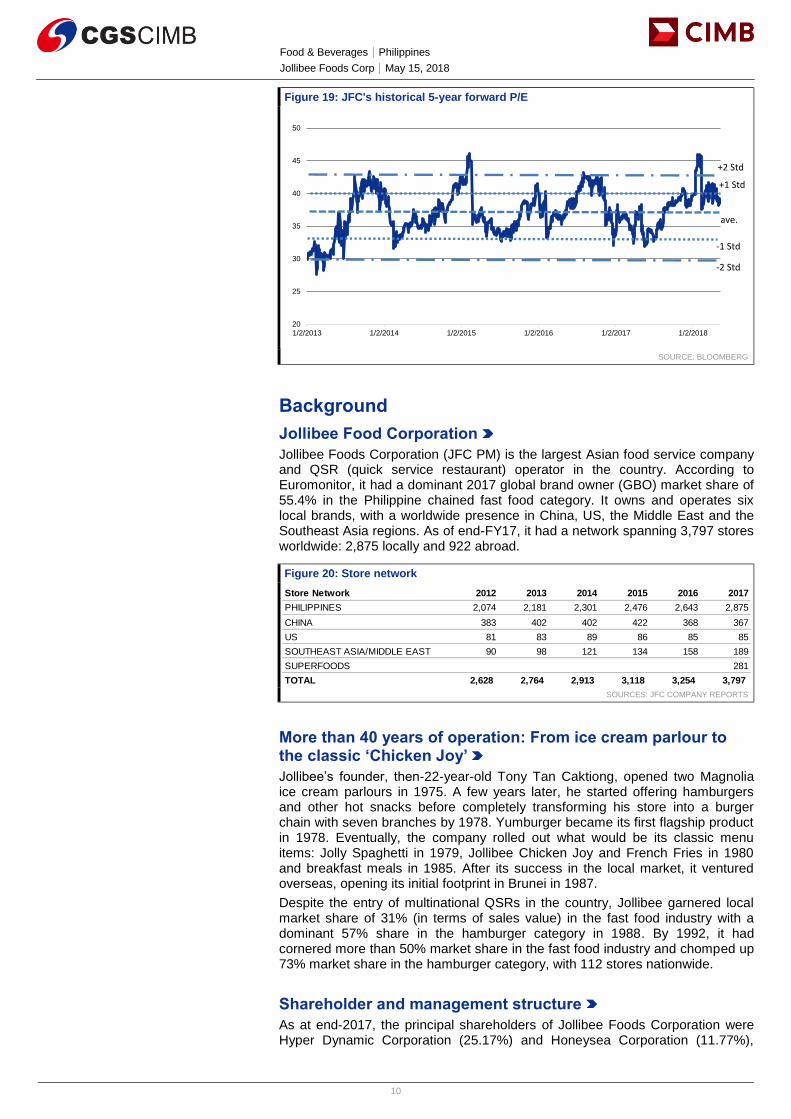
Our target price of Php300 translates into 40x FY18F P/E, which is slightly above with its historical 5-year F P/E average of 37x, at a premium over the ASEAN peers’ average of 28.7x. The stock currently trades at 40x FY18F P/E. We think that JFC’s FY18F P/E premium over its local peers is pricey but it can be justified by: 1) our forecasts of 14% core EPS CAGR for FY17-20F, 2) the fact that it is the largest QSR operator in the country, 3) its growing foreign business, which could lift margins in the medium term, and 4) its aggressive expansion plan.
Figure 18: Company Comparable
SOURCES: CIMB, COMPANY REPORTS, BLOOMBERG
FCF computation (in Php m) 2017 2018F 2019F 2020F 2021-28F
EBIT 6,670 7,895 9,483 11,154 176,551
Tax 1,667 2,048 2,423 2,801 41,728
Net operating profit after tax (Nopat) 5,003 5,846 7,060 8,352 134,823
Depreciation & amortization 4,745 5,500 6,072 6,729 84,645
Net working capital (10,661) (11,414) (13,587) (15,682) (226,032)
Change in net working capital 698 518 1,725 1,870 22,568
Capital expenditures 8,905 12,000 13,800 15,870 147,242
Unlevered free cash flow 145 (1,172) (2,393) (2,659) 49,658
Discounted FCF (1,172) (2,188) (2,223) 21,976
Terminal value Php mn 321,701
Total discounted free cash flow 16,392
Present value of terminal free cash flow 294,167
Total present value of forecasted free cash flows 310,559
+ net cash 4,990
-Minority Shares 1,799
Total Company Equity Value Php mn 313,750
Outstanding common shares 1,087
Implied current price per share Php 289
12-month target price Php 296
Rounded 12- month target price Php 300
Cost of debt 5.0%
Debt weighting 20.0%
Risk-free rate 5.5%
Equity risk premium 5.5%
Beta 0.900
Cost of equity 10.5%
Equity weighting 80.0%
WACC 9.36%
Terminal Growth rate 3.5%
Company Bloomberg Recom Price Target Price Market Cap
Ticker (local curr) (local curr) (US$ m) 2018F 2019F 2018F 2019F 2018F 2019F
Minor International MINT TB ADD 37.75 44.50 5,476 29.0 25.5 22.1 20.3 1.1 1.3
MK Restaurant M TB HOLD 79.00 84.00 2,285 27.2 24.4 16.2 15.0 3.3 3.7
Berjaya Food Berhad BJFO MK HOLD 1.65 1.75 157 29.9 23.9 15.5 9.8 2.3 2.9
Jollibee Foods Corporation JFC PM HOLD 285.00 300.00 5,911 40.2 34.3 23.1 19.9 0.8 1.0
ASEAN average 28.7 24.6 18.0 15.0 2.3 2.6
P/E (x) EV/EBITDA (x) Div Yield (%)
10
Food & Beverages│Philippines
Jollibee Foods Corp│May 15, 2018
Figure 19: JFC's historical 5-year forward P/E
SOURCE: BLOOMBERG
Background
Jollibee Food Corporation
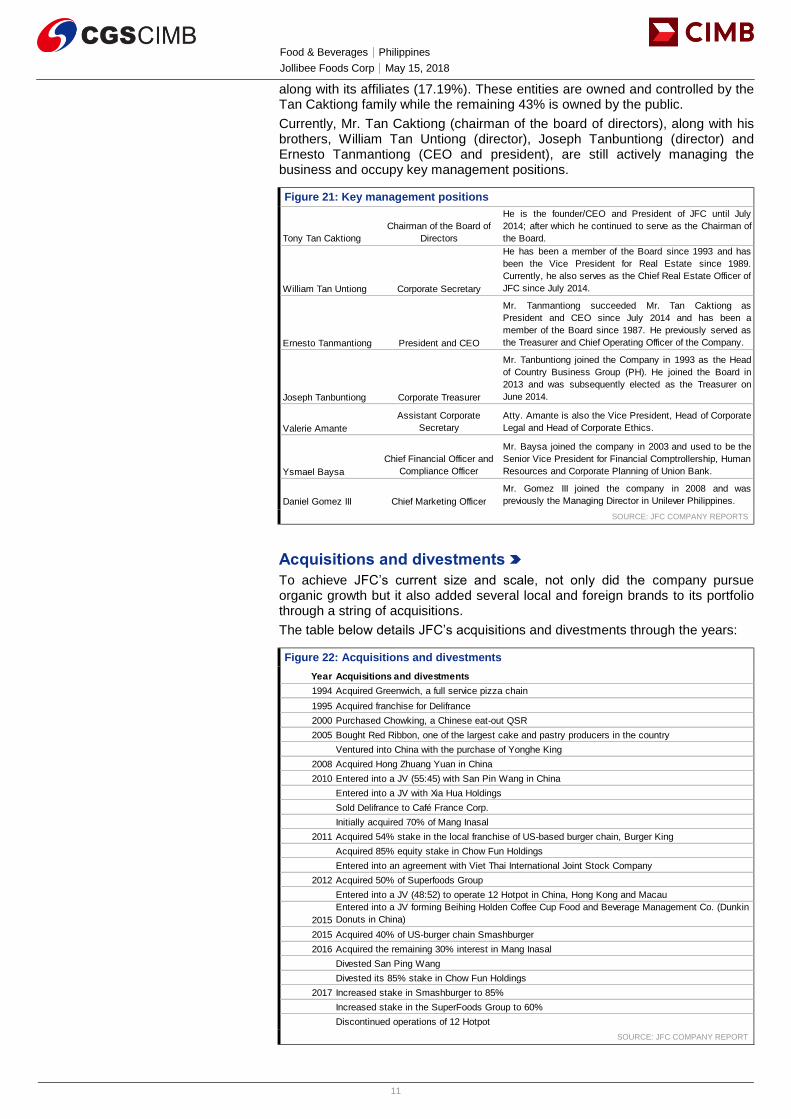
Jollibee Foods Corporation (JFC PM) is the largest Asian food service company and QSR (quick service restaurant) operator in the country. According to Euromonitor, it had a dominant 2017 global brand owner (GBO) market share of 55.4% in the Philippine chained fast food category. It owns and operates six local brands, with a worldwide presence in China, US, the Middle East and the Southeast Asia regions. As of end-FY17, it had a network spanning 3,797 stores worldwide: 2,875 locally and 922 abroad.
Figure 20: Store network
SOURCES: JFC COMPANY REPORTS
More than 40 years of operation: From ice cream parlour to the classic ‘Chicken Joy’
Jollibee’s founder, then-22-year-old Tony Tan Caktiong, opened two Magnolia ice cream parlours in 1975. A few years later, he started offering hamburgers and other hot snacks before completely transforming his store into a burger chain with seven branches by 1978. Yumburger became its first flagship product in 1978. Eventually, the company rolled out what would be its classic menu items: Jolly Spaghetti in 1979, Jollibee Chicken Joy and French Fries in 1980 and breakfast meals in 1985. After its success in the local market, it ventured overseas, opening its initial footprint in Brunei in 1987.
Despite the entry of multinational QSRs in the country, Jollibee garnered local market share of 31% (in terms of sales value) in the fast food industry with a dominant 57% share in the hamburger category in 1988. By 1992, it had cornered more than 50% market share in the fast food industry and chomped up 73% market share in the hamburger category, with 112 stores nationwide.
Shareholder and management structure
As at end-2017, the principal shareholders of Jollibee Foods Corporation were Hyper Dynamic Corporation (25.17%) and Honeysea Corporation (11.77%),
20
25
30
35
40
45
50
1/2/2013 1/2/2014 1/2/2015 1/2/2016 1/2/2017 1/2/2018
ave.
+1 Std
-1 Std
-2 Std
+2 Std
Store Network 2012 2013 2014 2015 2016 2017
PHILIPPINES 2,074 2,181 2,301 2,476 2,643 2,875
CHINA 383 402 402 422 368 367
US 81 83 89 86 85 85
SOUTHEAST ASIA/MIDDLE EAST 90 98 121 134 158 189
SUPERFOODS 281
TOTAL 2,628 2,764 2,913 3,118 3,254 3,797
11
Food & Beverages│Philippines
Jollibee Foods Corp│May 15, 2018
along with its affiliates (17.19%). These entities are owned and controlled by the Tan Caktiong family while the remaining 43% is owned by the public.
Currently, Mr. Tan Caktiong (chairman of the board of directors), along with his brothers, William Tan Untiong (director), Joseph Tanbuntiong (director) and Ernesto Tanmantiong (CEO and president), are still actively managing the business and occupy key management positions.
Figure 21: Key management positions
SOURCE: JFC COMPANY REPORTS
Acquisitions and divestments
To achieve JFC’s current size and scale, not only did the company pursue organic growth but it also added several local and foreign brands to its portfolio through a string of acquisitions.
The table below details JFC’s acquisitions and divestments through the years:
Figure 22: Acquisitions and divestments
SOURCE: JFC COMPANY REPORT
Tony Tan Caktiong
Chairman of the Board of
Directors
He is the founder/CEO and President of JFC until July
2014; after which he continued to serve as the Chairman of
the Board.
William Tan Untiong Corporate Secretary
He has been a member of the Board since 1993 and has
been the Vice President for Real Estate since 1989.
Currently, he also serves as the Chief Real Estate Officer of
JFC since July 2014.
Ernesto Tanmantiong President and CEO
Mr. Tanmantiong succeeded Mr. Tan Caktiong as
President and CEO since July 2014 and has been a
member of the Board since 1987. He previously served as
the Treasurer and Chief Operating Officer of the Company.
Joseph Tanbuntiong Corporate Treasurer
Mr. Tanbuntiong joined the Company in 1993 as the Head
of Country Business Group (PH). He joined the Board in
2013 and was subsequently elected as the Treasurer on
June 2014.
Valerie Amante
Assistant Corporate
Secretary
Atty. Amante is also the Vice President, Head of Corporate
Legal and Head of Corporate Ethics.
Ysmael Baysa
Chief Financial Officer and
Compliance Officer
Mr. Baysa joined the company in 2003 and used to be the
Senior Vice President for Financial Comptrollership, Human
Resources and Corporate Planning of Union Bank.
Daniel Gomez III Chief Marketing Officer
Mr. Gomez III joined the company in 2008 and was
previously the Managing Director in Unilever Philippines.
Year Acquisitions and divestments
1994 Acquired Greenwich, a full service pizza chain
1995 Acquired franchise for Delifrance
2000 Purchased Chowking, a Chinese eat-out QSR
2005 Bought Red Ribbon, one of the largest cake and pastry producers in the country
Ventured into China with the purchase of Yonghe King
2008 Acquired Hong Zhuang Yuan in China
2010 Entered into a JV (55:45) with San Pin Wang in China
Entered into a JV with Xia Hua Holdings
Sold Delifrance to Café France Corp.
Initially acquired 70% of Mang Inasal
2011 Acquired 54% stake in the local franchise of US-based burger chain, Burger King
Acquired 85% equity stake in Chow Fun Holdings
Entered into an agreement with Viet Thai International Joint Stock Company
2012 Acquired 50% of Superfoods Group
Entered into a JV (48:52) to operate 12 Hotpot in China, Hong Kong and Macau
2015
Entered into a JV forming Beihing Holden Coffee Cup Food and Beverage Management Co. (Dunkin
Donuts in China)
2015 Acquired 40% of US-burger chain Smashburger
2016 Acquired the remaining 30% interest in Mang Inasal
Divested San Ping Wang
Divested its 85% stake in Chow Fun Holdings
2017 Increased stake in Smashburger to 85%
Increased stake in the SuperFoods Group to 60%
Discontinued operations of 12 Hotpot

12
Food & Beverages│Philippines
Jollibee Foods Corp│May 15, 2018
Local brand positioning
Greenwich. Purchased in 1994, Greenwich is a full service pizza chain, following a ‘pizzeria’ store concept, with a market share of 22.4% in 2016, making it the second-largest restaurant in the pizza chain category, according to Euromonitor. As of end-FY17, Greenwich had a store network of 272 nationwide.
Chowking. Acquired in 2000, Chowking positions itself as a Chinese eat-out QSR, leveraging its flagship products: Chao Fan, Lauriat and Wonton Mami. It had 571 stores worldwide (domestic: 526; abroad: 45) as of end-FY17.
Red Ribbon. Acquired in 2005, Red Ribbon is one of the largest cake and pastry producers in the country, with top-selling products such as Butter Mamon and Chicken Empanada. It ended FY17 with 427 stores locally and 31 stores in the US.
Mang Inasal. Known for its classic Chicken Inasal, Pork Sisig and Pinoy Halo-Halo, JFC initially acquired 70% of Mang Inasal back in 2010 before fully acquiring the remaining 30% in 2016. As of end-FY17, it had 495 stores nationwide, the majority of which are franchised stores.
Burger King. JFC bought a 54% stake in the local franchise of US-based burger chain Burger King in 2011, which had 23 stores back then. As of end-FY17, Burger King, recognised for its classic Whopper, 4-Cheese Whopper and Flame-Grilled Cheeseburger offerings, operated 93 stores nationwide.
Figure 23: JFC’s system-wide sales breakdown (2017) Figure 24: JFC’s domestic store network (2017, in branches)
SOURCES:JFC COMPANY REPORTS SOURCES: JFC COMPANY REPORTS
Foreign brand positioning
Yonghe King. Its first foreign venture in 2005, Yonghe King serves soya milk, crispy tender chicken thighs and its best-selling premium tomato beef noodle soup (c.32% of FY17 sales). It ended FY17 with 309 stores, 82% of which were owned by the company.
Hong Zhuang Yuan. The company is JFC’s second China venture, acquired in 2008 and specialising in Beijing cuisine. It had a store network of 43 as of end-FY17.
SuperFoods. In 2012, JFC entered into a 50:50 joint venture with the SuperFoods Group, including its portfolio of brands: Highlands Coffee, Pho 24 and HardRock Café. In 2017, JFC increased its stake to 60% and SuperFoods was financially consolidated into JFC’s books in May 2017. As of end-2017, the SuperFoods Group had a total of 281 stores in the Asia Pacific region.
Dunkin Donuts – China. In 2016, Dunkin Donuts opened its first store in the Shunyi district and positioned itself as an American coffee and bakery shop. It had 15 stores as of end-FY17.
Smashburger. JFC initially acquired a 40% stake in the Colorado-based burger joint, Smashburger, for US$99m in 2015. Recently, it announced that it will acquire an additional 45% stake in the US hamburger chain, bringing its total
Jollibee 1062
Greenwich 272
Red Ribbon 427
Chowking 526
Mang Inasal 495
Burger King 93
Jollibee 1062
Greenwich 272
Red Ribbon 427
Chowking 526
Mang Inasal 495
Burger King 93
13
Food & Beverages│Philippines
Jollibee Foods Corp│May 15, 2018
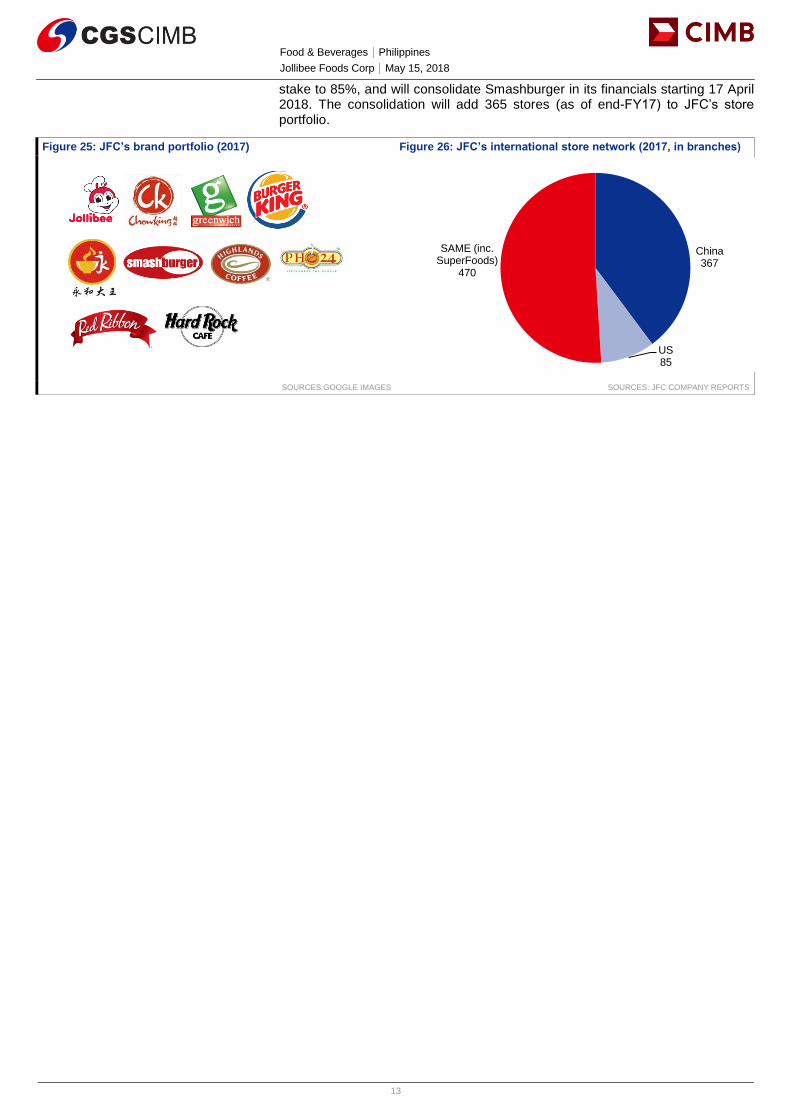
stake to 85%, and will consolidate Smashburger in its financials starting 17 April 2018. The consolidation will add 365 stores (as of end-FY17) to JFC’s store portfolio.
Figure 25: JFC’s brand portfolio (2017) Figure 26: JFC’s international store network (2017, in branches)
SOURCES:GOOGLE IMAGES SOURCES: JFC COMPANY REPORTS
China 367
US 85
SAME (inc. SuperFoods)
470

14
Food & Beverages│Philippines
Jollibee Foods Corp│May 15, 2018
BY THE NUMBERS
SOURCES: CGS-CIMB RESEARCH, COMPANY REPORTS
17.00%
17.36%
17.71%
18.07%
18.43%
18.79%
19.14%
19.50%
5.70
6.20
6.70
7.20
7.70
8.20
8.70
9.20
Jan-14A Jan-15A Jan-16A Jan-17A Jan-18F Jan-19F
P/BV vs ROE
Rolling P/BV (x) (lhs) ROE (rhs)
7.0%
9.5%
12.0%
14.5%
17.0%
19.5%
22.0%
24.5%
27.0%
28.0
30.0
32.0
34.0
36.0
38.0
40.0
42.0
44.0
Jan-14A Jan-15A Jan-16A Jan-17A Jan-18F Jan-19F
12-mth Fwd FD Core P/E vs FD Core EPS Growth
12-mth Fwd Rolling FD Core P/E (x) (lhs)
FD Core EPS Growth (rhs)
Profit & Loss
(PHPm) Dec-16A Dec-17A Dec-18F Dec-19F Dec-20F
Total Net Revenues 113,811 131,577 159,259 185,141 210,350
Gross Profit 20,996 23,918 28,931 33,833 38,804
Operating EBITDA 10,461 11,415 13,395 15,554 17,882
Depreciation And Amortisation (3,996) (4,745) (5,500) (6,072) (6,729)
Operating EBIT 6,465 6,670 7,895 9,483 11,154
Financial Income/(Expense) 19 (146) (162) (185) (253)
Pretax Income/(Loss) from Assoc. (337) (283) 72 98 178
Non-Operating Income/(Expense) 1,583 2,099 1,639 1,774 1,837
Profit Before Tax (pre-EI) 7,730 8,340 9,444 11,170 12,916
Exceptional Items
Pre-tax Profit 7,730 8,340 9,444 11,170 12,916
Taxation (1,677) (1,667) (2,048) (2,423) (2,801)
Exceptional Income - post-tax
Profit After Tax 6,054 6,673 7,396 8,747 10,115
Minority Interests 111 437 370 350 303
Preferred Dividends
FX Gain/(Loss) - post tax
Other Adjustments - post-tax
Net Profit 6,165 7,109 7,766 9,097 10,418
Recurring Net Profit 6,165 7,109 7,766 9,097 10,418
Fully Diluted Recurring Net Profit 6,165 7,109 7,766 9,097 10,418
Cash Flow
(PHPm) Dec-16A Dec-17A Dec-18F Dec-19F Dec-20F
EBITDA 10,461 11,415 13,395 15,554 17,882
Cash Flow from Invt. & Assoc. 337 283 0 0 0
Change In Working Capital 3,899 698 518 1,725 1,870
(Incr)/Decr in Total Provisions 782 949 162 185 253
Other Non-Cash (Income)/Expense
Other Operating Cashflow 1,533 2,076 1,979 2,252 2,386
Net Interest (Paid)/Received 10 (181) (162) (185) (253)
Tax Paid
Cashflow From Operations 17,022 15,240 15,892 19,531 22,138
Capex (8,956) (11,301) (14,048) (16,223) (18,671)
Disposals Of FAs/subsidiaries 96 0 0 0 0
Acq. Of Subsidiaries/investments
Other Investing Cashflow (3,479) (1,640) 0 0 0
Cash Flow From Investing (12,338) (12,941) (14,048) (16,223) (18,671)
Debt Raised/(repaid) 1,782 3,910 4,990 2,495 1,996
Proceeds From Issue Of Shares 369 861 0 0 0
Shares Repurchased
Dividends Paid (1,988) (2,347) (2,570) (3,011) (3,448)
Preferred Dividends
Other Financing Cashflow 388 (346) (469) (563) (619)
Cash Flow From Financing 551 2,077 1,951 (1,079) (2,072)
Total Cash Generated 5,234 4,377 3,795 2,229 1,395
Free Cashflow To Equity 6,465 6,209 6,834 5,803 5,463
Free Cashflow To Firm 4,951 2,705 2,312 3,871 4,086

15
Food & Beverages│Philippines
Jollibee Foods Corp│May 15, 2018
BY THE NUMBERS… cont’d
SOURCES: CGS-CIMB RESEARCH, COMPANY REPORTS
Balance Sheet
(PHPm) Dec-16A Dec-17A Dec-18F Dec-19F Dec-20F
Total Cash And Equivalents 17,459 22,521 26,355 28,582 29,973
Total Debtors 3,377 3,941 4,955 5,761 6,543
Inventories 5,987 6,836 7,748 9,003 10,203
Total Other Current Assets 3,545 3,844 4,344 4,844 5,344
Total Current Assets 30,369 37,141 43,402 48,190 52,064
Fixed Assets 16,656 20,894 27,394 35,122 44,263
Total Investments 10,883 8,372 8,372 8,372 8,372
Intangible Assets 9,087 15,730 15,730 15,730 15,730
Total Other Non-Current Assets 5,734 7,647 7,647 7,647 7,647
Total Non-current Assets 42,360 52,643 59,143 66,871 76,013
Short-term Debt 0 0 0 0 0
Current Portion of Long-Term Debt 1,562 1,216 1,451 1,900 2,124
Total Creditors 21,961 25,255 28,199 32,485 36,838
Other Current Liabilities 309 224 224 224 224
Total Current Liabilities 23,831 26,695 29,874 34,608 39,186
Total Long-term Debt 10,594 14,901 19,657 21,703 23,474
Hybrid Debt - Debt Component
Total Other Non-Current Liabilities 0 0 0 0 0
Total Non-current Liabilities 10,594 14,901 19,657 21,703 23,474
Total Provisions 4,022 5,606 5,606 5,606 5,606
Total Liabilities 38,447 47,202 55,137 61,917 68,266
Shareholders' Equity 33,602 40,783 45,978 52,064 59,034
Minority Interests 679 1,799 1,430 1,080 776
Total Equity 34,281 42,582 47,407 53,143 59,810
Key Ratios
Dec-16A Dec-17A Dec-18F Dec-19F Dec-20F
Revenue Growth 12.9% 15.6% 21.0% 16.3% 13.6%
Operating EBITDA Growth 19.1% 9.1% 17.3% 16.1% 15.0%
Operating EBITDA Margin 9.19% 8.68% 8.41% 8.40% 8.50%
Net Cash Per Share (PHP) 4.84 5.86 4.79 4.56 3.99
BVPS (PHP) 30.64 37.32 41.93 47.64 53.83
Gross Interest Cover 24.16 16.44 16.85 16.85 18.01
Effective Tax Rate 21.7% 20.0% 21.7% 21.7% 21.7%
Net Dividend Payout Ratio 32.2% 33.0% 33.1% 33.1% 33.1%
Accounts Receivables Days 14.16 10.15 10.19 10.56 10.70
Inventory Days 22.61 21.74 20.42 20.20 20.49
Accounts Payables Days 81.80 80.04 74.85 73.19 73.95
ROIC (%) 19.7% 21.1% 16.5% 16.8% 17.2%
ROCE (%) 14.7% 12.5% 12.2% 13.0% 13.6%
Return On Average Assets 8.79% 8.34% 7.81% 8.16% 8.47%
Key Drivers
Dec-16A Dec-17A Dec-18F Dec-19F Dec-20F
ASP (% chg, main prod./serv.) N/A N/A N/A N/A N/A
Unit sales grth (%, main prod./serv.) 14.1% 15.2% 22.2% 16.4% 13.8%
Util. rate (%, main prod./serv.) N/A N/A N/A N/A N/A
ASP (% chg, 2ndary prod./serv.) N/A N/A N/A N/A N/A
Unit sales grth (%,2ndary prod/serv) 12.6% 15.5% 20.9% 16.3% 13.6%
Util. rate (%, 2ndary prod/serv) N/A N/A N/A N/A N/A
ASP (% chg, tertiary prod/serv) N/A N/A N/A N/A N/A
Unit sales grth (%,tertiary prod/serv) N/A N/A N/A N/A N/A
Util. rate (%, tertiary prod/serv) N/A N/A N/A N/A N/A
Unit raw mat ASP (%chg,main) N/A N/A N/A N/A N/A
Total Export Sales Growth (%) N/A N/A N/A N/A N/A
Export Sales/total Sales (%) N/A N/A N/A N/A N/A
Net sales growth
System wide sales growth

16
Food & Beverages│Philippines
Jollibee Foods Corp│May 15, 2018
DISCLAIMER The content of this report (including the views and opinions expressed therein, and the information comprised therein) has been prepared by and belongs to CGS-CIMB or CIMB, as the case may be, save that (i) if it is a report written by the analyst(s) of John Keells Stock Brokers (“John Keells”), it belongs to John Keells; (ii) if it is a report written by the analyst(s) of SB Equities Inc (“SBE”), it belongs to SBE; and (iii) if it is a report written by the analyst(s) of Morgans Financial Limited (“Morgans”), it belongs to Morgans. This report is distributed by CGS-CIMB or CIMB, as the case may be, and in respect of sections of the report relating to (i), (ii) and/or (iii) aforesaid, it is distributed pursuant to an arrangement between John Keells, SBE and Morgans respectively and none of the aforesaid parties is an affiliate of CGS-CIMB or CIMB.
This report is not directed to, or intended for distribution to or use by, any person or entity who is a citizen or resident of or located in any locality, state, country or other jurisdiction where such distribution, publication, availability or use would be contrary to law or regulation.
By accepting this report, the recipient hereof represents and warrants that he is entitled to receive such report in accordance with the restrictions set forth below and agrees to be bound by the limitations contained herein (including the “Restrictions on Distributions” set out below). Any failure to comply with these limitations may constitute a violation of law. This publication is being supplied to you strictly on the basis that it will remain confidential. No part of this report may be (i) copied, photocopied, duplicated, stored or reproduced in any form by any means or (ii) redistributed or passed on, directly or indirectly, to any other person in whole or in part, for any purpose without the prior written consent of CGS-CIMB or CIMB, as the case may be.
The information contained in this research report is prepared from data believed to be correct and reliable at the time of issue of this report. CGS-CIMB, CIMB, John Keells, SBE and/or Morgans, as the case may be, may or may not issue regular reports on the subject matter of this report at any frequency and may cease to do so or change the periodicity of reports at any time. None of CGS-CIMB, CIMB, John Keells, SBE or Morgans is under any obligation to update this report in the event of a material change to the information contained in this report. None of CGS-CIMB, CIMB, John Keells, SBE or Morgans has any and none of them will accept any, obligation to (i) check or ensure that the contents of this report remain current, reliable or relevant, (ii) ensure that the content of this report constitutes all the information a prospective investor may require, (iii) ensure the adequacy, accuracy, completeness, reliability or fairness of any views, opinions and information, and accordingly, CGS-CIMB, CIMB, John Keells, SBE and Morgans and their respective affiliates and related persons including China Galaxy International Financial Holdings Limited (“CGIFHL”) and CIMB Group Sdn. Bhd. (“CIMBG”) and their respective related corporations (and their respective directors, associates, connected persons and/or employees) shall not be liable in any manner whatsoever for any consequences (including but not limited to any direct, indirect or consequential losses, loss of profits and damages) of any reliance thereon or usage thereof. In particular, CGS-CIMB, CIMB, John Keells, SBE and Morgans disclaim all responsibility and liability for the views and opinions set out in this report.
Unless otherwise specified, this report is based upon sources which CGS-CIMB or CIMB, as the case may be, considers to be reasonable. Such sources will, unless otherwise specified, for market data, be market data and prices available from the main stock exchange or market where the relevant security is listed, or, where appropriate, any other market. Information on the accounts and business of company(ies) will generally be based on published statements of the company(ies), information disseminated by regulatory information services, other publicly available information and information resulting from our research.
Whilst every effort is made to ensure that statements of facts made in this report are accurate, all estimates, projections, forecasts, expressions of opinion and other subjective judgments contained in this report are based on assumptions considered to be reasonable as of the date of the document in which they are contained and must not be construed as a representation that the matters referred to therein will occur. Past performance is not a reliable indicator of future performance. The value of investments may go down as well as up and those investing may, depending on the investments in question, lose more than the initial investment. No report shall constitute an offer or an invitation by or on behalf of CGS-CIMB or CIMB, as the case may be, or any of their respective affiliates (including CGIFHL, CIMBG and their respective related corporations) to any person to buy or sell any investments.
CGS-CIMB, CIMB, their respective affiliates and related corporations (including CGIFHL, CIMBG and their respective related corporations) and/or their respective directors, associates, connected parties and/or employees may own or have positions in securities of the company(ies) covered in this research report or any securities related thereto and may from time to time add to or dispose of, or may be materially interested in, any such securities. Further, CGS-CIMB, CIMB, their respective affiliates and their respective related corporations (including CGIFHL, CIMBG and their respective related corporations) do and seek to do business with the company(ies) covered in this research report and may from time to time act as market maker or have assumed an underwriting commitment in securities of such company(ies), may sell them to or buy them from customers on a principal basis and may also perform or seek to perform significant investment banking, advisory, underwriting or placement services for or relating to such company(ies) as well as solicit such investment, advisory or other services from any entity mentioned in this report.
CGS-CIMB, CIMB or their respective affiliates (including CGIFHL, CIMBG and their respective related corporations) may enter into an agreement with the company(ies) covered in this report relating to the production of research reports. CGS-CIMB or CIMB, as the case may be, may disclose the contents of this report to the company(ies) covered by it and may have amended the contents of this report following such disclosure.
The analyst responsible for the production of this report hereby certifies that the views expressed herein accurately and exclusively reflect his or her personal views and opinions about any and all of the issuers or securities analysed in this report and were prepared independently and autonomously. No part of the compensation of the analyst(s) was, is, or will be directly or indirectly related to the inclusion of specific recommendations(s) or view(s) in this report. The analyst(s) who prepared this research report is prohibited from receiving any compensation, incentive or bonus based on specific investment banking transactions or for providing a specific recommendation for, or view of, a particular company. Information barriers and other arrangements may be established where necessary to prevent conflicts of interests arising. However, the analyst(s) may receive compensation that is based on his/their coverage of company(ies) in the performance of his/their duties or the performance of his/their recommendations and the research personnel involved in the preparation of this report may also participate in the solicitation of the businesses as described above. In reviewing this research report, an investor should be aware that any or all of the foregoing, among other things, may give rise to real or potential conflicts of interest. Additional information is, subject to the duties of confidentiality, available on request.
Reports relating to a specific geographical area are produced by the corresponding CGS-CIMB entity as listed in the table below. The term “CGS-CIMB” shall denote, where appropriate, the relevant entity distributing or disseminating the report in the particular jurisdiction referenced below, or, in every other case except as otherwise stated herein, CGS-CIMB Securities International Pte. Ltd. and its affiliates, subsidiaries and related

17
Food & Beverages│Philippines
Jollibee Foods Corp│May 15, 2018
corporations.
Country CGS-CIMB Entity Regulated by
Hong Kong CGS-CIMB Securities (Hong Kong) Limited Securities and Futures Commission Hong Kong
India CGS-CIMB Securities (India) Private Limited Securities and Exchange Board of India (SEBI)
Indonesia PT CGS-CIMB Sekuritas Indonesia Financial Services Authority of Indonesia
Singapore CGS-CIMB Research Pte. Ltd. Monetary Authority of Singapore
South Korea CGS-CIMB Securities (Hong Kong) Limited, Korea Branch Financial Services Commission and Financial Supervisory Service
Thailand CGS-CIMB Securities (Thailand) Co. Ltd. Securities and Exchange Commission Thailand
Reports relating to Malaysia are produced by CIMB as listed in the table below:
Country CIMB Entity Regulated by
Malaysia CIMB Investment Bank Berhad Securities Commission Malaysia
Other Significant Financial Interests:
(i) As of May 11, 2018 CIMB has a proprietary position in the securities (which may include but not limited to shares, warrants, call warrants and/or any other derivatives) in the following company or companies covered or recommended in this report:
(a) -
(ii) Analyst Disclosure: As of May 15, 2018, the analyst(s) who prepared this report, and the associate(s), has / have an interest in the securities (which may include but not limited to shares, warrants, call warrants and/or any other derivatives) in the following company or companies covered or recommended in this report:
(a) -
This report does not purport to contain all the information that a prospective investor may require. Neither CGS-CIMB or CIMB, as the case may be, nor any of their respective affiliates (including CGIFHL, CIMBG and their related corporations) make any guarantee, representation or warranty, express or implied, as to the adequacy, accuracy, completeness, reliability or fairness of any such information and opinion contained in this report. Neither CGS-CIMB or CIMB, as the case may be, nor any of their respective affiliates nor their related persons (including CGIFHL, CIMBG and their related corporations) shall be liable in any manner whatsoever for any consequences (including but not limited to any direct, indirect or consequential losses, loss of profits and damages) of any reliance thereon or usage thereof.
This report is general in nature and has been prepared for information purposes only. It is intended for circulation amongst CGS-CIMB’s or CIMB’s (as the case may be) clients generally and does not have regard to the specific investment objectives, financial situation and the particular needs of any specific person who may receive this report. The information and opinions in this report are not and should not be construed or considered as an offer, recommendation or solicitation to buy or sell the subject securities, related investments or other financial instruments or any derivative instrument, or any rights pertaining thereto.
Investors are advised to make their own independent evaluation of the information contained in this research report, consider their own individual investment objectives, financial situation and particular needs and consult their own professional and financial advisers as to the legal, business, financial, tax and other aspects before participating in any transaction in respect of the securities of company(ies) covered in this research report.
The securities of such company(ies) may not be eligible for sale in all jurisdictions or to all categories of investors.
Australia: Despite anything in this report to the contrary, this research is provided in Australia by CGS-CIMB Securities (Singapore) Pte. Ltd. and CGS-CIMB Securities (Hong Kong) Limited. This research is only available in Australia to persons who are “wholesale clients” (within the meaning of the Corporations Act 2001 (Cth) and is supplied solely for the use of such wholesale clients and shall not be distributed or passed on to any other person. You represent and warrant that if you are in Australia, you are a “wholesale client”. This research is of a general nature only and has been prepared without taking into account the objectives, financial situation or needs of the individual recipient. CGS-CIMB Securities (Singapore) Pte. Ltd. and CGS-CIMB Securities (Hong Kong) Limited do not hold, and are not required to hold an Australian financial services license. CGS-CIMB Securities (Singapore) Pte. Ltd. and CGS-CIMB Securities (Hong Kong) Limited rely on “passporting” exemptions for entities appropriately licensed by the Monetary Authority of Singapore (under ASIC Class Order 03/1102) and the Securities and Futures Commission in Hong Kong (under ASIC Class Order 03/1103).
Canada: This research report has not been prepared in accordance with the disclosure requirements of Dealer Member Rule 3400 – Research Restrictions and Disclosure Requirements of the Investment Industry Regulatory Organization of Canada. For any research report distributed by CIBC, further disclosures related to CIBC conflicts of interest can be found at https://researchcentral.cibcwm.com .
China: For the purpose of this report, the People’s Republic of China (“PRC”) does not include the Hong Kong Special Administrative Region, the Macau Special Administrative Region or Taiwan. The distributor of this report has not been approved or licensed by the China Securities Regulatory Commission or any other relevant regulatory authority or governmental agency in the PRC. This report contains only marketing information. The distribution of this report is not an offer to buy or sell to any person within or outside PRC or a solicitation to any person within or outside of PRC to buy or sell any instruments described herein. This report is being issued outside the PRC to a limited number of institutional investors and may not be provided to any person other than the original recipient and may not be reproduced or used for any other purpose.
France: Only qualified investors within the meaning of French law shall have access to this report. This report shall not be considered as an offer to subscribe to, or used in connection with, any offer for subscription or sale or marketing or direct or indirect distribution of financial instruments and it is not intended as a solicitation for the purchase of any financial instrument.
Germany: This report is only directed at persons who are professional investors as defined in sec 31a(2) of the German Securities Trading Act (WpHG). This publication constitutes research of a non-binding nature on the market situation and the investment instruments cited here at the time of the publication of the information.
The current prices/yields in this issue are based upon closing prices from Bloomberg as of the day preceding publication. Please note that neither the German Federal Financial Supervisory Agency (BaFin), nor any other supervisory authority exercises any control over the content of this report.
Hong Kong: This report is issued and distributed in Hong Kong by CGS-CIMB Securities (Hong Kong) Limited (“CHK”) which is licensed in Hong Kong by the Securities and Futures Commission for Type 1 (dealing in securities), Type 4 (advising on securities) and Type 6 (advising on corporate

18
Food & Beverages│Philippines
Jollibee Foods Corp│May 15, 2018
finance) activities. Any investors wishing to purchase or otherwise deal in the securities covered in this report should contact the Head of Sales at CGS-CIMB Securities (Hong Kong) Limited. The views and opinions in this research report are our own as of the date hereof and are subject to change. If the Financial Services and Markets Act of the United Kingdom or the rules of the Financial Conduct Authority apply to a recipient, our obligations owed to such recipient therein are unaffected. CHK has no obligation to update its opinion or the information in this research report.
This publication is strictly confidential and is for private circulation only to clients of CHK.
CHK does not make a market on other securities mentioned in the report.
India: This report is issued and distributed in India by CGS-CIMB Securities (India) Private Limited (“CGS-CIMB India”) which is registered with the National Stock Exchange of India Limited and BSE Limited as a trading and clearing member under the Securities and Exchange Board of India (Stock Brokers and Sub-Brokers) Regulations, 1992. In accordance with the provisions of Regulation 4(g) of the Securities and Exchange Board of India (Investment Advisers) Regulations, 2013, CGS-CIMB India is not required to seek registration with the Securities and Exchange Board of India (“SEBI”) as an Investment Adviser. CGS-CIMB India is registered with SEBI as a Research Analyst pursuant to the SEBI (Research Analysts) Regulations, 2014 ("Regulations").
This report does not take into account the particular investment objectives, financial situations, or needs of the recipients. It is not intended for and does not deal with prohibitions on investment due to law/jurisdiction issues etc. which may exist for certain persons/entities. Recipients should rely on their own investigations and take their own professional advice before investment.
The report is not a “prospectus” as defined under Indian Law, including the Companies Act, 2013, and is not, and shall not be, approved by, or filed or registered with, any Indian regulator, including any Registrar of Companies in India, SEBI, any Indian stock exchange, or the Reserve Bank of India. No offer, or invitation to offer, or solicitation of subscription with respect to any such securities listed or proposed to be listed in India is being made, or intended to be made, to the public, or to any member or section of the public in India, through or pursuant to this report.
The research analysts, strategists or economists principally responsible for the preparation of this research report are segregated from the other activities of CGS-CIMB India and they have received compensation based upon various factors, including quality, accuracy and value of research, firm profitability or revenues, client feedback and competitive factors. Research analysts', strategists' or economists' compensation is not linked to investment banking or capital markets transactions performed or proposed to be performed by CGS-CIMB India or its affiliates.
CGS-CIMB India has not received any investment banking related compensation from the companies mentioned in the report in the past 12 months.
CGS-CIMB India has not received any compensation from the companies mentioned in the report in the past 12 months.
Indonesia: This report is issued and distributed by PT CGS-CIMB Sekuritas Indonesia (“CGS-CIMB Indonesia”). The views and opinions in this research report are our own as of the date hereof and are subject to change. CGS-CIMB Indonesia has no obligation to update its opinion or the information in this research report. Neither this report nor any copy hereof may be distributed in Indonesia or to any Indonesian citizens wherever they are domiciled or to Indonesian residents except in compliance with applicable Indonesian capital market laws and regulations.
This research report is not an offer of securities in Indonesia. The securities referred to in this research report have not been registered with the Financial Services Authority (Otoritas Jasa Keuangan) pursuant to relevant capital market laws and regulations, and may not be offered or sold within the territory of the Republic of Indonesia or to Indonesian citizens through a public offering or in circumstances which constitute an offer within the meaning of the Indonesian capital market law and regulations.
Ireland: CGS-CIMB is not an investment firm authorised in the Republic of Ireland and no part of this document should be construed as CGS-CIMB acting as, or otherwise claiming or representing to be, an investment firm authorised in the Republic of Ireland.
Malaysia: This report is distributed by CIMB solely for the benefit of and for the exclusive use of our clients. CIMB has no obligation to update, revise or reaffirm its opinion or the information in this research reports after the date of this report.
New Zealand: In New Zealand, this report is for distribution only to persons who are wholesale clients pursuant to section 5C of the Financial Advisers Act 2008.
Singapore: This report is issued and distributed by CGS-CIMB Research Pte Ltd (“CGS-CIMBR”). CGS-CIMBR is a financial adviser licensed under the Financial Advisers Act, Cap 110 (“FAA”) for advising on investment products, by issuing or promulgating research analyses or research reports, whether in electronic, print or other form. Accordingly CGS-CIMBR is a subject to the applicable rules under the FAA unless it is able to avail itself to any prescribed exemptions.
Recipients of this report are to contact CGS-CIMB Research Pte Ltd, 50 Raffles Place, #16-02 Singapore Land Tower, Singapore in respect of any matters arising from, or in connection with this report. CGS-CIMBR has no obligation to update its opinion or the information in this research report. This publication is strictly confidential and is for private circulation only. If you have not been sent this report by CGS-CIMBR directly, you may not rely, use or disclose to anyone else this report or its contents.
If the recipient of this research report is not an accredited investor, expert investor or institutional investor, CGS-CIMBR accepts legal responsibility for the contents of the report without any disclaimer limiting or otherwise curtailing such legal responsibility. If the recipient is an accredited investor, expert investor or institutional investor, the recipient is deemed to acknowledge that CGS-CIMBR is exempt from certain requirements under the FAA and its attendant regulations, and as such, is exempt from complying with the following : (a) Section 25 of the FAA (obligation to disclose product information); (b) Section 27 (duty not to make recommendation with respect to any investment product without having a reasonable basis where you may be reasonably expected to rely on the recommendation) of the FAA; (c) MAS Notice on Information to Clients and Product Information Disclosure [Notice No. FAA-N03]; (d) MAS Notice on Recommendation on Investment Products [Notice No. FAA-N16]; (e) Section 36 (obligation on disclosure of interest in securities), and (f) any other laws, regulations, notices, directive, guidelines, circulars and practice notes which are relates to the above, to the extent permitted by applicable laws, as may be amended from time to time, and any other laws, regulations, notices, directive, guidelines, circulars, and practice notes as we may notify you from time to time. In addition, the recipient who is an accredited investor, expert investor or institutional investor acknowledges that a CGS-CIMBR is exempt from Section 27 of the FAA, the recipient will also not be able to file a civil claim against CGS-CIMBR for any loss or damage arising from the recipient’s reliance on any recommendation made by CGS-CIMBR which would otherwise be a right that is available to the recipient under Section 27 of the FAA, the recipient will also not be able to file a civil claim against CGS-CIMBR for any loss or damage arising from
19
Food & Beverages│Philippines
Jollibee Foods Corp│May 15, 2018
the recipient’s reliance on any recommendation made by CGS-CIMBR which would otherwise be a right that is available to the recipient under Section 27 of the FAA.
CGS-CIMBR, its affiliates and related corporations, their directors, associates, connected parties and/or employees may own or have positions in securities of the company(ies) covered in this research report or any securities related thereto and may from time to time add to or dispose of, or may be materially interested in, any such securities. Further, CGS-CIMBR, its affiliates and its related corporations do and seek to do business with the company(ies) covered in this research report and may from time to time act as market maker or have assumed an underwriting commitment in securities of such company(ies), may sell them to or buy them from customers on a principal basis and may also perform or seek to perform significant investment banking, advisory, underwriting or placement services for or relating to such company(ies) as well as solicit such investment, advisory or other services from any entity mentioned in this report.
As of May 11, 2018, CGS-CIMBR does not have a proprietary position in the recommended securities in this report.
CGS-CIMBR does not make a market on the securities mentioned in the report.
South Korea: This report is issued and distributed in South Korea by CGS-CIMB Securities (Hong Kong) Limited, Korea Branch (“CGS-CIMB Korea”) which is licensed as a cash equity broker, and regulated by the Financial Services Commission and Financial Supervisory Service of Korea. In South Korea, this report is for distribution only to professional investors under Article 9(5) of the Financial Investment Services and Capital Market Act of Korea (“FSCMA”).
Spain: This document is a research report and it is addressed to institutional investors only. The research report is of a general nature and not personalised and does not constitute investment advice so, as the case may be, the recipient must seek proper advice before adopting any investment decision. This document does not constitute a public offering of securities.
CGS-CIMB is not registered with the Spanish Comision Nacional del Mercado de Valores to provide investment services.
Sweden: This report contains only marketing information and has not been approved by the Swedish Financial Supervisory Authority. The distribution of this report is not an offer to sell to any person in Sweden or a solicitation to any person in Sweden to buy any instruments described herein and may not be forwarded to the public in Sweden.
Switzerland: This report has not been prepared in accordance with the recognized self-regulatory minimal standards for research reports of banks issued by the Swiss Bankers’ Association (Directives on the Independence of Financial Research).
Thailand: This report is issued and distributed by CGS-CIMB Securities (Thailand) Co. Ltd. (“CGS-CIMB Thailand”) based upon sources believed to be reliable (but their accuracy, completeness or correctness is not guaranteed). The statements or expressions of opinion herein were arrived at after due and careful consideration for use as information for investment. Such opinions are subject to change without notice and CGS-CIMB Thailand has no obligation to update its opinion or the information in this research report.
CGS-CIMB Thailand may act or acts as Market Maker, and issuer and offerer of Derivative Warrants and Structured Note which may have the following securities as its underlying securities. Investors should carefully read and study the details of the derivative warrants in the prospectus before making investment decisions.
AAV, ADVANC, AMATA, ANAN, AOT, AP, BA, BANPU, BBL, BCH, BCP, BCPG, BDMS, BEAUTY, BEC, BEM, BJC, BH, BIG, BLA, BLAND, BPP, BTS, CBG, CENTEL, CHG, CK, CKP, COM7, CPALL, CPF, CPN, DELTA, DTAC, EA, EGCO, EPG, GFPT, GLOBAL, GLOW, GPSC, GUNKUL, HMPRO, INTUCH, IRPC, ITD, IVL, KBANK, KCE, KKP, KTB, KTC, LH, LHBANK, LPN, MAJOR, MALEE, MEGA, MINT, MONO, MTLS, PLANB, PSH, PTL, PTG, PTT, PTTEP, PTTGC, QH, RATCH, ROBINS, S, SAWAD, SCB, SCC, SCCC, SIRI, SPALI, SPRC, STEC, STPI, SUPER, TASCO, TCAP, THAI, THANI, THCOM, TISCO, TKN, TMB, TOP, TPIPL, TRUE, TTA, TU, TVO, UNIQ, VGI, WHA, WORK.
Corporate Governance Report:
The disclosure of the survey result of the Thai Institute of Directors Association (“IOD”) regarding corporate governance is made pursuant to the policy of the Office of the Securities and Exchange Commission. The survey of the IOD is based on the information of a company listed on the Stock Exchange of Thailand and the Market for Alternative Investment disclosed to the public and able to be accessed by a general public investor. The result, therefore, is from the perspective of a third party. It is not an evaluation of operation and is not based on inside information.
The survey result is as of the date appearing in the Corporate Governance Report of Thai Listed Companies. As a result, the survey result may be changed after that date. CGS-CIMB Thailand does not confirm nor certify the accuracy of such survey result.
Score Range: 90 - 100 80 – 89 70 - 79 Below 70 or No Survey Result
Description: Excellent Very Good Good N/A
United Arab Emirates: The distributor of this report has not been approved or licensed by the UAE Central Bank or any other relevant licensing authorities or governmental agencies in the United Arab Emirates. This report is strictly private and confidential and has not been reviewed by, deposited or registered with UAE Central Bank or any other licensing authority or governmental agencies in the United Arab Emirates. This report is being issued outside the United Arab Emirates to a limited number of institutional investors and must not be provided to any person other than the original recipient and may not be reproduced or used for any other purpose. Further, the information contained in this report is not intended to lead to the sale of investments under any subscription agreement or the conclusion of any other contract of whatsoever nature within the territory of the United Arab Emirates.
United Kingdom and European Economic Area (EEA): In the United Kingdom and European Economic Area, this material is also being distributed by CGS-CIMB Securities (UK) Limited (“CGS-CIMB UK”). CGS-CIMB UK is authorized and regulated by the Financial Conduct Authority and its registered office is at 27 Knightsbridge, London, SW1X7YB. The material distributed by CGS-CIMB UK has been prepared in accordance with CGS-CIMB’s policies for managing conflicts of interest arising as a result of publication and distribution of this material. This material is for distribution only to, and is solely directed at, selected persons on the basis that those persons: (a) are eligible counterparties and professional clients of CGS-CIMB UK; (b) have professional experience in matters relating to investments falling within Article 19(5) of the Financial Services and Markets Act 2000 (Financial Promotion) Order 2005 (as amended, the “Order”), (c) fall within Article 49(2)(a) to (d) (“high net worth companies, unincorporated associations etc”) of the Order; (d) are outside the United Kingdom subject to relevant regulation in each jur isdiction, material(all such persons together being referred to as “relevant persons”). This material is directed only at relevant persons and must not be acted on or relied on by persons who are not relevant persons. Any investment or investment activity to which this material relates is available only to relevant persons
20
Food & Beverages│Philippines
Jollibee Foods Corp│May 15, 2018
and will be engaged in only with relevant persons.
Where this material is labelled as non-independent, it does not provide an impartial or objective assessment of the subject matter and does not constitute independent “research” (cannot remove research from here under the applicable rules of the Financial Conduct Authority in the UK. Consequently, any such non-independent material will not have been prepared in accordance with legal requirements designed to promote the independence of research (cannot remove research from here) and will not subject to any prohibition on dealing ahead of the dissemination of research. Any such non-independent material must be considered as a marketing communication.
United States: This research report is distributed in the United States of America by CGS-CIMB Securities (USA) Inc, a U.S. registered broker-dealer and a related company of CGS-CIMB Research Pte Ltd, PT CGS-CIMB Sekuritas Indonesia, CGS-CIMB Securities (Thailand) Co. Ltd, CGS-CIMB Securities (Hong Kong) Limited, CGS-CIMB Securities (India) Private Limited, and is distributed solely to persons who qualify as “U.S. Institutional Investors” as defined in Rule 15a-6 under the Securities and Exchange Act of 1934. This communication is only for Institutional Investors whose ordinary business activities involve investing in shares, bonds, and associated securities and/or derivative securities and who have professional experience in such investments. Any person who is not a U.S. Institutional Investor or Major Institutional Investor must not rely on this communication. The delivery of this research report to any person in the United States of America is not a recommendation to effect any transactions in the securities discussed herein, or an endorsement of any opinion expressed herein. CGS-CIMB Securities (USA) Inc, is a FINRA/SIPC member and takes responsibility for the content of this report. For further information or to place an order in any of the above-mentioned securities please contact a registered representative of CGS-CIMB Securities (USA) Inc.
CIMB Securities (USA) Inc. does not make a market on other securities mentioned in the report.
CGS-CIMB Securities (USA) Inc. has not managed or co-managed a public offering of any of the securities mentioned in the past 12 months.
CGS-CIMB Securities (USA) Inc. has not received compensation for investment banking services from any of the company mentioned in the past 12 months.
CGS-CIMB Securities (USA) Inc. neither expects to receive nor intends to seek compensation for investment banking services from any of the company mentioned within the next 3 months.
Other jurisdictions: In any other jurisdictions, except if otherwise restricted by laws or regulations, this report is only for distribution to professional, institutional or sophisticated investors as defined in the laws and regulations of such jurisdictions.
Spitzer Chart for stock being researched ( 2 year data )
Jollibee Foods Corp (JFC PM)
Rating Distribution (%) Inv estment Banking clients (%)
Add 61.1% 5.5%
Hold 29.7% 2.0%
Reduce 8.9% 0.4%
Distribution of stock ratings and inv estment banking clients for quarter ended on 31 March 2018
1275 companies under cov erage for quarter ended on 31 March 2018
160
180
200
220
240
260
280
300
320
May-15 Nov-15 May-16 Nov-16 May-17 Nov-17
Price Close
196.0
188.0
200.4
200.4
224.0
224.0
Recommendations & Target Price
Add Hold Reduce Not Rated

21
Food & Beverages│Philippines
Jollibee Foods Corp│May 15, 2018
Corporate Governance Report of Thai Listed Companies (CGR). CG Rating by the Thai Institute of Directors Association (Thai IOD) in 2017, Anti-Corruption 2017
AAV – Very Good, n/a, ADVANC – Excellent, Certified, AEONTS – Good, n/a, AMATA – Very Good, n/a, ANAN – Excellent, n/a, AOT – Excellent, Declared, AP – Excellent, Declared, ASK – Very Good, Declared, ASP – Very Good, Certified, BANPU – Excellent, Certified, BAY – Excellent, Certified, BBL – Very Good, Certified, BCH – Good, Declared, BCP - Excellent, Certified, BCPG – Very Good, n/a, BEM – Very Good, n/a, BDMS – Very Good, n/a, BEAUTY – Good, n/a, BEC – Very Good, n/a, , BGRIM – not available, n/a, BH - Good, n/a, BJC – Very Good, Declared, BJCHI – Very Good, Declared, BLA – Very Good, Certified, BPP – Good, n/a, BR - Good, Declared, BTS - Excellent, Certified, CBG – Good, n/a, CCET – Good, n/a, CENTEL – Very Good, Certified, CHG – Very Good, Declared, CK – Excellent, n/a, COL – Very Good, Declared, CPALL – not available, Declared, CPF – Excellent, Declared, CPN - Excellent, Certified, DELTA - Excellent, n/a, DEMCO – Excellent, Certified, DIF – not available, n/a, DTAC – Excellent, Certified, EA – Very Good, n/a, ECL – Very Good, Certified, EGCO - Excellent, Certified, EPG – Very Good, n/a, GFPT - Excellent, Declared, GGC – not available, Declared, GLOBAL – Very Good, Declared, GLOW – Very Good, Certified, GPSC – Excellent, Declared, GRAMMY - Excellent, n/a, GUNKUL – Excellent, Declared, HANA - Excellent, Certified, HMPRO - Excellent, Certified, ICHI – Excellent, n/a, III – not available, n/a, INTUCH - Excellent, Certified, IRPC – Excellent, Certified, ITD – Very Good, n/a, IVL - Excellent, Certified, JAS – not available, Declared, JASIF – not available, n/a, JUBILE – Good, Declared, KAMART – not available, n/a, KBANK - Excellent, Certified, KCE - Excellent, Certified, KGI – Very Good, Certified, KKP – Excellent, Certified, KSL – Very Good, Certified, KTB - Excellent, Certified, KTC – Excellent, Certified, LH - Very Good, n/a, LPN – Excellent, Certified, M – Very Good, n/a, MACO – Very Good, n/a, MAJOR – Very Good, n/a, MAKRO – Very Good, Declared, MALEE – Very Good, n/a, MBKET – Very Good, Certified, MC – Very Good, Declared, MCOT – Excellent, Certified, MEGA – Very Good, n/a, MINT - Excellent, Certified, MTLS – Very Good, Declared, NYT – Excellent, n/a, OISHI – Very Good, n/a, PLANB – Excellent, Declared, PLAT – Very Good, Certified, PSH – Excellent, Certified, PSL - Excellent, Certified, PTT - Excellent, Certified, PTTEP - Excellent, Certified, PTTGC - Excellent, Certified, QH – Excellent, Certified, RATCH – Excellent, Certified, ROBINS – Excellent, Certified, RS – Very Good, n/a, SAMART - Excellent, n/a, SAPPE - Good, n/a, SAT – Excellent, Certified, SAWAD – Very Good, n/a, SC – Excellent, Declared, SCB - Excellent, Certified, SCBLIF – not available, n/a, SCC – Excellent, Certified, SCN – Very Good, Declared, SCCC - Excellent, Declared, SIM - Excellent, n/a, SIRI – Very Good, Declared, SPA - Good, n/a, SPALI - Excellent, n/a, SPRC – Excellent, Declared, STA – Very Good, Declared, STEC – Excellent, n/a, SVI – Excellent, Certified, TASCO – Very Good, n/a, TCAP – Excellent, Certified, THAI – Very Good, n/a, THANI – Very Good, Certified, THCOM – Excellent, Certified, THRE – Very Good, Certified, THREL – Excellent, Certified, TICON – Very Good, Declared, TIPCO – Very Good, Certified, TISCO - Excellent, Certified, TK – Very Good, n/a, TKN – Very Good, Declared, TMB - Excellent, Certified, TNR – Good, n/a, TOP - Excellent, Certified, TPCH – Good, n/a, TPIPP – not available, n/a, TRUE – Excellent, Declared, TTW – Very Good, n/a, TU – Excellent, Declared, TVO – Excellent, Declared, UNIQ – not available, Declared, VGI – Excellent, Declared, WHA – not available, Declared, WHART – not available, n/a, WORK – not available, n/a.
Companies participating in Thailand’s Private Sector Collective Action Coalition Against Corruption programme (Thai CAC) under Thai Institute of Directors (as of October 28, 2016) are categorized into:
- Companies that have declared their intention to join CAC, and
- Companies certified by CAC
Recommendation Framework
Stock Ratings Definition:
Add The stock’s total return is expected to exceed 10% over the next 12 months.
Hold The stock’s total return is expected to be between 0% and positive 10% over the next 12 months.
Reduce The stock’s total return is expected to fall below 0% or more over the next 12 months.
The total expected return of a stock is defined as the sum of the: (i) percentage difference between the target price and the current price and (ii) the forward net dividend yields of the stock. Stock price targets have an investment horizon of 12 months.
Sector Ratings Definition:
Overweight An Overweight rating means stocks in the sector have, on a market cap-weighted basis, a positive absolute recommendation.
Neutral A Neutral rating means stocks in the sector have, on a market cap-weighted basis, a neutral absolute recommendation.
Underweight An Underweight rating means stocks in the sector have, on a market cap-weighted basis, a negative absolute recommendation.
Country Ratings Definition:
Overweight An Overweight rating means investors should be positioned with an above-market weight in this country relative to benchmark.
Neutral A Neutral rating means investors should be positioned with a neutral weight in this country relative to benchmark.
Underweight An Underweight rating means investors should be positioned with a below-market weight in this country relative to benchmark.
#01