price structure in two-sided markets: evidence from the...
TRANSCRIPT

24 (2006) 1–28
www.elsevier.com/locate/econbase
Price structure in two-sided markets: Evidence
from the magazine industry
Ulrich Kaiser a,b,c,*, Julian Wright d
a University of Southern Denmark at Odense, Department of Business and Economics, Campusvej 55,
5230 Odense M, Denmarkb Centre for European Economic Research, Mannheim, Germany
c Centre for Economic and Business Research, Copenhagen, Denmarkd Department of Economics, National University of Singapore, AS2 Level 6,
1 Arts Link, Singapore 117570, Singapore
Received 10 March 2004; received in revised form 5 November 2004; accepted 30 June 2005
Available online 9 September 2005
Abstract
We present and estimate a model of competition in a two-sided market: the market for magazine
readership and advertising. Using data on magazines in Germany, we find evidence that magazines
have properties of two-sided markets. The results are consistent with the perception that prices for
readers are dsubsidizedT and that magazines make all their money from advertisers. Consistent with
advertisers valuing readers more than readers value advertisements, our results imply that higher
demand on the reader side increases ad rates, but that higher demand on the advertising side
decreases cover prices.
D 2005 Elsevier B.V. All rights reserved.
JEL classification: C33; L11
Keywords: Two-sided markets; Magazine markets; Advertising
0167-7187/$ -
doi:10.1016/j.
* Correspon
E-mail add
URL: http
International Journal of Industrial Organization
see front matter D 2005 Elsevier B.V. All rights reserved.
ijindorg.2005.06.002
ding author.
ress: [email protected] (U. Kaiser).
://www.sam.sdu.dk/staff/uka (U. Kaiser).
U. Kaiser, J. Wright / Int. J. Ind. Organ. 24 (2006) 1–282
1. Introduction
Many markets where network externalities are important are, in fact, two-sided
markets. Two-sided markets have the property that there are two distinct types of users,
each of which wishes to interact on a common platform, and in which the structure of
prices between the two sides (rather than just the total level of prices) matters.1 Some
common examples include directory services such as classifieds and Yellow Pages;
matching markets such as employment websites, dating agencies; media markets such as
magazines, newspapers and Internet Portals; and trading posts such as auctions, B2B
markets, and shopping malls.
A key question arising in two-sided markets is how do platforms price to each type of
user? Is one side of the market dsubsidizedT in order to attract the other? Armstrong (2005),
Caillaud and Jullien (2003), and Rochet and Tirole (2003) each provide theoretical
frameworks of two-sided markets to explain how the structure of prices is determined
when either a monopoly platform sets prices, or two platforms compete. This paper takes
one such framework and uses it to explore magazine markets in Germany.
The framework considered is based on Armstrong (2005), in which there are two
groups of participants, and the benefit to joining a platform depends on the number of
agents from the opposite group on the same platform. Armstrong considers three basic
settings: (I) a monopoly platform; (II) two-sided singlehoming where two platforms that
are differentiated based on the Hotelling model compete for each group, but all users join a
single platform exclusively; and (III) competitive bottlenecks where two platforms
compete for one group of users who join a single platform exclusively, but not for the other
group of users who join both platforms (multihome).
For each of these settings, we adapt Armstrong’s model to fit the magazine industry.
Two-sidedness arises since advertisers value the number of readers of the magazine and
readers value the number of ads in the magazine. In addition, we allow readers to value the
amount of content in the magazine. A magazine chooses a cover price, an advertising price
and the amount of content to produce in order to maximize its profits (in the case of
competition, given the prices and content choice of the rival magazine). We derive the
implied demand system for each of the models and estimate it using data on magazines
from Germany. The models then provide a link between the estimated demand parameters
and the structure of price–cost margins across readers and advertisers, as well as other
variables of interest.
The parameters of the models are estimated using an unbalanced panel of nine distinct
two-magazine groups in Germany during the period 1972–2003. We show how the
estimated parameters can then be used to determine the size of the network effects running
in each direction (how much readers value ads, and how much advertisers value readers),
and how the structure of the price–cost margins and cross-market comparative static
results reflect asymmetries across the two sides of the market. Although the estimation
results are broadly similar across the three specifications considered, we focus on the two-
sided singlehoming setting since we find strong evidence of price competition on both
sides of the market (both for readers and for advertisers), since we find more users on each
1 See Rochet and Tirole (2004) for a more precise definition. See also Evans (2003a,b).
U. Kaiser, J. Wright / Int. J. Ind. Organ. 24 (2006) 1–28 3
side singlehome than multihome, and since it offers the most parsimonious specification
for estimation.
There is a large existing empirical literature on media markets that allows for
interrelated demands between readers and advertisers. Dewenter (2003) provides a survey.
Much of this literature focuses on the newspaper industry, and is concerned with
estimating the effects of concentration (Reddaway, 1963; Thompson, 1984), the existence
of economies of scale (Rosse, 1967, 1970; Bucklin et al., 1989); and showing the
existence of two-way network effects (Dertouzos and Trautman, 1990).2 Typically,
newspapers are assumed to be monopolistic with respect to the readership side. As a result,
unlike this paper, the literature does not consider how the structure of prices emerges from
competition between two platforms that strategically set prices to each side to take into
account interrelated demands.
More recently, Rysman (2004) estimates a two-sided model of Yellow Page directories
that allows for such competition. However, Yellow Pages are given free to readers. This
means Rysman cannot consider the determination of the structure of prices with his data.
Moreover, he assumes quantity setting platforms to avoid the fixed point problem that
arises in a price setting game with network effects. This motivates our focus on magazines
(which charge both readers and advertisers), as well as our particular model specification
which allows us to study the structure of price–cost margins with estimates of the demand
system alone. Compared to some other two-sided markets (for example, payment
schemes), magazines also fit the assumption of the theoretical framework used in that
users on each side pay to djoinT the platform (rather than based on transactions made
between the two types of users).
The rest of the paper proceeds as follows. Section 2 presents the benchmark model of a
two-sided market that we estimate. Section 3 describes the data, while Section 4 describes
our empirical specification. Results and implications for this model are presented in
Section 5, while Section 6 considers the alternative monopoly and competitive bottleneck
models. Finally, Section 7 briefly concludes.
2. A model of magazines as a two-sided market
We adapt the generic model of two-sided singlehoming developed by Armstrong (2005,
Section 4) to the magazine market. This model is one in which two platforms (in this case
magazines) compete. Competition on each side of the market is modelled in a
differentiated Bertrand fashion, with demands derived from a Hotelling specification.
The complication is that each group values the number of users of the opposite group on
the same platform. We extend this model in a straightforward way by noting magazines
provide three types of services. They provide content for readers, ads which allow readers
to find out about products (possibly) of interest, and an advertising outlet which provides
2 There is also a sizeable empirical literature testing for network effects in one-sided market settings, including
amongst others, Gandal et al. (2000) who consider the case of compact disk players, and Saloner and Shepard
(1995) who consider the case of Automated Teller Machines. The issue addressed in this paper, that of the
structure of prices between each side of the market, does not arise in this literature.

U. Kaiser, J. Wright / Int. J. Ind. Organ. 24 (2006) 1–284
firms with a way to inform readers about their products. Specifically, we allow readers’
utility to also depend on the number of content pages in the magazine, and let magazine
publishers choose content pages as an additional strategic variable.
Assume there are Nr readers, all of whom read one (and only one) magazine. We
follow Armstrong and assume the utility to each reader of magazine i (i=1, 2) is a linear
function, increasing in the number of pages of content Nic and the number of pages of
ads Nia, and decreasing in the price per copy to readers pi. Allowing for an unobservable
component to the utility of reading magazine i, which consists of the common (across
readers) fixed effect hir, a mean-zero error term ei
r and an individual dtransportation costTti(x) which captures the preference of an individual reader (located at x) for magazine i,
the utility of reading magazine i can be written as
ui ¼ hri þ cN ai þ wN c
i � bpi þ eri � ti xð Þ; ð1Þ
where t1(x)=x/2 and t2(x)= (1�x)/2.3 Assuming x is uniformly distributed between 0
and 1, gives the Hotelling specification of reader demand
nr1 ¼1
2þ hr1 � hr2 þ c N a
1 � N a2
� �þ w N c
1 � N c2
� �� b p1 � p2ð Þ þ er1 � er2 ð2Þ
nr2 ¼ 1� nr1 ð3Þ
where nir =Ni
r/Nr is the share of readers of magazine i.
The advertisers’ choice of magazine is modelled in a similar fashion. Assume there
are Na advertisers, all of whom place a single advertisement in one (and only one)
magazine. The profit to a firm of advertising in magazine i (denoted pi) is assumed to
be a linear function, increasing in the number of readers Nir, and decreasing in the fee for
placing an ad ai (the ad rate). The common unobservable component to profits of
advertising in magazine i consists of the fixed effect hia and the mean-zero error term ei
a.
An individual firm’s preference for advertising in a particular magazine is represented by
a transportation cost function, which takes the same form as in the reader’s problem.
Assuming a firm’s location is uniformly distributed between 0 and 1 leads to the
Hotelling specification of advertiser demand
na1 ¼1
2þ ha1 � ha2 þ q N r
1 � N r2
� �� g a1 � a2ð Þ þ ea1 � ea2 ð4Þ
na2 ¼ 1� na1; ð5Þ
where nia=Ni
a/Na is the share of ads in magazine i.
This model assumes firms have a preference to advertise in a particular magazine.
This may capture how well the magazine’s target audience fits with the firm’s ideal
3 We have normalized the Hotelling transportation cost to one half, and allowed for different degrees of product
differentiation by introducing the parameter b on prices.

U. Kaiser, J. Wright / Int. J. Ind. Organ. 24 (2006) 1–28 5
target audience (assuming, for instance, a reader’s choice of magazine correlates with
some other variables such as income, which the advertiser cares about). Alternatively,
the advertiser’s choice of publisher may relate to other (non-readership) aspects, such as
the location of the publisher relative to the advertising firm, the print quality of ads
(glossy or ordinary paper), the lead time needed to meet the publication deadline, the
possibility of a feature issue related to the firm’s specific products, any cross-advertising
possibilities in the publisher’s other magazines, and more generally, the service level
offered to the advertiser.4
The parameters in (2)–(5) measuring the strength of network effects in each direction
are c and q, while the intensity of competition (or the inverse of the extent of product
differentiation) is measured by the parameters b and g. Despite the error terms ei, weassume these theoretical market shares lie between 0 and 1, which they will do by
construction in the data.
The share Eqs. (2)–(5) assume all agents choose one of the magazines exclusively. In
reality some agents will choose neither magazine and some agents will choose both
(multihome). Our results still apply in this case if the reason some agents buy neither
magazine (or both magazines) are exogenous to the decisions of the magazines. This is
obvious for the case that some agents stay out of the market since such agents are then
irrelevant to the analysis. For the case with multihoming, the appendix shows this is also
true.
The profits of (the publisher of) magazine i are assumed to be
Pi ¼ pi � fið ÞN ri þ ai � cið ÞN a
i � di Nci
� �2 � Fi; ð6Þ
where fi is the cost of printing and distributing magazine i per copy sold,5 ci is the cost of
dproducingT a single ad for magazine i, di determines the cost of dproducingT content formagazine i, and Fi is other fixed costs of operations. Variable costs that are associated with
producing ads include liaising with clients on each ad. Note that content only contributes
to profit to the extent it causes an increase in circulation, and indirectly ad revenue.
Moreover, content is assumed to have increasing marginal costs (it is more and more
expensive to get additional interesting stories and material for each issue).
Each magazine sets pi, ai and Nic to maximize its profits, given the choices of its
rival. After observing the choice of these variables, readers decide which magazine to
buy and advertisers decide which magazine to advertise in. Rational expectations are
assumed, so readers and advertisers work out how many of each type will subscribe to
each magazine using the above model when making their own decision. Provided
network benefits are not explosive (which requires 4qcNrNab1, a condition that will be
4 The other extreme, in which firms have no particular preference to advertise in either magazine, leads to the
competitive bottleneck model considered in Section 6.5 In the case the magazines are sold via subscription, this includes the cost of postage and handling, while if the
magazines are sold via kiosks, newsstands and bookstores, then this includes the payment that these retailers
require. Unlike the case in the United States, in Germany most subscription prices are quite similar to those
offered at the newsstands (Kaiser, 2003).

U. Kaiser, J. Wright / Int. J. Ind. Organ. 24 (2006) 1–286
checked empirically), rational expectations imply unique demands, which are the
simultaneous solutions to (2)–(5).
Solving for unique demands, substituting these into (6) for i =1 and 2, and taking
the first order conditions, we can express the equilibrium conditions for both magazines
as6
pi � fi ¼nrib
� 2qN ai
gð7Þ
ai � ci ¼naig
� 2cN ri
bð8Þ
N ci ¼ wN r
i
2dib: ð9Þ
Equilibrium cover prices are marked up above cost to the extent of product
differentiation on the readership side, but discounted to reflect the externality generated
on the advertising side of the market from a magazine attracting more readers. In
equilibrium, the magazines discount cover prices to attract more readers, thereby attracting
more advertisers. This effect is increasing in the extent to which advertisers value readers
and in the number of firms wanting to place ads in magazine i, and is decreasing in the
sensitivity of a magazine’s ad demand to its ad rate (if ad demand is very sensitive to ad
rates, then lowering ad rates becomes a cheaper way for magazines to generate additional
advertisers rather than subsidizing readers).
Equilibrium ad rates are determined in a parallel way. They are marked up above cost to
the extent of product differentiation on the advertisers’ side, but are discounted to reflect
the externality generated on the readership side of the market from a magazine attracting
more ads. For both cover prices and ad prices, the markup above cost is higher the higher
the respective equilibrium market shares reflecting the fact that if a magazine is preferred
by readers or advertisers (has a positive value of hi�hj), this will cause that magazine to
price higher to exploit its more dloyalT customer base.
Finally, the equilibrium level of content is increasing in the amount readers value
content and in the total number of magazine readers (since then each page of content
generates more revenue), but is decreasing in the cost of producing content and in the
sensitivity of magazine readers’ demand to the cover price (if readers are very sensitive to
cover prices, then lowering cover prices is a cheaper way for magazines to generate
additional readers rather than producing additional content).
Our estimation approach is to estimate the share Eqs. (2) and (4) so as to obtain
estimates of the parameters c, w, b, q, and g. These can then be used to solve for the
equilibrium price–cost margins (7) and (8), which are the expressions of central interest.
6 We obtain the same result more simply by totally differentiating the demand system (2)– (5) and solving for
the derivatives needed in the first order conditions.
U. Kaiser, J. Wright / Int. J. Ind. Organ. 24 (2006) 1–28 7
This avoids the need to estimate costs through the first order conditions, which leads to
imprecise estimates of all parameters, given the interrelated nature of the two sides of the
market and only limited data availability. This illustrates the value of using the linear
demand specification.
3. Data
Our initial data set comprises of quarterly information on cover prices, ad prices,
number of ad pages,7 number of content pages, and circulation numbers for German
magazines that existed between the first quarter of 1972 and the fourth quarter of 2003.8
The original source of our data is the Informationsgemeinschaft zur Feststellung der
Verbreitung von Werbetragern e.V. This association ascertains, monitors and publishes
information on magazine dissemination and circulation.
We annualize our quarterly data given that cover prices and ad rates do not typically
change within a year. Our identification of markets with just two competing magazines
(dtwo-magazine marketsT), a prerequisite to the estimation of the two-sided singlehoming
model, proceeds in two steps. First, we place each magazine into a unique magazine
segment (or magazine submarket), and then check in what periods between 1972 and
2003 the respective magazine group consisted of just two competing magazines. The
initial magazine grouping follows industry convention. We use the grouping by
Jahreszeitenverlag (1981–2003).9 Jahreszeitenverlag distinguishes between 35 different
magazine groups. We search for two-magazine markets inside these 35 distinct groups and
identify a total of 18 two-magazine markets that existed during our period of observation.
The number of years of existence range between 1 and 31 years.
Table 1 gives an overview of our sample selection. All magazines are published in
German, including those that are originally from foreign countries such as Elle and Vogue.
Magazines also differ substantially from the original foreign version with respect to
content (though not by layout). Since the foreign originals (or other similar foreign
magazines) are difficult to obtain and are typically significantly more expensive, we do not
believe that they impose a competitive constraint on the German equivalents.
Nine out of the 18 two-magazine markets are eliminated because of difficulties in their
definitions or data. Due to missing data for some of the variables, we have to eliminate
dFiction magazinesT. With only observations on 1 year, we are also forced to eliminate
dFitnessT, dYouthT and dRiddlesT magazines, as we first difference the data. We do not
consider dMagazines with special characterT (Neue Revue and Reader’s Digest Das Beste)
since they are completely different magazines. Neue Revue is concerned with the latest
7 For simplicity, we assume ads are all the same size, which we define as done pageT. We do not have any
systematic information about advertising sizes but sampling the magazines in our study revealed that most ads
tended to be of the same size (a single page).8 Our data and software code are available at http://www.ulrichkaiser.com/papers/twosided.html.9 Jahreszeitenverlag is a major German magazine publisher which made its annual publication Funktions–
Analyse: Factbook fur Inhalte und Portraits von Zeitschriften available to us upon request. We have access to the
dFactbooksT from 1981 to 2003.

Table 1
Sample selection
Segment Title 1 Title 2 Period Obs
Begin End
Included magazines
Health Goldene Gesundheit Medizin heute 1977 Q1 1979 Q2 2
Entertaining Bunte Gala 1994 Q2 1999 Q1 4
Photo Color Foto fotoMAGAZIN 1972 Q3 2003 Q4 31
Do-it-yourself SelberMachen Selbst ist der Mann 1979 Q1 2003 Q4 25
Food Essen & Trinken Meine Familie & Ich 1973 Q2 1986 Q3 12
Gardening Flora Mein schoner Garten 1986 Q2 1998 Q1 11
Monthly high priced women’s Madame Vogue 1983 Q1 1988 Q3 5
Weekly counseling women’s Bella Tina 1979 Q3 1983 Q1 3
PC Chip PC Welt 1985 Q2 1993 Q2 7
Excluded magazines
Magazines with special character Neue Revue Readers Digest Das Beste 1972 Q3 1990 Q4 18
Travel Geo Saison Merian 1990 Q1 2003 Q4 14
Young illustrated Max Prinz 1991 Q1 2003 Q4 13
City/lifestyle Tempo Wiener 1986 Q4 1994 Q3 7
Sports Sport Illustrierte kicker-sportmagazin 1972 Q3 1976 Q3 3
Fitness Fit for Fun Vital 1994 Q2 1995 Q4 1
Youth Bravo Musikexpress 1977 Q1 1977 Q4 1
Riddles Extra Ratsel Freizeit Revue 1985 Q1 1986 Q1 1
Fiction Romanwoche Meine Geschichte 1984 Q1 2003 Q4 0
U. Kaiser, J. Wright / Int. J. Ind. Organ. 24 (2006) 1–288
gossip surrounding European celebrities, while Reader’s Digest Das Beste is the German
version of Reader’s Digest. We think a more appropriate label for these magazines is
dmiscellaneousT. For similar reasons we also exclude dTravelT, dSportsT and dYoungillustratedT magazines.10
In total, we are left with only 100 usable observations (91 after first differencing), so the
usual caveats of empirical work with small samples apply. Depending on the year
considered, the 9 two-magazine markets that we include in our estimation make up
between 2.2% and 8.4% of the total number of titles published in the total German
magazine market, between 0.4% and 5.3% of total circulation, and between 1.1% and
5.4% of total ad pages (in the time period 1972–2003).
The two most important groups (in terms of observations) are dDo-It-yourselfTmagazines and dPhotographyT magazines. Together, these account for 56% of our usable
observations. Some summary statistics on the variables involved in the estimation are
given in Table 2. The mean cover price for a magazine in our sample is 2.85 Euros,
whereas advertisers pay on average 10,512 Euros per ad. A magazine in our sample has a
10 Specifically, the dTravelT magazines come in a different periodicity and one magazine (Geo Saison) deals with
a wide array of topics while the other one (Merian) exclusively is concerned with a single travel destination;
kicker-sportmagazin, a dSportsT magazine, exclusively reports about soccer events, while Sport Illustrierte covers
a wide range of sport events; and Prinz, a dYoung illustratedT magazine, comes in 13 different regional editions,
faces significant competition from local newspapers and free city magazines, and has its focus on reporting on
local events, while Max is a regular lifestyle magazine aimed at people below 35.
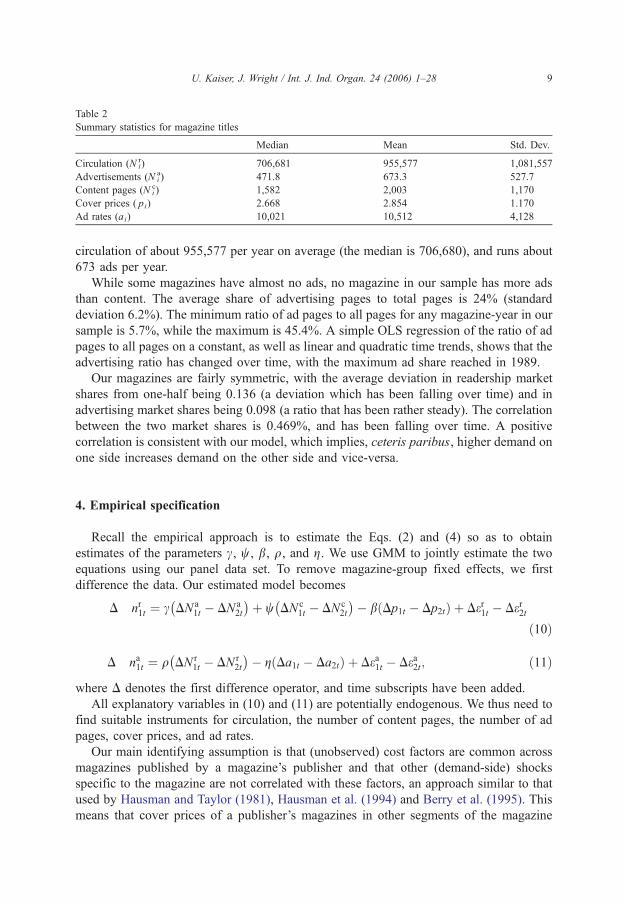
Table 2
Summary statistics for magazine titles
Median Mean Std. Dev.
Circulation (N ri) 706,681 955,577 1,081,557
Advertisements (N ai ) 471.8 673.3 527.7
Content pages (N ci ) 1,582 2,003 1,170
Cover prices ( pi) 2.668 2.854 1.170
Ad rates (ai) 10,021 10,512 4,128
U. Kaiser, J. Wright / Int. J. Ind. Organ. 24 (2006) 1–28 9
circulation of about 955,577 per year on average (the median is 706,680), and runs about
673 ads per year.
While some magazines have almost no ads, no magazine in our sample has more ads
than content. The average share of advertising pages to total pages is 24% (standard
deviation 6.2%). The minimum ratio of ad pages to all pages for any magazine-year in our
sample is 5.7%, while the maximum is 45.4%. A simple OLS regression of the ratio of ad
pages to all pages on a constant, as well as linear and quadratic time trends, shows that the
advertising ratio has changed over time, with the maximum ad share reached in 1989.
Our magazines are fairly symmetric, with the average deviation in readership market
shares from one-half being 0.136 (a deviation which has been falling over time) and in
advertising market shares being 0.098 (a ratio that has been rather steady). The correlation
between the two market shares is 0.469%, and has been falling over time. A positive
correlation is consistent with our model, which implies, ceteris paribus, higher demand on
one side increases demand on the other side and vice-versa.
4. Empirical specification
Recall the empirical approach is to estimate the Eqs. (2) and (4) so as to obtain
estimates of the parameters c, w, b, q, and g. We use GMM to jointly estimate the two
equations using our panel data set. To remove magazine-group fixed effects, we first
difference the data. Our estimated model becomes
D nr1t ¼ c DN a1t � DN a
2t
� �þ w DN c
1t � DN c2t
� �� b Dp1t � Dp2tð Þ þ Der1t � Der2t
ð10Þ
D na1t ¼ q DN r1t � DN r
2t
� �� g Da1t � Da2tð Þ þ Dea1t � Dea2t; ð11Þ
where D denotes the first difference operator, and time subscripts have been added.
All explanatory variables in (10) and (11) are potentially endogenous. We thus need to
find suitable instruments for circulation, the number of content pages, the number of ad
pages, cover prices, and ad rates.
Our main identifying assumption is that (unobserved) cost factors are common across
magazines published by a magazine’s publisher and that other (demand-side) shocks
specific to the magazine are not correlated with these factors, an approach similar to that
used by Hausman and Taylor (1981), Hausman et al. (1994) and Berry et al. (1995). This
means that cover prices of a publisher’s magazines in other segments of the magazine

U. Kaiser, J. Wright / Int. J. Ind. Organ. 24 (2006) 1–2810
market are assumed to be driven by common underlying costs associated with a
publisher’s production, distribution and marketing of its magazines to readers. These costs
also determine the particular magazine’s cover prices, but are assumed to be uncorrelated
with the disturbances in the magazine’s product demand equations, which is why the
average cover price of a publisher’s other magazines can be used as instruments for cover
prices. The same logic applies to the use of the average ad rate of a publisher’s other
magazines as an instrument for a magazine’s ad rate, and the use of the average content
pages per copy of a publisher’s other magazines as an instrument for a magazine’s content
pages per copy.
Additional cost-side instruments for cover prices, ad rates and content pages per copy
are the natural logarithm of the number of magazine titles published by the own publisher
in a given year (a proxy variable for returns to scope in production) and the natural
logarithm of the total number of pages printed by the own publisher in a given year (a
proxy for returns to scale in production).
We also assume common (unobserved) demand factors affect publishers, and that these
factors are uncorrelated with the magazine’s marginal cost shocks. For instance, reflecting
perhaps better management, some publishers at certain times may be better than others at
attracting successful editors, across its whole range of magazines. Successful editors
produce popular content that attracts a larger number of readers. Alternatively, a particular
publisher may have access to a wider distribution channel than other publishers, resulting
in higher demand for all its magazines. This suggests that a reasonable instrument for a
magazine’s circulation share is the average circulation share of the publisher’s other
magazines. Likewise, a similar logic applies to the advertising side. A particular publisher
may form an ongoing relationship with a large advertising client through one of its
magazines, but this will tend to raise demand for advertising in the publisher’s other
magazines, given some large advertisers may place ads across different magazine markets
(dcross-sellingT as it is termed in the media industry). Thus, we use the average advertising
share of a publisher’s other magazines to instrument for the advertising share of a
particular magazine produced by the same publisher. To instrument our explanatory
variables (which are differenced), we use current and lagged values of the instruments.
Additional instruments are a constant, a linear and a quadratic time trend.
Overall, our instruments show a moderate to high correlation with the explanatory
variables. At the same time, the instruments can be formally tested for their statistical
validity by using a test for orthogonality of the instruments with the residuals of the
equations of interest. This test cannot reject orthogonality of the instruments at the usual
significance level.11
5. Results
GMM estimation results for the Eqs. (10) and (11) are displayed in Table 3. Table 4
displays the corresponding non-instrumented seemingly unrelated regression (SUR)
11 The details are available at http://www.ulrichkaiser.com/papers/twosided.html.

Table 3
GMM estimation results from the share equations
Coeff. Std. Err. p-value
Readers value ads (c) 0.1813 0.0259 0.000
Readers value content (w) 0.0317 0.0157 0.044
Competition for readers (b) 0.0685 0.0233 0.003
Advertisers value readers (q) 0.2301 0.0276 0.000
Competition for advertisers (g) 0.0326 0.0080 0.000
For readability, estimated coefficients and standard errors are all multiplied by 1000 except for q where they are
multiplied by 1 million, and for b where they are left unchanged.
U. Kaiser, J. Wright / Int. J. Ind. Organ. 24 (2006) 1–28 11
estimation results. GMM and SUR estimation results differ substantially. For instance,
estimated network effects (measured by c/b and q/g) are several times stronger in the SUR
model than in the corresponding GMM model. Also, the SUR model produces
insignificant estimates of w, b and g, and a negative coefficient on the effect of the
number of content pages on the demand by readers. In contrast, all the coefficients of
interest in the GMM estimation are correctly signed and significant.
5.1. Magazine readership demand
Magazines with more content and more ads attract a greater share of readers, while
those with higher prices attract a smaller share of readers. We use our estimates of these
effects to compare how much readers value content versus ads. For instance, each reader’s
willingness to pay for a 1% increase in content pages per year is (w/b) (Nic/100) Euros.
After multiplying by the number of readers, readers in total are willing to pay 10,671
Euros for an extra 1% of content over a year (the standard error is 3845), and they are
willing to pay 19,286 Euros for an extra 1% of advertisements over a year (the standard
error is 8134).12 Despite the fact it seems readers are willing to pay more for ads than for
content, we cannot reject equality of the two effects (the p-value is 0.258).13
5.2. Magazine advertising demand
Advertising demand depends significantly on both the number of readers (positively)
and ad rates (negatively). Combined, these effects imply advertisers (in total) are willing
to pay 51,380 Euros to be able to reach an extra 1% of readers over a year (the
standard error is 14,981). This is considerably more than the estimated 19,286 Euros
readers are willing to pay in total to be able to read an extra 1% of ads over a year,
12 Standard errors are calculated using the dDeltaT method (e.g. Greene, 2003, Section 5.4.2), which is also used
below for other non-linear functions of parameters.13 A possible reason for why readers may appear to value ads more than content is that our measures of content
and ads are simply page-counts which do not take into account perceived quality differences. To the extent that
there is less variation in the quality of ads across magazines than there is in the quality of content, using page-
counts is a better proxy for ads than it is for content. The downward bias that is introduced as a result may
therefore be greater for w than for c.
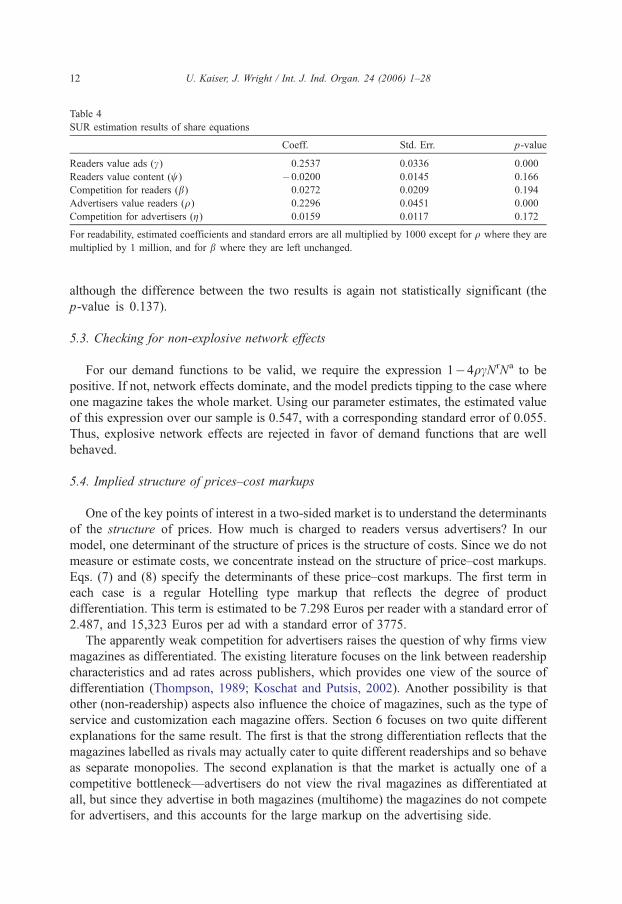
Table 4
SUR estimation results of share equations
Coeff. Std. Err. p-value
Readers value ads (c) 0.2537 0.0336 0.000
Readers value content (w) �0.0200 0.0145 0.166
Competition for readers (b) 0.0272 0.0209 0.194
Advertisers value readers (q) 0.2296 0.0451 0.000
Competition for advertisers (g) 0.0159 0.0117 0.172
For readability, estimated coefficients and standard errors are all multiplied by 1000 except for q where they are
multiplied by 1 million, and for b where they are left unchanged.
U. Kaiser, J. Wright / Int. J. Ind. Organ. 24 (2006) 1–2812
although the difference between the two results is again not statistically significant (the
p-value is 0.137).
5.3. Checking for non-explosive network effects
For our demand functions to be valid, we require the expression 1�4qcNrNa to be
positive. If not, network effects dominate, and the model predicts tipping to the case where
one magazine takes the whole market. Using our parameter estimates, the estimated value
of this expression over our sample is 0.547, with a corresponding standard error of 0.055.
Thus, explosive network effects are rejected in favor of demand functions that are well
behaved.
5.4. Implied structure of prices–cost markups
One of the key points of interest in a two-sided market is to understand the determinants
of the structure of prices. How much is charged to readers versus advertisers? In our
model, one determinant of the structure of prices is the structure of costs. Since we do not
measure or estimate costs, we concentrate instead on the structure of price–cost markups.
Eqs. (7) and (8) specify the determinants of these price–cost markups. The first term in
each case is a regular Hotelling type markup that reflects the degree of product
differentiation. This term is estimated to be 7.298 Euros per reader with a standard error of
2.487, and 15,323 Euros per ad with a standard error of 3775.
The apparently weak competition for advertisers raises the question of why firms view
magazines as differentiated. The existing literature focuses on the link between readership
characteristics and ad rates across publishers, which provides one view of the source of
differentiation (Thompson, 1989; Koschat and Putsis, 2002). Another possibility is that
other (non-readership) aspects also influence the choice of magazines, such as the type of
service and customization each magazine offers. Section 6 focuses on two quite different
explanations for the same result. The first is that the strong differentiation reflects that the
magazines labelled as rivals may actually cater to quite different readerships and so behave
as separate monopolies. The second explanation is that the market is actually one of a
competitive bottleneck—advertisers do not view the rival magazines as differentiated at
all, but since they advertise in both magazines (multihome) the magazines do not compete
for advertisers, and this accounts for the large markup on the advertising side.
U. Kaiser, J. Wright / Int. J. Ind. Organ. 24 (2006) 1–28 13
The additional terms in Eqs. (7) and (8) are the network externality terms that arise from
the two-sided nature of the market. Given positive network effects, magazines will charge
readers less to the extent this attracts more readers, and thereby more demand (and profits)
from advertisers. Similarly, by charging advertisers less, each magazine attempts to attract
more ads so as to attract readers. Our estimates can provide some insight into which effect
is more important.
The estimated network externality term 2qNia/g for the equilibrium cover price equation
has a mean value of 9.497 Euros per reader with a corresponding standard error of 2.769
This measures how much cover prices will rise if advertisers do not value the number of
readers. Given an actual mean cover price of 2.85 Euros, this represents a more than three-
fold increase. The estimated network externality term 2cNir/b for the equilibrium
advertising price equation has a mean value of 5059 Euros with a corresponding standard
error of 2133 Euros. This measures how much equilibrium ad rates will rise if magazine
readers do not value ads. This represents an approximately 50% increase in the ad rate (the
mean ad rate is 10,512 Euros). In percentage terms, the subsidy to readers appears much
more substantial.
5.5. Sources of profit contributions
That magazines receive the bulk of their margins from advertisers is confirmed by
calculating the direct contribution to profits from readers and from advertisers. We
calculate the equilibrium price–cost markup for readers multiplied by the number of
readers: Nir/b–2qNi
aNir/g, which is a measure of the direct contribution to a magazine’s
equilibrium profits from readers. Based on our estimates, the implied value of this
expression is �2,100,830 Euros (the standard error is 4,530,730) per year, so that on
average, magazines in our sample make losses on the reader market. This is in accordance
with other studies on print media markets for Germany, for example Ludwig (2003) and
Wagner (1981). Given the insignificance of our estimate, an alternative way of stating this
result is that we cannot reject the hypothesis that magazines obtain no direct profit
contribution from the readership side.
Compare these results to the direct contribution to a magazine’s profit from advertisers,
which can be calculated as Nia/g�2cNi
rNia/b. The mean estimate over the sample is
6,911,360 Euros (per year) with a standard error of 3,715,350 (the p-value is 0.063), so we
can reject the hypothesis that advertisers make no direct contribution to profits (although
only at the 10% significance level). Based on these point estimates, magazines are more
than compensated for their losses on the reader market by gains on the advertising market.
Of course, readers contribute to profits indirectly by raising demand from advertisers, but
this is why readers are dsubsidizedT in equilibrium.
5.6. Printing and distribution costs
The results above suggest magazines may actually set their cover prices below
cost. In fact, the net effect of the product differentiation markup and the network
externality discount is for magazines to set their cover price at 2.198 Euros below
cost (note, however, the standard error on this estimate is 4.741 so the result is not

U. Kaiser, J. Wright / Int. J. Ind. Organ. 24 (2006) 1–2814
significant at any reasonable level). Using the equilibrium pricing relationship (7) to
back out costs which generate the observed mean cover price implies average costs per
reader of 5.052 Euros (the high standard error in the estimate of the price–cost margin
means we can rationalize considerably lower costs also). According to these results, the
magazines discount cover prices, so as to attract readers, and therefore more lucrative
advertisers.
The view that magazines set cover prices below the cost of printing and distributing
each magazine is consistent with external data reported in Ludwig (1996a,b). In 1992, he
conducted case studies for Die Zeit, a weekly periodical that comes in a newspaper format,
and Der Spiegel, a weekly news magazine. Ludwig (1996a, p. 294) finds that Die Zeit,
which sold at 2.04 Euros, incurred cost for paper and printing of 1.74 Euros and
distribution cost of 0.36 Euros. The cover price of Die Zeit hence did not cover paper,
printing and distribution costs (the difference is 0.06 Euros). In the case of Der Spiegel,
Ludwig (1996b, p. 94) estimates the difference between paper, printing as well as
distribution costs and cover prices is 0.21 Euros.
We also obtained confidential data for one women’s magazine (which we call
magazine X) and one fitness magazine (which we call magazine Y) in Germany. The
data on magazines X and Y were gathered from industry professionals, an affiliate with
a major global advertising agency and an affiliate with a major printing technology
group. We calculate magazine X’s paper and printing cost is 4 Euros per copy so its
cover price of 4 Euros just covers paper and printing but not the costs of distribution
which are included in our variable fi. Magazine Y’s paper and printing cost are 3.6
Euros, which means that magazine Y makes losses from the readership side given a
copy price of 3.3 Euros. Compared to these numbers, which indicate magazines prices
are set close to marginal cost (a plausible rule of thumb for pricing), the difference
between costs and cover prices implied by our point estimates seem too high, an issue
we discuss below.
5.7. Production cost of ads
The net effect of the product differentiation markup and the network externality
discount is for magazines to set their ad rates at 10,264 Euros per ad above cost, with a
corresponding standard error of 5518 Euros. Given actual average ad rates, the backed out
costs implied by this result and (8) are costs of 247 Euros per ad. However, with a standard
error of 5518 Euros in the price–cost margin, a wide range of observed costs can be
consistent with these results.
Although we are unable to obtain actual figures on the costs of producing ads due
to business secrecy issues, our interviews of industry participants suggest that the
actual cost is considerably higher than the point estimate of 247 Euros per ad. Taken
together with the result on the readership side, this finding suggests our model
overstates the impact of two-sidedness on the structure of prices. It seems unlikely
magazines subsidize readers by marking up charges to advertisers to the extent our
estimated model implies. If demand from readers is slightly less price elastic (a slightly
lower value of b) and demand from advertisers is slightly more price elastic (a slightly
higher value of g), we can reconcile our point estimates with industry views, which

U. Kaiser, J. Wright / Int. J. Ind. Organ. 24 (2006) 1–28 15
explains why a wide range of observed costs are (statistically) consistent with our
findings.14
5.8. Content pages production cost
Unlike price–cost margins, we cannot determine the optimal level of content
implied by the fitted model without knowing the content page production costs
parameters di, since according to (9), Nic=wNi
r/(2bdi). However, in order to do
comparative statics on the model, it is useful to solve for the value of di which makes the
value of Nic predicted by the model equal to its (average) counterpart in the data. Thus, we
solve (9) for di=wNir/(2Ni
cb), taking the mean over the sample. The implied level of di is
0.124. The implied value of the marginal production cost of a page of content from the
model is then mci=2diNic=wNi
r/b, which has a mean value (across all observations) of 442
Euros.
It is interesting to compare these cost estimates with direct measures of the magazines’
costs. We were able to obtain cost information on three German magazines—Der Spiegel,
Zeit-Magazin and Stern in Ludwig (2003). Ludwig obtained his data, which refer to 1992,
from case studies. Stern belongs to the group of weekly political magazines and Zeit-
Magazin is the supplement to Die Zeit.
Ludwig (2003, p. 208) reports that the average per copy content page production cost
is 0.96 Euros for Der Spiegel, 0.62 Euros for Zeit-Magazin and 0.75 Euros for Stern.
The average per copy content production cost derived from our model is di(Nic)2/Si.
Using the 1992 data for content pages Nic we obtain the following implied costs for the
three magazines: 0.42 Euros for Der Spiegel, 0.46 Euros for Zeit-Magazin, and 0.39
Euros for Stern. Our estimates are somewhat lower than Ludwig’s. Again, a lower value
of b (less price elastic demand from readers) will help reconcile our results with those of
Ludwig.
5.9. Comparative statics in two-sided markets
Another way to interpret our estimation results is to consider how a shock to a
magazine on one side of the market affects its equilibrium price on the other side of the
market. While an increase in magazine 1’s demand on the reader side will cause it to
charge more to readers, it is not obvious how such a shock will affect its charges to
advertisers. As we will show, in theory, an increase in demand can increase or decrease the
cross-market price, reflecting two opposing effects. We thus use our estimated parameters
to determine which effect dominates.
Given the linear functional forms implied by the Hotelling model, the comparative
static derivatives depend only on the estimated parameters, and di which we set to
0.124 from above (this constant is denoted d). We consider positive demand shocks
on the reader side (h1r) and on the advertising side (h1
a) for magazine 1. Totally
differentiating the system defined by (2)–(5) and (7)–(9) for i =1 and 2, the impact of
14 A higher D will also help lower the implied differentiation between magazines in the eyes of advertisers.

U. Kaiser, J. Wright / Int. J. Ind. Organ. 24 (2006) 1–2816
demand shocks on prices on the opposite side are summarized in the following
comparative static results
da1
dhr1¼ � da2
dhr1¼
2�q � cg
b
�N r
Dð12Þ
dp1
dha1¼ � dp2
dha1¼
2g�c � bq
gþ qw2N r
gd
�N a
bDð13Þ
where
D ¼ 9g � 8bq2N rN a þ 20cqgN rN a þ 8c2g2N rN a
bþ 3w2gN r
bd
� �: ð14Þ
Consider first an exogenous increase in demand by readers for magazine 1. Our main
interest is in what happens to the choice of advertising rates on the other side of the
market. When network effects are assumed away, the answer is nothing. Allowing for
network effects, the theoretical implications for advertising rates of an increase in reader
demand depend on the sign of the expression q�gc/b. A high value of q means that
the exogenous increase in readership demand will translate into a relatively large
increase in advertising demand. As a result, the magazine will want to increase its
advertising rates to exploit this higher demand. We call this the cross-market demand
effect. On the other hand, a high value of gc/b means that when magazine 1 enjoys
higher margins on the reader side of the market (as a result of the exogenous increase in
demand by readers), it will want to cut ad rates since doing so generates a large increase
in advertisers (the g effect), and the increase in advertisers generates a large increase in
the now more profitable readers (the c effect). This effect has to be measured relative to
the level of b, the sensitivity of reader demand to cover prices. If b is high, then it does
not make sense to cut ad prices a lot to generate the extra reader demand, when this
demand can anyway be generated by a small decrease in cover prices. We call this
effect the cross-market subsidy effect, since it captures the incentive for a magazine to
subsidize one side to capture the higher margins on the other (now) more profitable
side.
Our estimated results imply the cross-market demand effect dominates the cross-market
subsidy effect for a shock to reader demand. Magazine 1 does not want to subsidize
advertisers so as to attract a few more readers. Rather, it wants to exploit the larger effect
of higher reader demand on advertising demand by charging advertisers more.15
Consider instead an exogenous increase in demand for advertising in magazine 1.
Whether magazine 1 will respond to the higher advertising demand (and so price) by
raising or lowering cover prices depends on the sign of the expression c� (1�w 2Nr/
bd)(bq/g). If the cross-market demand effect (c) dominates, then higher advertising
15 We find da1/de1r=896.53, so an exogenous increase in magazine 1’s market share of readers from 50% to 55%
will cause it to charge advertisers 44.83 Euros more per ad.

U. Kaiser, J. Wright / Int. J. Ind. Organ. 24 (2006) 1–28 17
demand will increase reader demand sufficiently such that magazine 1 will want to
increase its cover price. If, on the other hand, the cross-market subsidy effect (bq/g)dominates, then higher advertising demand will cause magazine 1 to lower its cover price.
The cross-market subsidy effect is weakened somewhat by the ability of magazine 1 to
attract more readers by producing more content rather than lowering the cover price. This
is measured by the term (1�w2Nr/bd), which reduces the cross-market subsidy effect by
about 23% in our sample. Despite this, we find the cross-market subsidy effect dominates,
so that the magazine will actually decrease its cover price in response to the demand
increase from advertisers (and it will also increase its production of content).16
These results provide another sense in which advertisers care more about the number of
readers than vice-versa. A positive shock to reader demand raises a magazine’s
equilibrium ad rate, whereas a positive shock to advertising demand lowers a magazine’s
cover price.17 These differing responses reflect that, when measured relative to how easy it
is to attract each type of user by adjusting prices, it is easier to attract more advertisers by
subsidizing readers than vice-versa.
5.10. Separate magazine group estimates
Magazine group fixed effects drop out from our estimation equations since we
estimate our model in first differences. However, it seems plausible that the slope
coefficients also differ across magazine groups and so the estimates for each magazine
group may deviate from the results obtained from the pooled estimation. Although we
suspect results will be affected by parameter heterogeneity, with on average only ten
observations per magazine group, it is not feasible to allow slope coefficients to vary
across each group. Instead, here we just provide some evidence on whether parameter
values vary between one of the larger magazine groups and the rest of the magazines.
We conduct such dtestsT with our two largest magazine groups, dPhoto magazinesT anddDo-It-Yourself magazinesT.
Allowing all of the parameters to vary depending on whether magazines are in the
Photo group or not, we cannot reject joint homogeneity of the parameters (the p-value is
0.989). We also cannot reject joint parameter homogeneity in the case of the Do-It-
Yourself magazines (the p-value is 1.000). However, in both cases the precision of the
parameter estimates decreases substantially, possibly reflecting the effect of identifying the
five magazine group specific parameters with only 23 observations (Do-It-Yourself
magazines) and 29 observations (Photo magazines).
To make stronger conclusions, we consider heterogeneity in each of the five
parameters, one at a time. For example, we test whether there are significant differences
in the parameter c by replacing c(DN1ta�DN2t
a) in (10) with c (DN1ta�DN2t
a)+
Dgcg(DN1ta�DN2t
a), where the dummy variable Dg takes on the value 1 if the
corresponding magazine is in magazine group g (either Photo or Do-It-Yourself). The
16 We find dp1/de1a=�1.768, which suggests an increase in advertising market share from 50% to 55% will
cause magazine 1 to charge readers 0.09 Euros less, and to produce an additional 21 content pages.17 An increase in cost on one side of the market increases the magazine’s price, decreasing demand on the same
side. Thus, an increase in cost has the same cross-market effect as the corresponding decrease in demand.

U. Kaiser, J. Wright / Int. J. Ind. Organ. 24 (2006) 1–2818
parameter cg measures the difference in the effect of advertising pages on readership
demand for magazines in group g compared to the rest of the magazines. If the parameter
is statistically significant, we cannot accept parameter homogeneity.
Looking at each of the parameters separately, Do-It-Yourself magazines behave quite
similarly to the rest of the magazines, with the exception of the c parameter which is
significantly lower. The parameter cg is estimated to be �0.0004, and the p-value from a
test that it is zero is 0.026. Calculating c +cg implies we cannot reject the hypothesis that
readers do not value ads at all in Do-It-Yourself magazines ( p-value from this test is
0.189). In contrast, the parameter estimates suggest readers are more sensitive to the
number of ads and content pages in Photo magazines than they are for other magazines (cgis estimated to be 0.0005, and the p-value of a test that it is zero is 0.000; wg is estimated
to be 0.0001, and the p-value of a test that it is zero is 0.012). For Photo magazines, q and
g are also both significantly different from the parameter estimates for other magazines
(the p-values from the test that qg and gg are each zero are 0.001 and 0.000, respectively).
Advertiser’s demand is about twice as sensitive to the number of readers as for other
magazines, but we cannot reject that advertising demand in photo magazines is completely
price inelastic. This evidence suggests parameter heterogeneity is important. Unfortu-
nately, with our limited data set, a more definitive understanding of parameter
heterogeneity across different magazine groups does not seem feasible.
6. Alternative models
The share equations in the benchmark model considered thus far assume all agents
choose one of the magazines exclusively. In reality, some agents will choose neither
magazine and some agents will choose both (multihome). As the appendix shows, our
results still apply in this case if the reason some agents buy both magazines (or neither) are
exogenous to the decisions made by the magazines. On the other hand, where the number
of such agents is endogenous, there may be biases in our results.
To avoid these biases, ideally, we should use a model that allows for some agents on
each side of the market to multihome, and some to drop out, depending on the choice
variables of the magazines. Consider first the case of multihoming. We calculate (in the
appendix) that the proportion of readers that multihome in the magazines we consider is
about 8% while the proportion of advertisers that multihome is around 17%. This suggests
the appropriate model should allow for partial multihoming on each side of the market.
Unfortunately, the combination of two-sided network effects and partial (endogenous)
multihoming on each side of the market makes equilibrium analysis complex. This may
explain why a theoretical model with these features does not currently exist, even though it
is arguably the most relevant case to consider.
Allowing for endogenous participation is more straightforward, but such a model with
competing magazines involves estimating an additional eleven parameters.18 Given a
18 As discussed in Section 6.1, we require six additional parameters to control for the market size on each side of
the market. Allowing for competition on both sides of the market without assuming the market is covered also
requires allowing own and cross effects to differ, which introduces another five parameters to estimate.

U. Kaiser, J. Wright / Int. J. Ind. Organ. 24 (2006) 1–28 19
sample size of just 91 observations, this can explain the instability in results we find from
such an exercise. Specifically, the effect of the number of ads and content pages in a
magazine on the rival magazine’s readership demand has the incorrect sign, and the effect
of the number of readers in a magazine on the rival magazine’s advertising demand is
insignificant. In contrast, cross-price effects are correctly signed, significant, and
somewhat smaller in magnitude than own-price effects.
In this section, we consider two models that provide alternative ways to deal with the
issue of partial market coverage and multihoming. These models correspond to the models
of a monopoly platform and of competitive bottlenecks considered by Armstrong (2005).
In the case of a monopoly platform, each magazine is considered to be a monopoly (here
problems of multihoming do not arise by definition). In the competitive bottleneck
specification, advertisers always advertise in both of two competing magazines (that is,
multihome). In both cases, we control for market size directly by assuming the potential
number of readers is determined by the population for Germany, while the total demand by
advertisers is linked to the GDP for Germany. We also allow for a linear time trend in each
demand equation. The producer price index for newspaper print paper in Germany is
added to our initial list of instruments.19
6.1. Monopoly model
In this section, we consider the possibility each magazine is effectively a separate
monopoly. For the case of monopoly platforms, Armstrong assumes a particular
specification in which utilities are a linear function of the number of users on the other
side of the market as well as price, and that demand from each side is some increasing
function of utility.20
We adopt the exponential function for this increasing function so that demands are log-
linear. That is, using our existing notation, Nir =eu i where ui =hi
r +cNia+wNi
c�bpi+ eir, and
Nia=eki where pi =hi
a+qNir�gai + ei
a. This particular function ensures demands are always
non-negative, and that the equilibrium conditions are comparable to those obtained for the
model of Section 2. Demand functions become
logN ri ¼ hri þ cN a
i þ wN ci � bpi þ eri ð15Þ
logN ai ¼ hai þ qN r
i � gai þ eai : ð16Þ
19 This variable is not relevant to our benchmark Hotelling model, which is entirely in terms of relative prices
and demands.20 Some other recent theoretical models of two-sided markets (Anderson and Coate, in press; Ferrando et al.,
2004; Gabszewicz et al., 2001) use a demand specification in which the demand for advertising only depends on
the ad rate per subscriber, and not the ad rate or the number of readers separately. We could not find any particular
support for this specification relative to the linear specification of utility in any of the models estimated. The non-
linear specification of utility also complicates the expressions for the price-cost margins. This motivates our
choice of using linear utility functions.
U. Kaiser, J. Wright / Int. J. Ind. Organ. 24 (2006) 1–2820
Profit functions remain the same as in (6). Solving for the first order conditions
implies
pi � fi ¼1
b� qN a
i
gð17Þ
ai � ci ¼1
g� cN r
i
bð18Þ
N ci ¼ wN r
i
2bdi: ð19Þ
The empirical specification is obtained by adding time subscripts, taking logs, and
assuming
hri;t ¼ ari þ a1t þ a2logPOPt þ a3logPOP2t
hai;t ¼ aai þ b1t þ b2logGDPt þ b3logGDP2t
to control for potential demand for a magazine, where i is a magazine, t is a time subscript,
POPt is the population of Germany in year t, and GDPt is the gross domestic product in
Germany in year t, in 1985 Euros. Taking first differences to remove the magazine fixed
effect terms ai, the specification we estimate is
DlogN ri;t ¼ cDN a
i;t þ wDN ci;t � bDpi;t þ a1 þ a2DlogPOPt þ a3DlogPOP
2t þ Deri;t
ð20Þ
DlogN ai;t ¼ qDN a
i;t � gDai;t þ b1 þ b2DlogGDPt þ a3DlogGDP2t þ Deai;t: ð21Þ
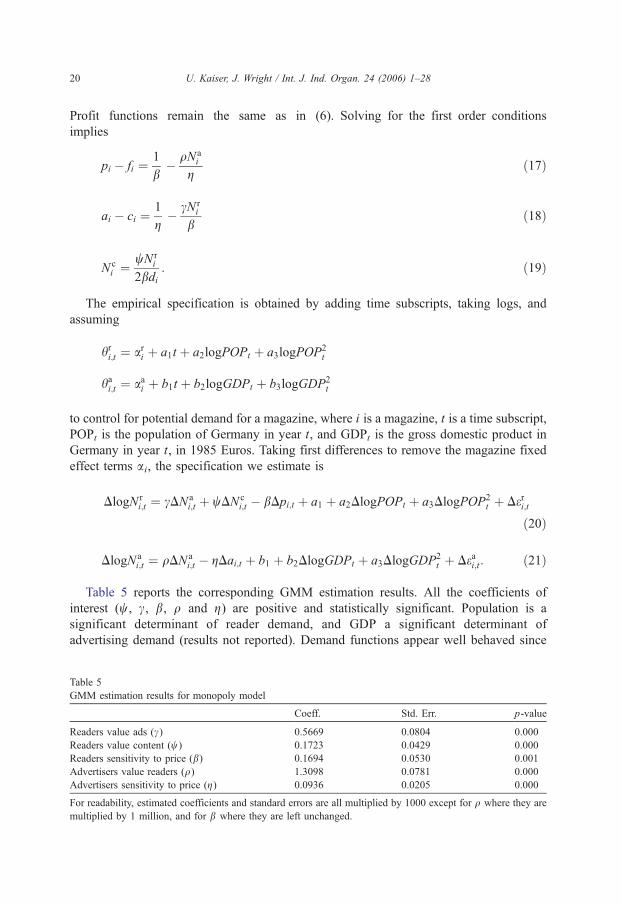
Table 5 reports the corresponding GMM estimation results. All the coefficients of
interest (w, c, b, q and g) are positive and statistically significant. Population is a
significant determinant of reader demand, and GDP a significant determinant of
advertising demand (results not reported). Demand functions appear well behaved since
Table 5
GMM estimation results for monopoly model
Coeff. Std. Err. p-value
Readers value ads (c) 0.5669 0.0804 0.000
Readers value content (w) 0.1723 0.0429 0.000
Readers sensitivity to price (b) 0.1694 0.0530 0.001
Advertisers value readers (q) 1.3098 0.0781 0.000
Advertisers sensitivity to price (g) 0.0936 0.0205 0.000
For readability, estimated coefficients and standard errors are all multiplied by 1000 except for q where they are
multiplied by 1 million, and for b where they are left unchanged.

U. Kaiser, J. Wright / Int. J. Ind. Organ. 24 (2006) 1–28 21
we can reject explosive network effects given 1�qcNirNi
a is positive (it equals 0.459, with
a standard error of 0.079).
Compared with our benchmark results in Section 5, readers’ total willingness to pay for
a 1% increase in ads is somewhat higher than before (it is now 24,385 Euros with a
standard error of 8133), but their willingness to pay for a 1% increase in content is more
than twice as high as before (it is now 23,462 Euros with a standard error of 8519). As a
result, their willingness to pay for content is now very similar to that for ads, and the
difference is certainly not statistically significant (the p-value from a test of equality is
0.915). Advertisers’ willingness to pay for a 1% increase in readers is around twice the
level compared to before (at 101,901 Euros with a standard error of 20,800), which is
now significantly higher than readers’ willingness to pay for a 1% increase in ads (the p-
value from a test of equality is 0.000). That readers value content similarly to ads seems
a more plausible feature of the estimated monopoly model compared to our benchmark
model where the point estimate suggested they value content substantially less. Another
more plausible aspect of the monopoly model is that the backed-out costs per
advertisement are 3032 Euros rather than the implausibly low 247 Euros implied by our
benchmark model. On the other hand, the monopoly model implies magazines set cover
prices 3.513 Euros below cost which implies backed-out costs per reader which are even
higher than before.
We test the monopoly model by examining whether there is evidence of cross-magazine
effects. We find strong evidence of such effects regardless of whether we add cross-
magazine price effects on just one side or both sides of the market, or allow for cross-
magazine effects on all the variables in the utility function (either on one or both sides of
the market). For instance, including b2Dpj,t in (20), the estimate of b2 equals 0.162 with a
standard error of 0.036. Including g2Dai,t in (21) as well, the estimates of b2 and g2 areboth highly significant, while all the other coefficients retain their correct sign (and
significance). As expected, the cross-price effects b2 and g2 are somewhat lower than
own-price effects b and g. However, expanding the model to include the cross effects of
the other terms in (15) and (16) leads to estimates of w2 and c2 which have the incorrect
sign, and of q2 which is insignificant. This may reflect the inability to reliably estimate 16
parameters with just 91 observations, or to appropriately control for market size. In
comparison, the two-sided singlehoming model, which imposes stronger assumptions,
only requires the estimation of five parameters.
6.2. Competitive bottleneck model
The last model we consider assumes magazines compete on the reader side, but act as
monopolists on the advertising side. Following Armstrong (2005), the demand by firms
for advertising in magazine i is some increasing function of the number of readers of
magazine i and decreasing in the ad rate of magazine i. Specifically, the firm’s decision
to advertise on magazine i does not depend on whether it chooses to advertise on the
rival magazine. This reflects the fact that the firm can advertise on both magazines
(multihome), and so it will advertise on each magazine whenever doing so is profitable.
Compared to the monopoly model above, the only difference in specification is that
readers demand now depends on the difference in utility across the two rival magazines.

U. Kaiser, J. Wright / Int. J. Ind. Organ. 24 (2006) 1–2822
Adopting the identical functional forms to the monopoly case, and taking logs, demand
functions become
logN r1 ¼ hr1 þ c N a
1 � N a2
� �þ w N c
1 � N c2
� �� b p1 � p2ð Þ þ er1 � er2 ð22Þ
logN r2 ¼ hr2 þ c N a
2 � N a1
� �þ w N c
2 � N c1
� �� b p2 � p1ð Þ þ er2 � er1 ð23Þ
logN a1 ¼ ha1 þ qN r
1 � ga1 þ ea1 ð24Þ
logN a2 ¼ ha2 þ qN r
2 � ga2 þ ea2: ð25Þ
Given the same profit functions for magazines, solving for the first order conditions
implies the following equilibrium conditions
pi � fi ¼1
b� qN a
i
g�
cqN rj N
aj
bð26Þ
ai � ci ¼1
g� cN r
i
bð27Þ
N ci ¼ wN r
i
2bdi: ð28Þ
While the determination of the ad rate is identical to the case of monopoly magazines,
the pricing to readers is lower relative to the monopoly price by the term cqNjrNj
a/b,reflecting the effect of competition for readers. The empirical specification is obtained in
the same way as in the monopoly case, with the specification of the h terms being identical.
Table 6 reports the corresponding results. With the exception of the coefficient on
content, the coefficient estimates are qualitatively the same as the monopoly and two-
sided singlehoming models, all being of the correct sign and statistically significant. The
test for well-behaved demand functions is that the expression 1�cqSiNia�cqSjNj
a is
positive. We find the expression equals 0.6118 with a standard error of 0.0213,
indicating network effects are not explosive. Since demands have the same log-linear
form as the monopoly model, the results can be directly compared across the two
models. Most estimates are broadly similar, except the coefficient on how much readers
Table 6
GMM estimation results for competitive bottleneck model
Coeff. Std. Err. p-value
Readers value ads (c) 0.4586 0.0152 0.000
Readers value content (w) 0.0021 0.0067 0.758
Price competition for readers (b) 0.1645 0.0201 0.000
Advertisers value readers (q) 1.1162 0.0488 0.000
Advertisers sensitivity to price (g) 0.1074 0.0097 0.000
For readability, estimated coefficients and standard errors are all multiplied by 1000 except for q where they are
multiplied by 1 million, and for b where they are left unchanged.

U. Kaiser, J. Wright / Int. J. Ind. Organ. 24 (2006) 1–28 23
value content (w) which is now close to zero and not at all significant (the p-value from
a test that it is zero is 0.758). Not surprisingly, this also implies that readers value ads
significantly more than content, a result that seems implausible (the p-value from a test
that they value ads and content the same is 0.000).
To test the validity of this competitive bottleneck model, we test it against a model in
which competition is added to the advertising side. Regardless of whether we just add the
rival magazine’s ad price, or also allow for the effect of the number of readers on the rival
magazine, we find strong evidence that competition matters. For instance, including
g2Da2,t in (24) and g2Da1,t in (25), the estimate of g2 is only about 30% smaller than the
estimate of g1 and still highly significant. Including the cross-price effect in the advertisingdemand equation also substantially increases the estimated value that readers place on
content. The estimate of w is now marginally significant (at the 10% level). These results
suggest the competitive bottleneck framework does not provide a good fit for magazine
markets in Germany. This is perhaps not surprising given the average proportion of
advertisers that multihome in our sample is estimated to be around 17%, compared to the
100% predicted by the competitive bottleneck model.
7. Conclusions
In this paper, we obtained estimates of the parameters of a two-sided market model of
competing magazine publishers. Using panel data from the German magazine industry
between 1972 and 2003, we find non-explosive network benefits, so that the estimated
demand system is well behaved. We ask, what is the markup charged to advertisers relative
to that charged to readers? Our results are consistent with the conventional wisdom that
advertisers value readers more than readers value advertisements, and that as a result,
magazines dsubsidizeT cover prices, and make their profit from advertisers.
We apply this estimated model to consider cross-market comparative statics. Reflecting
the fact advertisers value readers more than readers value advertisements, we find that an
increase in reader demand results in an increase in ad rates while an increase in advertising
demand results in a decrease in cover prices. This asymmetric result reflects the incentive
to subsidize readers to attract additional advertisers when the advertising side becomes
more lucrative, but not vice-versa. Rather, if demand on the reader side increases (or costs
fall), our estimated model implies magazines will want to increase ad rates to exploit the
resulting increased demand on the advertising side.
One surprising finding is that even though we selected pairs of magazines that are
broadly similar, the magazines seem to set high ad rates as though they are highly
differentiated in the eyes of advertisers. A possible explanation for this is that the
magazines selected actually serve quite different readership markets. Interestingly, a model
of monopoly magazines performs at least as well as our benchmark model in capturing
two-sidedness. However, a difficulty for the monopoly model is that cross-price effects are
found to be significant. Cross-price effects are also a problem for the competitive
bottleneck model, in which magazines compete for readers but not for advertisers (who all
multihome). Demand for advertising in each magazine is found to be sensitive to the rival
magazine’s ad rate. Moreover, in our sample, the average proportion of advertisers that

U. Kaiser, J. Wright / Int. J. Ind. Organ. 24 (2006) 1–2824
multihome is only around 17%. Alternatively, the high markups sustained by magazines
on the advertising side of the business may reflect some form of differentiation, collusion
or other friction in the market for advertisers.
Given the limited data used in this study, we treat our results as illustrative. The
approach used shows how one can draw conclusions on the role of network effects in
determining the structure of pricing in studying two-sided markets. It also illustrates the
interesting way cross-market comparative statics can work in two-sided markets. Future
work could explore similar issues based on a more extensive data set of magazines. One
approach worth considering is to use a more comprehensive data set on specific magazines
segments, where magazine segments in different countries, regions or languages can be
considered to have different demands and costs, and for which the demand from each side
of the market (advertising versus readership) should depend on country/region specific
factors that can be observed.
Acknowledgements
We would like to thank Hans Christian Kongsted, Armin Schmutzler, Christian Schultz,
and Rainer Winkelmann, as well as other seminar participants from the University of
Copenhagen, the University of Zurich and the 2004 meeting of the German Economic
Association for their helpful suggestions. We are particularly grateful for the very helpful
comments we received from two anonymous referees, and our editor Igal Hendel.
Appendix A. Multihoming
In this appendix, we show how the two-sided singlehoming model can be extended in a
way that allows some people to read two (rival) magazines and some firms to put the same
ad in two (rival) magazines. Following the literature on two-sided markets, we call this
situation bmultihomingQ. To do this, we assume that agents’ choice of whether to
singlehome or multihome is independent of the magazine’s decision variables. Under this
assumption, we show our existing results apply even in the presence of multihoming. This
appendix also provides some evidence of the extent of multihoming on each side of the
market in our sample.
The extension of our model follows Doganoglu and Wright (2006). They allow for
partial multihoming in a generic model by allowing for two types of agents on each side—
those with a high network benefit parameter who always choose to multihome and those
with a low network benefit parameter who always choose a single platform (singlehome).
In the context of our model, we define the proportion of high-types on the reader side as kr
and the proportion of high-types on the advertiser side as ka. If there are R1 readers who
buy magazine 1 exclusively, R2 readers who buy magazine exclusively, and RM who buy
both magazines, then kr =RM/(R1+R2+RM). Likewise, ka=AM/(A1+A2+AM) where A
denotes the number of advertisers. Using our earlier notation, the total number of readers
of magazine i can then be written as Nir =Ri +RM, and likewise for advertisers,
Nia=Ai+AM. Then Nr=N1
r+N2r=R1+R2+2RM and Na=N1
a+N2a=A1+A2+2AM.

U. Kaiser, J. Wright / Int. J. Ind. Organ. 24 (2006) 1–28 25
Denoting the market shares of magazine 1 for low type readers and advertisers as l1r
and l1a, respectively, the previous market share Eqs. (2)–(5) still apply as before to these
types of agents. The inclusion (or not) of multihoming agents is irrelevant to the low types’
decision of which magazine to choose, since users get the benefit of these multihoming
agents regardless of which magazine they choose. However, the left hand side share terms
in these equations now only apply for low types (which we do not observe directly), so
these have to be rewritten in terms of observables. For instance, on the readership side we
use the observed value of n1r=N1
r/(N1r+N2
r) in the estimation of (2), but the market share
implied by the theory is now l1r=R1/(R1+R2). Using the definitions of kr and Ni
r above, we
can rewrite l1r in terms of observables (and likewise for l1
a) so that lir = ((1+kr) ni
r�kr)/
(1�kr) and lia= ((1+ka)ni
a�ka)/(1�ka), which when substituted into the share Eqs. (2)–
(5) yield
nr1¼1
2þ 1� kr
1þ kr
� �hr1�hr2 þ c N a
1 � N a2
� �þw N c
1 � N c2
� �� b p1 � p2ð Þ þ er1 � er2
� �
ð29Þ
nr2 ¼ 1� nr1 ð30Þ
na1 ¼1
2þ 1� ka
1þ ka
� �ha1 � ha2 þ q N r
1 � N r2
� �� g a1 � a2ð Þ þ ea1 � ea2
� �ð31Þ
na2 ¼ 1� na1: ð32Þ
After taking first differences, the implied demand system becomes statistically
identical to that in (10) and (11). Assuming that magazines cannot set different prices
depending on whether agents singlehome or multihome, the profit function for each
magazine is identical to that in (6), where Nir =ni
rNr and nir is now defined in (29), and
where Nia=ni
aNa and nia is now defined in (31). Since the estimated demand system is the
same as before, all our implied results using the first order conditions (7)–(9) still apply.
The only difference arises from the interpretation of the underlying parameters, which if
calculated by using the adjustment terms above, apply to the utility functions for low type
agents on each side of the market. (By construction, high types will have higher values of
c and q than low types, but the same values of w, b, and g.)To give some idea of how many agents multihome, we calculate values for kr and
ka, the proportion of readers who multihome and the proportion of advertisers who
multihome. Unfortunately, we do not have systematic information on multihoming for
all magazines or all years in our sample. Instead, we collected information on
multihoming from two sources. On the reader side, we have consumer survey data for
most of the magazines in our sample from 1997 to 2003. On the advertisers’ side, we
purchased all available magazines in our sample published in September 2004 and
counted duplicated ads.

Table 7
Multihoming percentages for readers
Group 1997 1998 1999 2000 2001 2002 2003 Average share
multireader
Health 3.56 n.a. n.a. n.a. n.a. n.a. n.a. 3.56
Entertaining 2.64 3.53 3.55 5.04 6.23 5.73 5.54 4.61
Photo n.a. n.a. n.a. n.a. n.a. n.a. n.a. n.a.
Do-it-yourself 11.08 11.98 11.11 7.81 10.47 9.25 7.49 9.88
Food 6.38 5.82 5.53 4.29 6.66 5.21 3.88 5.40
Gardening 4.43 6.16 5.35 5.12 5.35 5.20 3.45 5.01
Monthly high priced women’s 6.38 6.78 5.80 6.38 5.21 6.56 4.86 6.00
Weekly counseling women’s 11.40 11.73 10.73 11.11 11.62 9.65 8.48 10.67
PC 16.53 n.a. n.a. n.a. n.a. 9.49 11.50 12.51
U. Kaiser, J. Wright / Int. J. Ind. Organ. 24 (2006) 1–2826
Information on multiple readership of magazines from the same magazine group is
taken from AG.MA, as described in Section 3. The original source of the AG.MA data is
a consumer survey that is biannually collected by the bInstitut fur Demoskopie,
AllensbachQ. Around 20,000 interviews are conducted annually in Germany. This data
contains information on what fraction of magazine 1’s readers also read the next available
issue of magazine 2 (and vice-versa).21 If we define the fraction of readers of magazine i
who also read magazine j as ki,j, so ki,j =RM/(Ri +RM), then kr can be calculated from the
observed ki,j ratios by taking the inverse of 1/ki,j +1/kj,i�1. The results, reported in Table
7, indicate multihoming on the reader-side is typically in the 5–10% range. Taking the
weighted average value from Table 7, using the number of observations on each magazine
group as the weights, implies kr=0.0786.
To obtain a measure of the degree of multihoming amongst advertisers, we analyzed
magazines in our sample for issues published in September 2004 by purchasing all
available magazines in our sample on September 8, 2004. Magazines from the same
magazine group were published either the same day (in the case of weekly magazines) or
the same month (in the case of monthly magazines). Only Goldene Gesundheit was
unavailable as it exited the market in June 1997.
Counting ads within each two-magazine group that appear in both magazines
simultaneously, and dividing by the total number of distinct ads within the group, we
obtain multihoming percentages of 10.29% for dEntertainingT, 14.29% for dPhotoT,16.66% for dDo-it-yourselfT, 17.95% for dFoodT, 15.00% for dGardeningT, 10.63% for
dMonthly high priced women’sT, 37.21% for dWeekly counseling women’sT, and 30.16%
for dPCT. These numbers indicate a higher degree of multihoming on the advertising side
than the reader side. Taking the weighted average value, using the number of
observations on each magazine group as the weights, implies ka=0.169.The presence of multihoming agents implies our estimated parameters understate the true
magnitude of parameters in the agents’ utility functions. The above results give an idea of
21 This measure may overstate the level of multihoming for two reasons. First, people may be more likely to
read, say, Madame one month and Vogue the next, than to read both magazines in the same month. It also seems
likely that the degree of multihoming will be higher in readership than in actual purchase.

U. Kaiser, J. Wright / Int. J. Ind. Organ. 24 (2006) 1–28 27
howmuch parameter estimates need to be scaled up on each side. Specifically, the estimated
parameters c, w and b in Table 3 should be multiplied by 1.171 to get the parameter values
which apply to the singlehoming readers. Likewise, the estimated parameters q and g in
Table 3 should be multiplied by 1.407 to get the parameter values which apply to the
singlehoming advertisers. However, none of our implied results are affected by this scaling
since they are based on the estimated demand system, which remains valid under the
assumptions of this model of multihoming.
References
Anderson, S., Coate, S., in press. Market provision of public goods: the case of broadcasting. Review of
Economic Studies.
Armstrong, M., 2005. Competition in two-sided markets, mimeo. University College London.
Berry, S., Levinsohn, J., Pakes, A., 1995. Automobile prices in market equilibrium. Econometrica 63,
841–890.
Bucklin, R.E., Caves, R., Lo, A.W., 1989. Games of survival in the US newspaper industry. Applied Economics
21, 631–649.
Caillaud, B., Jullien, B., 2003. Chicken and egg: competition among intermediation service providers. Rand
Journal of Economics 34, 309–328.
Dertouzos, J.N., Trautman, W.B., 1990. Economic effects of media concentration: estimates from a model of the
newspaper firm. Journal of Industrial Economics 39, 1–14.
Dewenter, R., 2003. The Economics of Media Markets, University of the Federal Armed Forces Hamburg.
Discussion Paper No. 10.
Doganoglu, T., Wright, J., 2006. Multihoming and compatibility, mimeo. National University of Singapore.
International Journal of Industrial Organization 24, 45–67.
Evans, D., 2003a. The antitrust economics of multi-sided platform markets. Yale Journal on Regulation 20,
352–382.
Evans, D., 2003b. Some empirical aspects of multi-sided platform industries. Review of Network Economics 2,
1–20.
Ferrando, J., Gabszewics, J.J., Laussel, D., Sonnac, N., 2004. Two–sided network effects and competition: an
application to media industries, Universite de Louvain working paper.
Gabszewicz, J.J., Laussel, D., Sonnac, N., 2001. Press advertising and the ascent of the dPensee uniqueT.European Economic Review 45, 645–651.
Gandal, N., Kende, M., Rob, R., 2000. The dynamics of technological adoption in hardware/software systems: the
case of compact disk players. Rand Journal of Economics 31 (1), 43–61.
Greene, W., 2003. Econometric Analysis, 4th international edition. Prentice–Hall, Upper Saddle River.
Hausman, J., Taylor, W., 1981. Panel and unobservable individual effects. Econometrica 49, 1377–1398.
Hausman, J., Leonard, G., Zona, J.D., 1994. Competitive analysis with differentiated products. Annales
d’Economie et de Statistique 34, 159–180.
Jahreszeitenverlag, 1981–2003. Funktions–Analyse: Factbook fur Inhalte und Portaits vvon Zeitschriften.
Jahreszeitenverlag, Hamburg.
Kaiser, U., 2003. The effects of website provision on the demand for German women’s magazines. University of
Southern Denmark mimeo.
Koschat, M., Putsis, W., 2002. Audience characteristics and bundling: a hedonic analysis of magazine advertising
rates. Journal of Marketing Research 39 (3), 262–273.
Ludwig, J., 1996a. Wie sich publizistische Hochkultur drechnetT: Ein Okonomisches Portraitt der dZeitT.Publizistik 41, 277–297.
Ludwig, J., 1996b. Kosten, Preise und Gewinne, Zur Betriebswirtschaft von Medienunternehmen: Das Beispiel
dDer SpiegelT. In: Altmeppen, K.-D. (Ed.), Okonomie der Medien und des Mediensystems. Deutscher Verlag,
Opladen.
Ludwig, J., 2003. Mikrookonomie der Medien. In: Altmeppen, K.-D., Karmasin, M. (Eds.), Grundlagen der
Medienokonomie: Kommunikations– undMedienwissenschaft. Westdeutscher Verlag, Opladen, pp. 187–214.

U. Kaiser, J. Wright / Int. J. Ind. Organ. 24 (2006) 1–2828
Reddaway, W.B., 1963. The economics of newspapers. Economic Journal 73, 201–218.
Rochet, J.-C., Tirole, J., 2003. Platform competition in two-sided markets. Journal of the European Economics
Association 1, 990–1029.
Rochet, J.-C., Tirole, J., 2004. Defining Two-Sided Markets, mimeo, IDEI and GREMAQ, Toulouse.
Rosse, J.N., 1967. Daily newspapers, monopolistic competition, and economies of scale. American Economic
Review 57 (2), 522–533.
Rosse, J.N., 1970. Estimating cost function parameters without using cost data: illustrated methodology.
Econometrica 38 (2), 256–275.
Rysman, M., 2004. Competition between networks: a study of the market for yellow pages. Review of Economic
Studies 71 (2), 483–512.
Saloner, G., Shepard, A., 1995. Adoption of Technologies with network effects: an empirical examination of the
adoption of Automated Teller Machines. Rand Journal of Economics 26, 479–501.
Thompson, R.S., 1984. Structure and conduct in local advertising markets: the case of Irish newspapers. Journal
of Industrial Economics 33 (2), 241–249.
Thompson, R.S., 1989. Circulation versus advertiser appeal in the newspaper industry: an empirical investigation.
Journal of Industrial Economics 37 (3), 259–271.
Wagner, K., 1981. The newspaper industry in Britain, Germany and the United States. National Institute
Economic Review 95, 81–88.