pricewaterhousecoopers zhong tian llp …telecommunications, media and technology (tmt) report...
TRANSCRIPT

www.pwccn.comwww.pwc.com/globalmoneytree
PricewaterhouseCoopers Zhong Tian LLP
MoneyTreeTM China TMT ReportQ1/Q2 2016 Data source: Zero2IPO Research
This MoneyTreeTM China Telecommunications, Media and Technology (TMT) Report includes information on private equity and venture capital (PE/VC) investment in the TMT industry for Q1/Q2 2016, as well as 2015, 2014, and Q3/Q4 2013.


Table of contents
1. Overview 4
2. PE/VC investments in the TMT industry 5
TMT industry investments compared with all industries 5
Investments by quarter 7
Investments by sector 8
First-time funding compared with follow-on funding 11
Investments by stage of development 13
Investments by region 16
3. PE/VC exits in the TMT industry 17
Exits by quarter 17
Exits by type 18
Exits by sector 20
4. Sector focus: Technology, Internet, and Telecommunications and Mobile
21
Investments in Technology 21
Investments in Internet 27
Investments in Telecommunications and Mobile 33
5. A close look at investments in Mobile 37
6. Methodology and definitions 40
7. Contacts 42

4 MoneyTreeTM China TMT Report Q1/Q2 2016
In the first half (H1) of 2016, private equity and venture capital (PE/VC) investment in the Telecommunications, Media and Technology (TMT) industry maintained the strong momentum of 2015, and remained on an upward trajectory. In H1 2016, total TMT deal value surpassed all other industries, accounting for over 50% of overall industry value. The proportion of total deal volume in H1 2016 matched that recorded in H2 2015. Actual deal volume decreased slightly, but remained high compared to recent years.
During the winter of 2015, investments in the TMT industry were unexpectedly active and the trend continued in H1 2016. In Q2 2016, total deal value exceeded US$20 billion for the first time, with an increase of 44% quarter over quarter (QoQ). The trend is closely related to a higher frequency of substantial investments in unicorns, and buoyed by strategic investors making investments in order to occupy stronger positions in the market. Also of note, in H1 2016, there were more than 20 investments that had a single-deal value of over US$100 million, with several of these involving an investment value above US$1 billion.
In H1 2016, the Internet continued to be the best performing TMT sector, with the highest deal volume and value. Both the Technology and the Telecommunications and Mobile sectors had investments with single-deal value of over US$1 billion. In light of the major investments, the performance of the Entertainment and Media sector was comparatively modest. Investments in TMT during H1 2016 tended to be concentrated in Internet Finance, E-commerce and Mobile Services, each of which pertain to smart, modern lifestyles.
1. OverviewWith the resumption of IPOs, the number of IPOs increased gradually, though the proportion didn’t exceed strategic sales, which proved to be the most popular type of exit in H1. The proportion of strategic sales in H1 2016 exceeded 60%, an increase of approximately 16% from the prior period, and representing the highest level reached by that category of exit since 2012. Regarding exit by sector, Entertainment and Media stood out in particular in H1 2016, having reached the highest number recorded since 2012, and exceeding the Technology sector for the first time.
As a whole, in H1, TMT stood out as a leading industry in the market, playing a notable role underpinning the technological progress characteristic of modern societies. This report brings you the details of the PE/VC investments and exits in the TMT industry and its three major sectors, serving as a tool that lets you follow the key trends and trajectories shaping TMT industry investments. We would welcome the opportunity to discuss the implications of this report with you, and encourage you to connect with us with any queries you have.
Wilson ChowPwC China & Hong Kong TMT Leader
Jianbin GaoPwC China TMT Leader

5MoneyTreeTM China TMT Report Q1/Q2 2016
TMT industry investments compared with all industries
2. PE/VC investments in the TMTindustry
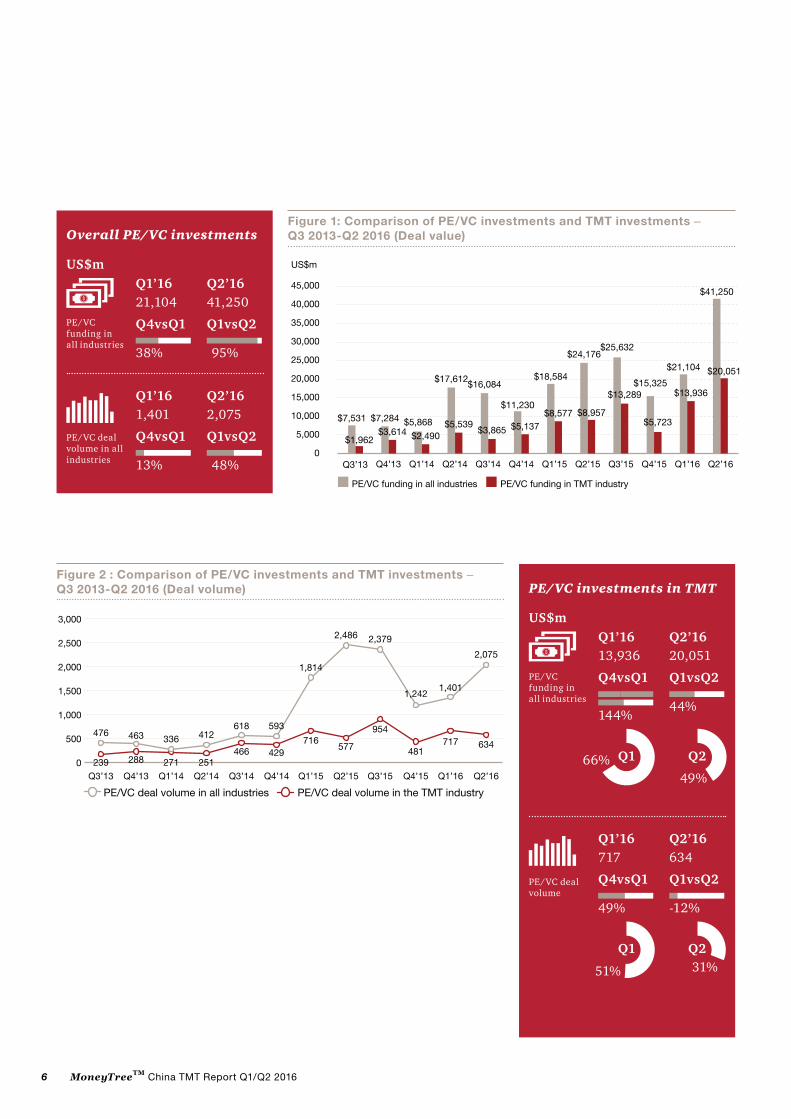
In H1 2016, overall PE/VC investments defied expectations by maintaining high growth. In Q2 2016, total deal value exceeded US$40 billion for the first time, an increase of almost 100% from Q1 2016. The trend closely relates to the frequent occurrence of huge investments in unicorn companies. Strategic investors made investments to occupy positions in the market. The TMT industry attracted over 50% of the total deal value in H1 2016, while Q2 total deal value exceeded US$20 billion for the first time, indicating just how hot the industry has been compared with others over the period.
PwC Viewpoints
Total industry investment in H1 2016 remained positive, continuing the upward trend of H2 2015. Total TMT deal value and volume accounted for 55% and 39% of overall industry investment, respectively.
Main findings:
1. In Q1 2016, the proportion oftotal deal value in the TMTindustry to overall industryinvestment reached ahistorical high since recordsstarted in 2012, reaching66%.
2. In Q2 2016, total deal value inthe TMT industry also reacheda historical high, exceedingUS$20 billion for the firsttime.
6 MoneyTreeTM China TMT Report Q1/Q2 2016
Figure 1: Comparison of PE/VC investments and TMT investments ‒ Q3 2013-Q2 2016 (Deal value)
Q4’13 Q1’14 Q2’14 Q3’14 Q4’14 Q1’15 Q2’15 Q3’15 Q4’15 Q1’16 Q2’16Q3’13
45,000
40,000
35,000
30,000
25,000
20,000
15,000
10,000
5,000
0
$7,531
$1,962
$25,632
$15,325
$24,176$21,104 $20,051
$41,250
$13,936
$18,584
$5,723$8,957$8,577
$11,230
$16,084$17,612
$5,868$7,284
$3,614 $2,490$5,539
$3,865 $5,137
$13,289
US$m
PE/VC funding in all industries PE/VC funding in TMT industry
Figure 2 : Comparison of PE/VC investments and TMT investments – Q3 2013-Q2 2016 (Deal volume)
3,000
2,500
2,000
1,500
1,000
500
0Q4’13 Q1’14 Q2’14 Q3’14 Q4’14 Q1’15 Q2’15 Q3’15 Q4’15 Q1’16 Q2’16Q3’13
476 463 336 412618
1,814
2,486 2,379
1,2421,401
2,075
481717 634
954
577716
429466251271288239
593
PE/VC deal volume in all industries PE/VC deal volume in the TMT industry
Overall PE/VC investments
PE/VC funding in all industries
PE/VC deal volume in all industries
Q1’1621,104
Q1’161,401
Q4vsQ1
Q4vsQ1
Q1vsQ2
Q1vsQ2
38%
13%
95%
48%
US$mQ2’1641,250
Q2’162,075
PE/VC investments in TMT
Q1’1613,936
Q1’16717
Q4vsQ1
Q4vsQ1
Q1vsQ2
Q1vsQ2
144%
49%
44%
49%
31%
66%
51%
-12%
US$mQ2’1620,051
Q2
Q2Q1
Q1
Q2’16634
PE/VC funding in all industries
PE/VC deal volume

7MoneyTreeTM China TMT Report Q1/Q2 2016
Investments by quarter
In Q1, deal value and volume rose continuously
In Q1, both the deal value and volume rose notably compared to the previous quarter, and the single-average-deal value increased by 89% compared to Q4 2015. There were 22 deals with investments that had a single-deal value of over US$100 million, twice as many as the previous quarter. The highest single-deal value amounted to US$3.3 billion.
In Q2, both the total deal value and the highest single-deal value set a new historical record
In Q2, deal value in the TMT industry broke the historical record, and was higher than the total deal value in H2 2015, maintaining the momentum. Single-average-deal value increased by 60% compared to the previous quarter. In Q2, there were 23 deals with investments that had a single-deal value over US$100 million. The highest single-deal value amounted to US$4.5 billion, which was also the highest since 2012.
In H1 2016, average deal value in the TMT industry increased from over US$4 million to US$36 million. The 800% rise indicates that investors have paid increasing attention to the TMT industry. In H1 2016, there were more than 20 investments with a single-deal value of over US$100 million. Further, the level of investment value escalated, with many deals seeing an investment value of over US$1 billion. Both the scale and range of investments gradually increased as unicorn companies emerged and newly-established companies developed into more mature companies.
In H1 2016, the core investment sectors in the TMT industry were predominantly in Internet Finance, E-commerce and Mobile Services, each being closely linked to smart, modern lifestyles. Notably, the majority of large investments were additional investments in companies with high valuations, rather than investments in emerging enterprises, reflecting investors’ prudence. We expect to see a continuation of large investments.
PwC Viewpoints
Figure 4: Volume of TMT investments with single value over US$100 million by quarter – Q3 2013-Q2 2016
25
20
15
10
5
0
Q4’13 Q1’14 Q2’14 Q3’14 Q4’14 Q1’15 Q2’15 Q3’15 Q4’15 Q1’16 Q2’16Q3’13
3
97
11
1920 21
2223
11
7
9
Figure 3: TMT investments by quarter ‒ Q3 2013-Q2 2016 (Deal volume/Deal value)
25,000
20,000
15,000
10,000
5,000
0
1,200
1,000
800
600
400
200
0
Q4’13 Q1’14 Q2’14 Q3’14 Q4’14 Q1’15 Q2’15 Q3’15 Q4’15 Q1’16 Q2’16Q3’13
$1,962$3,614
$2,490
$5,539
$3,865$5,137
$8,577 $8,957
$13,289
$13,936
$20,051
$5,723251239288 271
466429
716
954
481
717
634577
Deal value Deal volume
US$m

8 MoneyTreeTM China TMT Report Q1/Q2 2016
Investments by sector
The TMT industry sectors are: Technology, Internet, Telecommunications and Mobile, and Entertainment and Media.
Internet: The Internet was the hottest investment sector in the TMT industry over H1 2016, with total deal value above US$20 billion, an increase of 140% compared to H2 2015. The deal volume saw little change, indicating that there was a significant increase in single-deal value in the Internet sector over the period. There were 32 investments with a single-deal value over US$100 million. There was also gradual growth in the number of huge deals, including five deals that had a single-deal value exceeding US$1 billion.
Technology: Deal volume for Technology ranked second, only behind the Internet, although investment value for Technology was lower than Telecommunications and Mobile. Deal volume saw a slight slump QoQ, but investment value achieved a historical record by exceeding US$3 billion in Q2. The boost in sector value was aided by an investment of US$2.4 billion in an Electronics & Optoelectronics Devices company, which had a sizable impact on the overall investment scenario of Technology for the period.
Telecommunications and Mobile: This sector’s historically high deal value ranked second in the industry, positioned just after the top placed Internet sector. Deal volume was higher than the Technology sector. Investment volume saw little fluctuations from quarter to quarter, however, deal value witnessed more variations. Investment value in Q2 increased by 523% QoQ, as a consequence of a sizable investment of US$4.5 billion in a mobile service company in Q2.
Entertainment and Media: Investment remained stable in H1 2016 compared to H2 2015. Investments in 67 deals were made in Q2, the most since 2012.
In H1 2016, total deal value in the TMT industry was boosted by huge investments in a number of large Unicorn companies with enterprise value above US$1 billion. The Internet sector continued to be the hottest investment sector across the industry, exceeding other sectors in proportion of both deal volume and value. Huge investments, each with a single-deal value over US$1 billion also occurred in the Technology sector and the Telecommunications and Mobile sector. By comparison, the Entertainment and Media appeared to perform more modestly.
Besides the huge deals, investments in the TMT industry remained stable in H1 2016, with no major fluctuations in either volume or value. It appears that investors remained relatively measured in their approaches, with a range of advantageous investments made in companies that have continued to heat up over the period.
PwC Viewpoints
Figure 5: Deal value comparison in TMT sectors – Q3 2013-Q2 2016
25,000
20,000
15,000
10,000
5,000
0
$1,962$3,614
$2,490
$5,539$3,865
$5,137$5,718
$8,577 $8,957
$13,288 $13,936
$20,051
Q3’13 Q4’13 Q1’14 Q2’14 Q3’14 Q4’14 Q1’15 Q2’15 Q3’15 Q4’15 Q1’16 Q2’16
Telecommunications and Mobile
Technology Internet
Entertainment and Media
US$m
Figure 6: Deal volume comparison in TMT sectors – Q3 2013-Q2 2016
600
500
400
300
200
100
0
Q3’13 Q4’13 Q1’14 Q2’14 Q3’14 Q4’14 Q1’15 Q2’15 Q3’15 Q4’15 Q1’16 Q2’1622 31
9 12 15 10 20 31 45 26
79 74 76112 113
94 78119
207
105152
269
6167
115 138 125
245
370
487
71 68
239
316
7448 40
125
228
154
50
136
426386
117
6467105
Telecommunicationsand Mobile
Technology Internet Entertainment and Media
In Q1 2016, of the 22 deals with a single-deal value over US$100 million, Internet, Technology, as well as Telecommunications and Mobile accounted for 77%, 18% and 5%, respectively.
In Q2 2016, of the 23 deals with a single-deal value over US$100 million, Internet, Technology, Entertainment and Media, and Telecommunications and Mobile accounted for 65%, 13%, 13% and 9%, respectively.

9MoneyTreeTM China TMT Report Q1/Q2 2016
Q1 2016Total deal volume for the TMT industry reached 717 deals, with a total investment value of US$13.94 billion.
Figure 8: Deal value in TMT sectors Q1’16 (US$m)
Figure 7: Deal volume in TMT sectors Q1’16
Deal volume by sectors
Internet: 426 deals, 59% of the total
Technology: 136 deals, 19% of the total
Telecommunications and mobile: 105 deals, 15% of the total
Entertainment and Media: 50 deals, 7% of the total
Deal value by sectors
Internet: US$11.56 billion, 83% of the total
Technology: US$1.29 billion, 9% of the total
Telecommunications and mobile: US$0.79 billion, 6% of the total
Entertainment and Media: US$0.29 billion, 2% of the total
42659%
13619%105
15%
507%
TechnologyTelecommunications and Mobile
Internet
Entertainment and Media
$11,56383%
$1,2929%
$7946%
$2862%
Internet Technology Telecommunications and MobileEntertainment and Media
QoQ comparison between Q1 2016
and Q4 2015
Deal volume
Dealvalue
Technology技 12% 12%
Internet技技 78% 230%
Telecommunications and Mobile
72% 65%
Entertainmentand Media
92% 5%
10 MoneyTreeTM China TMT Report Q1/Q2 2016
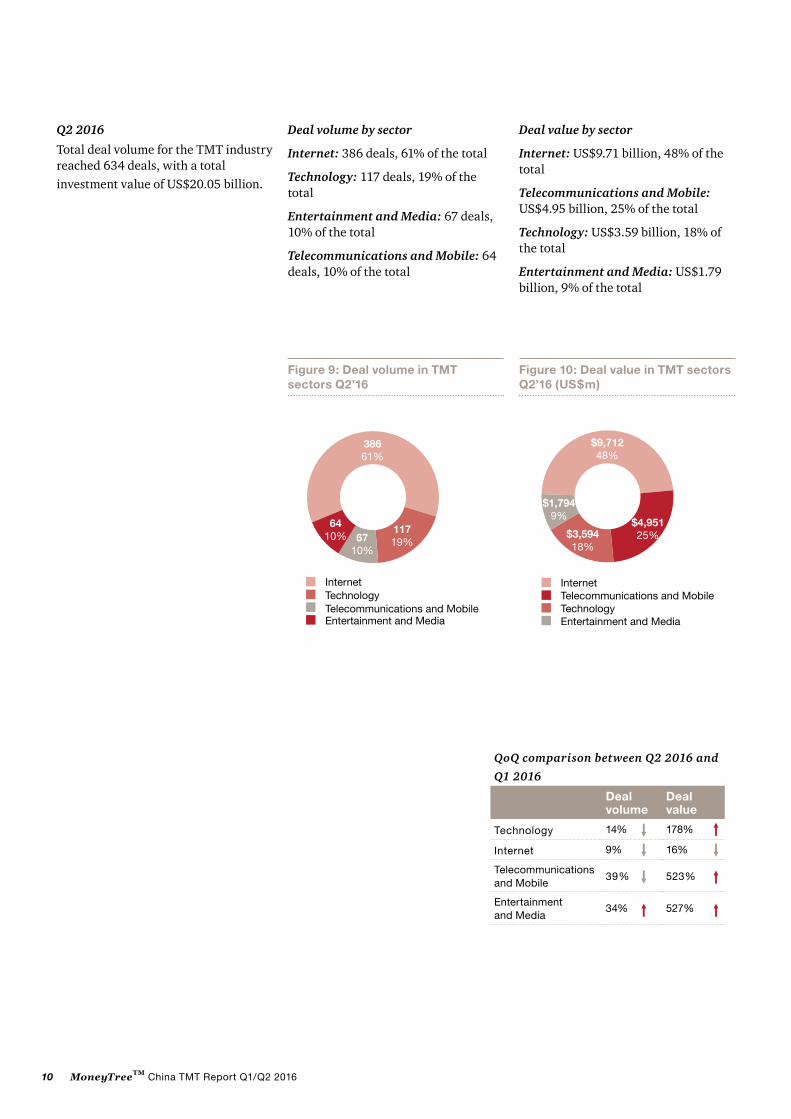
QoQ comparison between Q2 2016 and
Q1 2016
Deal volume
Dealvalue
Technology技 14% 178%
Internet技技 9% 16%
Telecommunications and Mobile
39% 523%
Entertainmentand Media 传技
34% 527%
Deal volume by sector
Internet: 386 deals, 61% of the total
Technology: 117 deals, 19% of the total
Entertainment and Media: 67 deals, 10% of the total
Telecommunications and Mobile: 64 deals, 10% of the total
Deal value by sector
Internet: US$9.71 billion, 48% of the total
Telecommunications and Mobile: US$4.95 billion, 25% of the total
Technology: US$3.59 billion, 18% of the total
Entertainment and Media: US$1.79 billion, 9% of the total
Q2 2016
Total deal volume for the TMT industry reached 634 deals, with a total investment value of US$20.05 billion.
Figure 9: Deal volume in TMT sectors Q2’16
Figure 10: Deal value in TMT sectors Q2’16 (US$m)
38661%
11719%67
10%
6410%
Telecommunications and MobileTechnology Internet
Entertainment and Media
$9,71248%
$4,95125%$3,594
18%
$1,7949%
Entertainment and Media Technology
Internet Telecommunications and Mobile

11MoneyTreeTM China TMT Report Q1/Q2 2016
Figure 11: TMT follow-on funding compared with initial investments – Q3 2013-Q2 2016
100%
90%
80%
70%
60%
50%
40%
30%
20%
10%
0%
Q3’13 Q4’13 Q1’14 Q2’14 Q3’14 Q4’14 Q1’15 Q2’15 Q3’15 Q4’15 Q1’16 Q2’16
67%63% 61% 58%
78% 73%
65%60%
53% 55%
44% 45%
Initial investments Follow-on investments
First-time funding compared with follow-on funding
Q1 2016 Q2 2016
Q1’16First-round 3690Total investment 139.36
Q1’16First-round 466Total investment717
13%
60%
26%
65%
US$mQ2’16First-round 2571Total investment 200.51
Q2
Q2Q1
Q1
Q2’16First-round 379Total investment634
PE/VC funding in all industries
PE/VC deal volume in all industries

12 MoneyTreeTM China TMT Report Q1/Q2 2016
Q1 2016
Enterprises engaged in first-round funding by sector:
Internet: 292 enterprises, funding total US$3.20 billion
Telecommunications and Mobile: 76 enterprises, funding total US$0.2 billion
Technology: 69 enterprises, funding total US$0.22 billion
Entertainment and Media: 29 enterprises, funding total US$0.08 billion
For first-round funding, 400 enterprises were at the early stage, accounting for 86%; 46 enterprises were at the expansion stage, accounting for 10% and 20 enterprises were at the late stage, accounting for 4%.
Q2 2016
Enterprise engaged in first-round funding by sector:
Internet: 253 enterprises, funding total US$1.3 billion
Technology: 50 enterprises, funding total US$0.19 billion
Entertainment and Media: 40 enterprises, funding total US$1.03 billion
Telecommunications and Mobile: 36 enterprises, funding total US$0.11 billion
For first-round funding, 313 enterprises were at the early stage, accounting for 83%; 61 enterprises were at the expansion stage, accounting for 16% and 5 enterprises were at the late stage, accounting for 1%.
We have seen a continual emergence of new companies that have contributed to innovation and entrepreneurship in fields that are changing people’s lifestyles and living environments. This is the trend of the times, and so new projects in this arena have attracted attention from investors. In H1 2016, the proportion of the deal volume of initial investments remained high, at over 60%, but the proportion of deal value continued to drop. Indeed, these trends can be seen as an indication of how investors have assessed the future value of such new projects. For projects with a fair degree of uncertainty, deal value was relatively small.
PwC Viewpoints
Q1 2016
First-time funding summary (US$)
Number of enterprises
<= 1m 395
1m-5m 3
>5m-10m 0
>10m 1
N/A 67
Q2 2016
First-time funding summary (US$)
Number of enterprises
<= 1m 332
1m-5m 2
>5m-10m 1
>10m 0
N/A 54
69
76
29229
253 50
3640

13MoneyTreeTM China TMT Report Q1/Q2 2016
Investments by stage of development
Deal value for early-stage investments reached the highest point since 2012
Among the four stages of investment, the deal volume for early-stage investments took the lead as usual, accounting for over 50%. Deal volume declined slightly compared to H2 2015 though saw little fluctuation. Investments in Q1 reached US$5.5 billion, a historical high. There were two huge deals in H1 2016, both of which exceeded US$1 billion. One related to an Internet service company and the other to a high profile Internet Entertainment company.
In Q2, expansion-stage investments experienced explosive growth
The deal value of expansion-stage investments was less than that of early-stage investments in Q1, though in Q2 it exceeded that of early-stage investments, reaching US$12 billion, or 60% of the total, becoming the highest quarter on record since 2012. The figures were boosted by two unicorn investments in Q2, amounting to US$4.5 billion. These also happened to have the highest single-deal value in H1 2016, for the TMT industry. Deal volume in H1 2016 increased slightly from quarter to quarter and maintained steady growth of over 20%.
Quarterly deal value for late-stage investments hit the highest level since 2012
The deal value for investments in Q1 increased by 521% QoQ, the highest since 2012, but dropped by 70% in Q2. Major factors included an investment of US$3.3 billion in a high profile B2C company, which ranked as the third highest of all investments recorded in H1 2016. The deal volume of late-stage investments accounted for 10% of the industry total, and experienced little fluctuation.
Quarterly investments in PIPE experienced a slight initial fall but increased sharply in Q2
Deal value and volume declined in Q1, but both increased in Q2. Investment value in Q2 was nearly US$4 billion, benefitting from a deal worth US$2.4 billion in an Electronics & Optoelectronics Devices company.
Figure 12: TMT investments by stage of development – Q3 2013-Q2 2016 (Deal value)
25,000
20,000
15,000
10,000
5,000
0
Q3’13 Q4’13 Q1’14 Q2’14 Q3’14 Q4’14 Q1’15 Q2’15 Q3’15 Q4’15 Q1’16 Q2’16
$1,955$3,614
$2,490
$5,539$3,865
$5,137
$8,577 $8,957
$13,289 $13,936
$20,051
$5,723
PIPE Early stageLate stage Expansion stage
US$m
Figure 13: TMT investments by stage of development – Q3 2013-Q2 2016 (Deal volume)
700
600
500
400
300
200
100
0Q3’13 Q4’13 Q1’14 Q2’14 Q3’14 Q4’14 Q1’15 Q2’15 Q3’15 Q4’15 Q1’16 Q2’16
22 22 21 2962 65 75
16
57
25
119
447
371
149181
232
13312992
63
16
10
8169
122
100
138 147 165 160
314
312
544
367
603
272
109
1723
7 6 53 4
12 102518
PIPEEarly stage Late stageExpansion stage
14 MoneyTreeTM China TMT Report Q1/Q2 2016
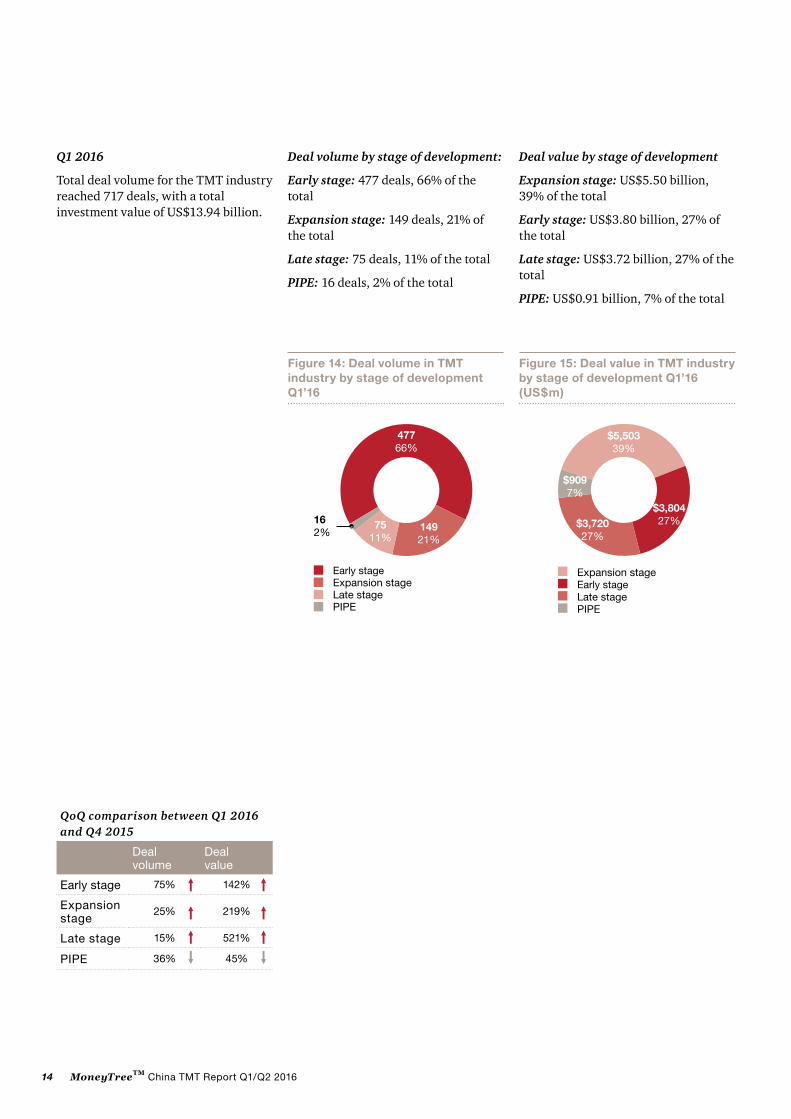
Q1 2016
Total deal volume for the TMT industry reached 717 deals, with a total investment value of US$13.94 billion.
Deal volume by stage of development:
Early stage: 477 deals, 66% of the total
Expansion stage: 149 deals, 21% of the total
Late stage: 75 deals, 11% of the total
PIPE: 16 deals, 2% of the total
Figure 15: Deal value in TMT industry by stage of development Q1’16 (US$m)
$5,50339%
$3,80427%$3,720
27%
$9097%
PIPE
Early stageLate stage
Expansion stage
Deal value by stage of development
Expansion stage: US$5.50 billion, 39% of the total
Early stage: US$3.80 billion, 27% of the total
Late stage: US$3.72 billion, 27% of the total
PIPE: US$0.91 billion, 7% of the total
QoQ comparison between Q1 2016 and Q4 2015
Deal volume
Deal value
Early stage 75% 142%
Expansion stage
25% 219%
Late stage 15% 521%
PIPE 36% 45%
Figure 14: Deal volume in TMT industry by stage of development Q1’16
47766%
14921%
162%
7511%
PIPE
Early stage
Late stageExpansion stage

15MoneyTreeTM China TMT Report Q1/Q2 2016
Q2 2016
Total deal volume for the TMT industry reached 634 deals, with a total investment value of US$20.05 billion.
Deal volume by stage of development
Early stage: 371 deals, 59% of the total
Expansion stage: 181 deals, 28% of the total
Late stage: 57 deals, 9% of the total
PIPE: 25 deals, 4% of the total
Deal value by stage of development
Expansion stage: US$12.06 billion, 60% of the total
PIPE: US$3.83 billion, 19% of the total
Early stage: US$3.06 billion, 15% of the total
Late stage: US$1.10 billion, 6% of the total
Figure 16: Deal volume in TMT industry by stage of development Q2’16
37159%
18128%
579%
254%
PIPE
Early stage
Late stageExpansion stage
Figure 17: Deal value in TMT industry by stage of development Q2’16 (US$m)
$12,06060%
$3,83419%$3,054
15%
$1,1006%
PIPEEarly stageLate stage
Expansion stage
QoQ comparison between Q2 2016 and Q1 2016
Deal volume
Deal value
Early stage传 22% 44%
Expansion stage传传
21% 217%
Late stage传 24% 70%
PIPE 56% 332%
16 MoneyTreeTM China TMT Report Q1/Q2 2016
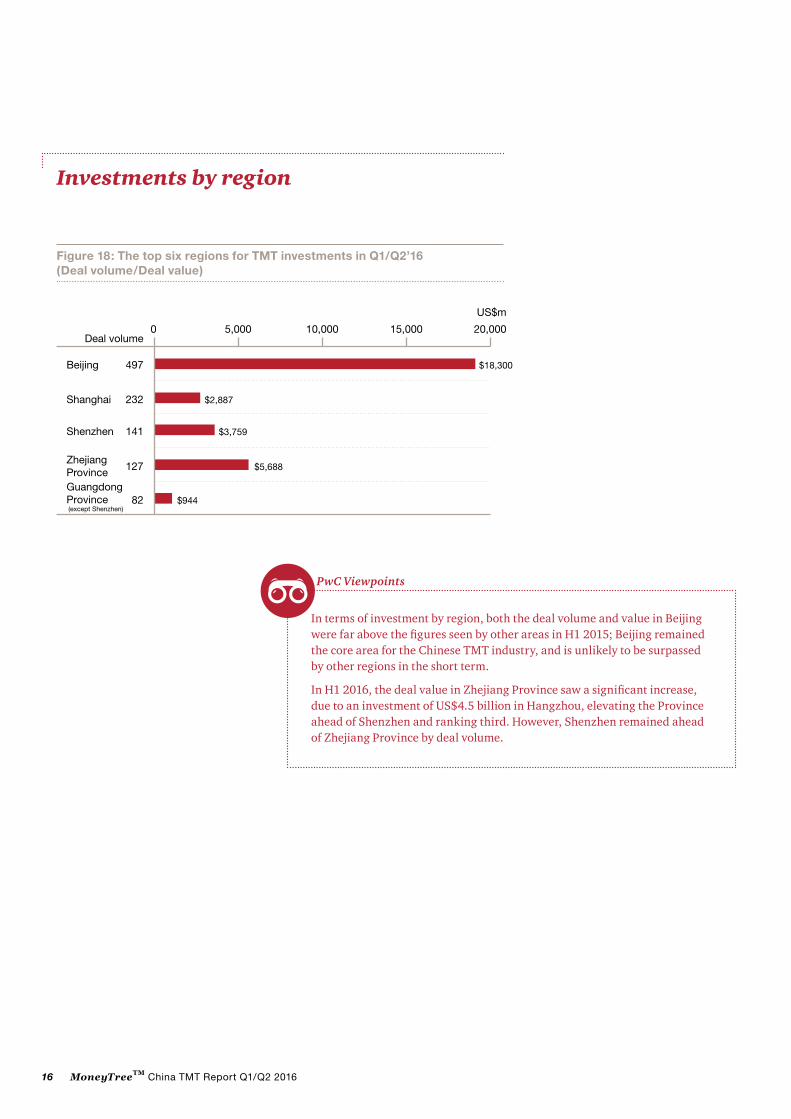
Investments by region
In terms of investment by region, both the deal volume and value in Beijing were far above the figures seen by other areas in H1 2015; Beijing remained the core area for the Chinese TMT industry, and is unlikely to be surpassed by other regions in the short term.
In H1 2016, the deal value in Zhejiang Province saw a significant increase, due to an investment of US$4.5 billion in Hangzhou, elevating the Province ahead of Shenzhen and ranking third. However, Shenzhen remained ahead of Zhejiang Province by deal volume.
PwC Viewpoints
Figure 18: The top six regions for TMT investments in Q1/Q2’16 (Deal volume/Deal value)
497
232
141
127
82
$18,300
$3,759
$5,688
$2,887
$944
0 5,000 10,000 20,00015,000
US$m
Deal volume
Beijing
Shanghai
Zhejiang Province
Shenzhen
Guangdong Province (except Shenzhen)

17MoneyTreeTM China TMT Report Q1/Q2 2016
Exits by quarter
3. PE/VC exits in the TMT industry
There were 46 exits in both Q1 and Q2 2016, following the 115 exits which occurred in H2 2015. In total, the amount of exits in H1 2016 decreased by 20% compared to H2 2015.
With the resumption of IPOs in H2 2015, the number of IPOs increased gradually, but the level still didn’t surpass that of strategic sales. In H1 2016, the number of strategic sales exceeded 60% of total exits, suggesting that there had been little if any affect from the resumption of IPOs. IPOs in A-shares are still facing a long waiting period at present, which is a big challenge for TMT companies that have seen relatively big fluctuations and this is a key factor underpinning the recent trends by TMT companies considering strategic sales, and other exit methods.
PwC Viewpoints
Figure 19: Exit volume in the TMT industry – Q3 2013-Q2 2016
80
70
60
50
40
30
20
10
0
Q3’13 Q4’13 Q1’14 Q2’14 Q3’14 Q4’14 Q1’15 Q2’15 Q3’15 Q4’15 Q1’16 Q2’16
23 2326
69
53
46 46
2014
18 16 17

18 MoneyTreeTM China TMT Report Q1/Q2 2016
The number of IPOs slightly increased in H1 2016 due to the resumption of IPOs in November 2015.
Strategic sales accounted for more than 60% of exits for the first time in H1 2016, an increase of approximately 12%.
Management buy-out and secondary sale made up only a small percentage of the exits in H1 2016, with no occurrences of either in Q2.
Exits by type
Figure 20: TMT exit trends by type – Q3 2013-Q2 2016
IPO
80
70
60
50
40
30
20
10
0
Q3’13 Q4’13 Q1’14 Q2’14 Q3’14 Q4’14 Q1’15 Q2’15 Q3’15 Q4’15 Q1’16 Q2’16
11
11 1 1
32
2
22 22 2
6 69 845 5
8
4
77
10
11
11
14 20 32
13
12
29 28
18
15
25
19
10
8
4
Strategic saleManagement buy-outSecondary sale
Q1 2016 Q2 2016
Strategic sale
Management buy-out
Secondary sale
IPO
29 28
18
3
12
2
63%
4%
26% 39%
7%
61%
PE/VC deal volume in all industries

19MoneyTreeTM China TMT Report Q1/Q2 2016
In 2016, the resumption of IPOs in the A-shares market led to increasing exits via IPOs, which rose by 20% from H2 2015.
As for the destination of IPOs, Shanghai Stock Exchange and the Growth Enterprise Board (GEM) of the Shenzhen Stock Exchange were the core areas for domestic IPOs, while the Hong Kong Main Board and the New York Stock Exchange were the main locations for IPOs overseas.
In Q1 2016, there were 46 exits in total, broken down as follows:
Strategic sale: 29 deals, 63% of the total
IPO: 12 deals, 26% of the total
Secondary sale: 3 deals, 7% of the total
Management buy-out (including buy-back): 2 deals, 4% of the total
In Q2 2016, there were 46 exits in total, broken down as follows:
Strategic sale: 28 deals, 61% of the total
IPO: 18 deals, 39% of the total
Figure 21: Comparison of TMT exits in mainland China, Hong Kong and US capital markets – Q3 2013-Q2 2016
Q3’13 50%50% Q4’13
43%
57%
Q1’14 Q2’14
90%
10%
64%
27%9%
Q4’14Q3’14
64%
27%9%
50% 57%
29%14%25%25%
Q1’15 Q2’15 Q3’15 Q4’15 Q1’16 Q2’16
86% 80%
10%10%14%
90%
10%
71%
29% 8%
92%
33%
67%
Mainland China Hong Kong US
Figure 22: Exit types in the TMT industry Q2’16
2963%
37%
1226%
24%
IPOStrategic sale
Secondary saleManagement buy-out
Figure 23: Exit types in the TMT industry Q2’16
2861%
1839%
IPOStrategic sale
PE/VC deal volume
Q1 2016
Q2 2016
Shanghai Stock Exchange
GEM Board of Shenzhen Stock Exchange
SME Board of Shenzhen Stock Exchange
Hong Kong Main Board
New York Stock Exchange
1
2 1
11
96
listed company

20 MoneyTreeTM China TMT Report Q1/Q2 2016
Exits by sectorQ1 2016
Exits by sector in the TMT industry:
Entertainment and Media: 22 deals, 48% of the total
Technology: 16 deals, 35% of the total
Internet: 5 deals, 11% of the total
Telecommunications and Mobile: 3 deals, 6% of the total
Figure 24: IPO exits in the TMT industry – Q3 2013-Q2 2016
40
35
30
25
20
15
10
5
0
Q1’15 Q2’15 Q3’15 Q4’15 Q1’16 Q2’16Q3’13 Q4’13 Q1’14 Q2’14 Q3’14 Q4’14
0 02
22
2 2
13
9
9
6
12 11
1716
10
8 8 85
43
35
2722
16
22
11
57 7 7
33
34
4 4 4 4
11
Technology
InternetTelecommunications and Mobile
Entertainment and Media
Q2 2016
Exits by sector in the TMT industry:
Technology: 22 deals, 48% of the total
Internet: 11 deals, 24% of the total
Entertainment and Media: 8 deals, 20% of the total
Telecommunications and Mobile: 4 deals, 8% of the total
• Exits in the Technology, Internet, and Telecommunications and Mobile sector decreased significantly in Q1, but rose slightly in Q2.
• Exits in the Entertainment and Media sector increased greatly, the number of which reached a historical high since 2012, accounting for over 50% in Q1, but decreasing slightly in Q2.

21MoneyTreeTM China TMT Report Q1/Q2 2016
4. Sector focus: Technology, Internet, and Telecommunications and Mobile
Investments in Technology
The Technology sector includes IT Services, Hardware, Software, Electronics & Optoelectronics Devices and Semiconductor.
In Q2 2016, the deal value in the Electronics & Optoelectronics Devices subsector was the highest recorded since 2012
In Q2 2016, deal value in the Electronics & Optoelectronics Devices subsector increased by 907% compared to Q1 2016, reaching the highest level since 2012. The value was helped along by a deal worth US$2.4 billion in an Electronics & Optoelectronics Devices company.
In H1 2016, deal volume in the Software subsector accounted for the majority of the sector
In H1 2016, deal volume in the Software subsector experienced a decline, but still accounted for the majority of deals in the Technology sector. Deal value in Q1 2016 also surpassed other subsectors, but ranked second in Q2 2016, largely as a result of a huge investment in the Electronics & Optoelectronics Devices subsector.
In Q1 2016, deal value in the Hardware subsector reached the highest since 2012
In Q1 2016, deal volume and deal value in the Hardware subsector increased by 106% and 281%, respectively, compared to Q4 2015. This marked a substantial improvement from 2015, with the proportion of both surpassing the IT and the Semiconductor subsectors.
In H1 2016, investments in the IT and the Semiconductor sector decreased substantially
There were declines in investments in the IT and the Semiconductor subsectors in H1 2016, though the drops were minor compared to prior years.
Figure 25: Deal value in the Technology sector – Q3 2013-Q2 2016
4,000
3,500
3,000
2,500
2,000
1,500
1,000
500
0
$848
$1,583
$2,813
$2,389 $2,392
$1,632$1,461
$1,292
$3,594
$218
$1,001
$574
Q3’13 Q4’13 Q1’14 Q2’14 Q3’14 Q4’14 Q1’15 Q2’15 Q3’15 Q4’15 Q1’16 Q2’16
US$m
Hardware
Semiconductor IT Services
Software
Electronics & Optoelectronics Devices
Figure 26: Deal volume in the Technology sector – Q3 2013-Q2 2016
90
80
70
60
50
40
30
20
10
0
Q1’15 Q2’15 Q3’15 Q4’15 Q1’16 Q2’16Q3’13 Q4’13 Q1’14 Q2’14 Q3’14 Q4’14
16
72 2
11
2326
26
35
44 44
79
70
34
34
18
59
3731
37
7 63 5
40
19
15
30 302522
23
16
2727
2421
13
5 5
23
22
153
3 32 2 27
15
15
21
13
913
1
26
HardwareSemiconductor
IT ServicesSoftwareElectronics & Optoelectronics Devices

22 MoneyTreeTM China TMT Report Q1/Q2 2016
QoQ comparison between Q1 2016
and Q4 2015
Deal volume
Deal value
Electronics & Optoelectronics Devices
24% 68%
Software 25% 88%
IT Services 30% 36%
Semiconductor传 50% 74%
Hardware 106% 281%
Deal volume and value
Q1 2016
There were a total of 136 deals in the Technology sector, with a total investment value of US$1.29 billion.
Software:44 deals, 33% of the total; deal value of US$0.51 billion, 40% of the total
Hardware:37 deals, 27% of the total; deal value of US$0.26 billion, 20% of the total
Electronics & Optoelectronics Devices:26 deals, 19% of the total; deal value of US$0.26 billion, 20% of the total
IT Services:26 deals, 19% of the total; deal value of US$0.22 billion, 17% of the total
Semiconductor:3 deals, 2% of the total; deal value of US$0.04 billion, 3% of the total
Figure 27: Deal volume by Technology subsector Q1’16
4433%3
2%
2619%
3727%
2619%
Hardware
SemiconductorIT Services
SoftwareElectronics & Optoelectronics Devices
Figure 28: Deal value by Technology subsector Q1’16 (US$m)
$51140%
$433%
$26420%
$25720%
$21717%
Hardware
SemiconductorIT Services
SoftwareElectronics & Optoelectronics Devices
23MoneyTreeTM China TMT Report Q1/Q2 2016
Deal volume and value
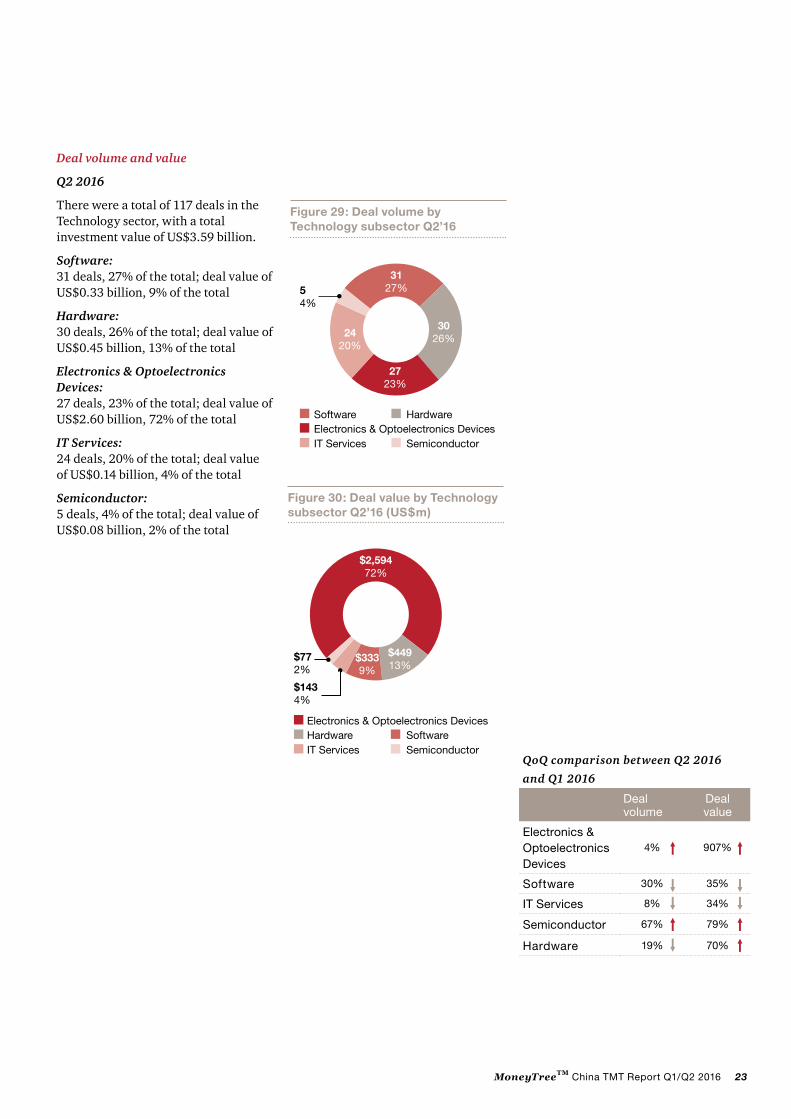
Q2 2016
There were a total of 117 deals in the Technology sector, with a total investment value of US$3.59 billion.
Software:31 deals, 27% of the total; deal value of US$0.33 billion, 9% of the total
Hardware:30 deals, 26% of the total; deal value of US$0.45 billion, 13% of the total
Electronics & Optoelectronics Devices:27 deals, 23% of the total; deal value of US$2.60 billion, 72% of the total
IT Services:24 deals, 20% of the total; deal value of US$0.14 billion, 4% of the total
Semiconductor:5 deals, 4% of the total; deal value of US$0.08 billion, 2% of the total
Figure 29: Deal volume by Technology subsector Q2’16
Figure 30: Deal value by Technology subsector Q2’16 (US$m)
3127%5
4%
3026%
2723%
2420%
Hardware
SemiconductorIT Services
SoftwareElectronics & Optoelectronics Devices
$2,59472%
$772%
$1434%
$3339%
$44913%
HardwareSemiconductorIT ServicesSoftware
Electronics & Optoelectronics Devices
QoQ comparison between Q2 2016
and Q1 2016
Dealvolume
Deal value
Electronics & Optoelectronics Devices 传传传传传
4% 907%
Software 30% 35%
IT Services传传 8% 34%
Semiconductor 传 67% 79%
Hardware 19% 70%

24 MoneyTreeTM China TMT Report Q1/Q2 2016
Investments by stage of development
PIPE investments continued to increase, and ranked first in terms of deal value
In H1 2016, PIPE investments maintained the robust momentum seen in H2 2015, with the deal volume and value repeatedly setting new records since 2012 and the deal value ranked the highest in the sector. The ranking benefited from a deal worth US$2.4 billion in an Electronics & Opto-electronics Devices company in Q2 2016.
Early-stage deal value increased while deal volume decreased slightly
In H2, early-stage deal volume accounted for the majority of the Technology sector as a whole, but total deal value was only slightly higher than that seen in late stage deals. From Q1, deal volume of early-stage investments decreased QoQ while deal value increased QoQ. The single-average-deal value rose sharply, but there was no investment with a single-deal value that was over US$100 million in H1 2016.
Investments at the expansion and late stages decreased in H1 2016
In H1 2016, volume in expansion and late stage deals decreased by 53% compared to H2 2015, while deal value decreased by 7% and 73%, respectively. There was only one deal with a single-deal value of over US$100 million in H1 2016. No huge investments were made in late-stage companies.
Figure 31: Deal value by stage of development in the Technology sector – Q3 2013-Q2 2016
4,000
3,500
3,000
2,500
2,000
1,500
1,000
500
0
$218$574
$2,813
$2,389
$1,001
$1,632$1,461
$1,292
$2,392
$3,594
$848
$1,583
Q1’16 Q2’16Q3’13 Q4’13 Q1’14 Q2’14 Q3’14 Q4’14 Q1’15 Q2’15 Q3’15 Q4’15
PIPE Early stageExpansion stageLate stage
US$m
Figure 32: Deal volume by stage of development in the Technology sector – Q3 2013-Q2 2016
120
100
80
60
40
20
0
Q1’16 Q2’16Q3’13 Q4’13 Q1’14 Q2’14 Q3’14 Q4’14 Q1’15 Q2’15 Q3’15 Q4’15
3126
2410 10
1714
40 40
106
6 715
54 54
37
48
98
88
76
48
8
3
21 21 21
11
4
8
25
3120
10
37
36
68
39
34 34
34
46 45
32
14
3
PIPEEarly stage Expansion stage Late stage

25MoneyTreeTM China TMT Report Q1/Q2 2016
QoQ comparison between Q2 2016
and Q1 2016
Deal volume
Deal value
Early stage 17% 84%
Expansion stage技
‒ 37%
Late stage 48% 62%
PIPE 113% 421%
Investments by stage of development
Q1 2016
Early stage:54 deals, 40% of the total; deal value of US$124 million, 10% of the total
Late stage:40 deals, 29% of the total; deal value of US$170 million, 13% of the total
Expansion stage:34 deals, 25% of the total; deal value of US$415 million, 32% of the total
PIPE:8 deals, 6% of the total; deal value of US$584 million, 45% of the total
Q2 2016
Early stage:45 deals, 39% of the total; deal value of US$228 million, 6% of the total
Expansion stage:34 deals, 29% of the total; deal value of US$262 million, 7% of the total
Late stage:21 deals, 18% of the total; deal value of US$64 million, 2% of the total
PIPE:17 deals, 14% of the total; deal value of US$3,040 million, 85% of the total
Figure 33: Deal volume by stage of development in the Technology sector Q1’16
Figure 34: Deal value by stage of development in the Technology sector Q1’16 (US$m)
5440%
86%
4029%34
25%
PIPEEarly stageExpansion stage
Late stage
$12410%
$58445%
$41532%$170
13%
PIPEEarly stageExpansion stage
Late stage
Figure 35: Deal volume by stage of development in the Technology sector Q2’16
Figure 36: Deal value by stage of development in the Technology sector Q2’16 (US$m)
4539%
3429%
2118%
1714%
PIPEEarly stage Expansion stageLate stage
$3,04085%
$642%
$2286%
$2627%
PIPEEarly stage
Expansion stageLate stage
QoQ comparison between Q1 2016
and Q4 2015
Deal volume
Deal value
Early stage 46% 4%
Expansion stage技
29% 124%
Late stage 26% 70%
PIPE 47% 2%

26 MoneyTreeTM China TMT Report Q1/Q2 2016
Investments by region
Figure 37: The top six regions for Technology investments Q1/Q2’16 (Deal volume/Deal value)
68
40 $514
$3,143
33 $254
25 $174
22 $351
0 3,0002,5002,0001,5001,000500 3,500Deal volume
Beijing
Shanghai
Shenzhen
Guangdong Province (except Shenzhen)
Zhejiang Province
US$m

27MoneyTreeTM China TMT Report Q1/Q2 2016
The total quarterly investment value of Internet Services in Q1 reached the highest level recorded since 2012
In H1 2016, investments in the Internet Services sector performed well and accounted for more than 40% of Internet sector investments, which was in line with the sector performance in H2 2015. The deal value in both Q1 and Q2 exceeded US$2 billion, with the deal value in Q1 reaching US$2.8 billion, the highest level recorded since 2012. In H1 2016, there were a total of seven deals in the Internet Services subsector, each with a single deal value of over US$100 million. Among the seven deals, the largest by value was worth US$1.5 billion, involving a well-known online network data company.
The total quarterly investment value of E-commerce in Q1 reached record highs
In H1 2016, E-commerce performed comparably to Internet Services. Although the deal volume kept basically the same as H2 2015, the deal value rose by 158% QoQ. The total investment value reached as high as US$4.6 billion in Q1, mainly due to a deal worth US$3.3 billion involving a
Investments in Internet
The Internet sector includes E-commerce, Online Education, Internet Services, Online Entertainment, Social Media, Internet Marketing and Internet Finance.
well-known B2C company.
Investments in Internet Finance developed rapidly in H1 2016
In H1 2016, the Internet Finance sector saw its biggest growth since 2012. The deal value in Q1 was four times that of Q4 2015, and deal value in Q2 was more than twice the level of Q1, with a total of more than US$5 billion. Among the 10 deals with a single deal value of over US$100 million each in H1 2016, two deals were worth US$1 billion or more, with one valued at US$4.5 billion and the other US$1 billion. The two deals played a key role in shaping investments in Internet Finance over
Figure 38: Deal value in the Internet sector – Q3 2013-Q2 2016
14,000
12,000
10,000
8,000
6,000
4,000
2,000
0
Q1’15
$578 $854$1,654 $1,782 $2,267 $1,996
$4,819$3,728
$5,361
$3,505
$11,563
$9,712
Q2’15 Q3’15 Q4’15 Q1’16 Q2’16Q3’13 Q4’13 Q1’14 Q2’14 Q3’14 Q4’14
E-commerceInternet Services
Internet Marketing Social Media
Online Education
Online EntertainmentInternet Finance
US$m
Figure 39: Deal volume in the Internet sector – Q3 2013-Q2 2016
250
200
150
100
50
0Q1’15 Q2’15 Q3’15 Q4’15 Q1’16 Q2’16Q3’13 Q4’13 Q1’14 Q2’14 Q3’14 Q4’14
47 55 55 55 54 5758
92
158
107
192
61 61
21 21
48
10
39 3939
80 82 87
154
219
90 9479
132
1723 1417
6 6
12
1616
1616
4 8 85 6 613
211 12 16 1611 1123
3129 2924
12
18 18 19 19 194 4 9
107 7 7 37
1426 24 24
2614
15
10
102
E-commerce Internet Services
Internet MarketingSocial Media
Online Education Online Entertainment
Internet Finance
the period.
The quarterly deal value of Online Entertainment in Q1 hit US$1 billion for the first time since 2012, with deal volume equalling the highest on record
The quarterly deal value of Online Entertainment in Q1 hit US$1 billion, a dramatic increase compared to 2015, and reaching the highest value seen since 2012. The deal volume in Q1 and Q2 was the same, equalling the record level set in Q2 2012. In H1 2016, Online Entertainment also saw a huge investment of US$1 billion, which was made in a well-known network video enterprise.

28 MoneyTreeTM China TMT Report Q1/Q2 2016
QoQ comparison between Q1 2016 and
Q4 2015
Deal volume
Dealvalue
E-commerce 89% 597%
Online Education 13% 88%
Internet Services 79% 82%
Online Entertainment
271% 2,846%
Social Media 233% 284%
Internet Marketing 85% 26%
Internet Finance 技技 49% 399%
Deal volume and value
Q1 2016
There were 426 deals in the Internet sector in Q1 2016, with a total investment value of US$11.56 billion.
Internet Services:192 deals, 45% of the total; deal value of US$2.79 billion, 24% of the total
E-commerce:102 deals, 24% of the total; deal value of US$4.56 billion, 39% of the total
Internet Finance:58 deals, 14% of the total; deal value of US$2.56 billion, 22% of the total
Online Entertainment: 26 deals, 6% of the total; deal value of US$1.33 billion, 12% of the total
Internet Marketing:24 deals, 6% of the total; deal value of US$0.23 billion, 2% of the total
Online Education:14 deals, 3% of the total; deal value of US$0.05 billion, 0.7% of the total
Social Media:10 deals, 2% of the total; deal value of US$0.03 billion, 0.3% of the total
Figure 40: Deal volume by Internet subsector Q1’16
19245%
266%
143%
246%
102%
10224%
5814%
E-commerceInternet Services
Internet MarketingSocial Media
Online Education Internet FinanceOnline Entertainment
Figure 41: Deal value by Internet subsector Q1’16 (US$m)
$2,79324%
$4,56139%
$270.3%
$2322%
$520.7%
$2,56422%
$1,33412%
E-commerce Internet Services
Internet MarketingSocial Media
Online Education Internet Finance Online Entertainment

29MoneyTreeTM China TMT Report Q1/Q2 2016
QoQ comparison between Q2 2016 and
Q1 2016
Deal volume
Dealvalue
E-commerce 10% 76%
Online Education 71% 89%
Internet Services 18% 15%
Online Entertainment
− 77%
Social Media 40% 209%
Internet Marketing 38% 73%
Internet Finance 技技 2% 122%
Deal volume and value
Q2 2016
There were 386 deals in the Internet sector in Q2 2016, with a total investment value of US$9.71 billion.
Internet Services:158 deals, 41% of the total; deal value of US$2.38 billion, 25% of the total
E-commerce:92 deals, 24% of the total; deal value of US$1.09 billion, 11% of the total
Internet Finance:57 deals, 15% of the total; deal value of US$5.69 billion, 59% of the total
Online Entertainment:26 deals, 7% of the total; deal value of US$0.31 billion, 3% of the total
Online Education:24 deals, 6% of the total; deal value of US$0.10 billion, 1% of the total
Internet Marketing:15 deals, 4% of the total; deal value of US$0.06 billion, 0.4% of the total
Social Media:14 deals, 3% of the total; deal value of US$0.08 billion, 0.6% of the total
Figure 42: Deal volume by Internet subsector Q2’16
Figure 43: Deal value by Internet subsector Q2’16 (US$m)
15841%
267%
154%246%
143%
9224%
5715%
E-commerceInternet Services
Internet Marketing
Social MediaOnline Education Internet Finance Online Entertainment
$2,38225%
$5,68959%
$630.4%
$820.6%
$981%
$3133%
$1,08511%
E-commerceInternet Services
Internet MarketingSocial MediaOnline Education
Internet FinanceOnline Entertainment
30 MoneyTreeTM China TMT Report Q1/Q2 2016
Investments by stage of development
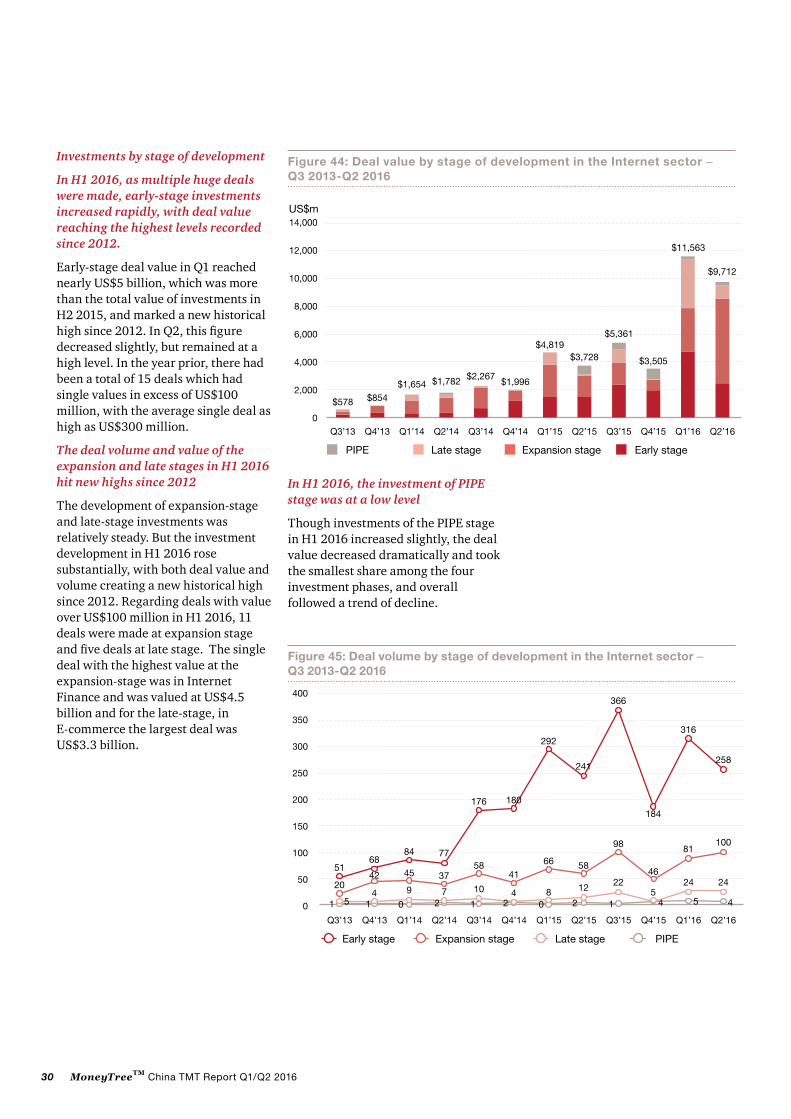
In H1 2016, as multiple huge deals were made, early-stage investments increased rapidly, with deal value reaching the highest levels recorded since 2012.
Early-stage deal value in Q1 reached nearly US$5 billion, which was more than the total value of investments in H2 2015, and marked a new historical high since 2012. In Q2, this figure decreased slightly, but remained at a high level. In the year prior, there had been a total of 15 deals which had single values in excess of US$100 million, with the average single deal as high as US$300 million.
The deal volume and value of the expansion and late stages in H1 2016 hit new highs since 2012
The development of expansion-stage and late-stage investments was relatively steady. But the investment development in H1 2016 rose substantially, with both deal value and volume creating a new historical high since 2012. Regarding deals with value over US$100 million in H1 2016, 11 deals were made at expansion stage and five deals at late stage. The single deal with the highest value at the expansion-stage was in Internet Finance and was valued at US$4.5 billion and for the late-stage, in E-commerce the largest deal was US$3.3 billion.
Figure 44: Deal value by stage of development in the Internet sector – Q3 2013-Q2 2016
14,000
12,000
10,000
8,000
6,000
4,000
2,000
0Q1’15
$578 $854$1,654 $1,782 $2,267
$1,996
$4,819$3,728
$5,361
$3,505
$11,563
$9,712
Q2’15 Q3’15 Q4’15 Q1’16 Q2’16Q3’13 Q4’13 Q1’14 Q2’14 Q3’14 Q4’14
PIPE Expansion stageLate stage Early stage
US$m
Figure 45: Deal volume by stage of development in the Internet sector – Q3 2013-Q2 2016
400
350
300
250
200
150
100
50
0
Q1’15 Q2’15 Q3’15 Q4’15 Q1’16 Q2’16Q3’13 Q4’13 Q1’14 Q2’14 Q3’14 Q4’14
0 01 1 1 12 2 255
54 49 7 44 8 12 22 24 24
102042 45 37
5841
66 58
98 81100
316
258
465168
84 77
176 180
292
241
366
184
PIPEExpansion stage Late stageEarly stage
In H1 2016, the investment of PIPE stage was at a low level
Though investments of the PIPE stage in H1 2016 increased slightly, the deal value decreased dramatically and took the smallest share among the four investment phases, and overall followed a trend of decline.

31MoneyTreeTM China TMT Report Q1/Q2 2016
Investments by stage of development
Q1 2016
There were 426 deals in the Internet sector, with a total investment value of US$5.36 billion.
Early stage:316 deals, 74% of the total; deal value of US$4.73 billion, 41% of the total
Expansion stage:81 deals, 19% of the total; deal value of US$3.11 billion, 27% of the total
Late stage:24 deals, 6% of the total; deal value of US$3.52 billion, 30% of the total
PIPE:5 deals, 1% of the total; deal value of US$0.20 billion, 2% of the total
Q2 2016
There were 386 deals in the Internet sector, with a total investment value of US$9.71 billion.
Early stage:258 deals, 67% of the total; deal value of US$2.47 billion, 25% of the total
Expansion stage:100 deals, 26% of the total; deal value of US$6.06 billion, 63% of the total
Late stage:24 deals, 6% of the total; deal value of US$0.96 billion, 10% of the total
PIPE:4 deals, 1% of the total; deal value of US$0.23 billion, 2% of the total
Figure 46: Deal volume by stage of development in the Internet sector Q1’16
Figure 47: Deal value by stage of development in the Internet sector Q1’16 (US$m))
Figure 48: Deal volume by stage of development in the Internet sector Q2’16
Figure 49: Deal value by stage of development in the Internet sector Q2’16 (US$m)
31674%
8119%
246%
51%
Expansion stageLate stageEarly stage
PIPE
$3,52230%
$3,10927%
$4,73141%
PIPE
2012%
Expansion stageLate stageEarly stage
25867%
41% 100
26%246%
Expansion stageLate stageEarly stage
PIPE
$2272%
$6,06363%
$2,46525%
$95710%
Expansion stageLate stage
Early stagePIPE
QoQ comparison between Q1 2016
and Q4 2015
Deal volume
Deal value
Early stage 72% 143%
Expansion stage
76% 308%
Late stage 380% 14,512%
PIPE 25% 74%
QoQ comparison between Q2 2016
and Q1 2016
Deal volume
Deal value
Early stage 18% 48%
Expansion stage
23% 95%
Late stage − 73%
PIPE 20% 13%
32 MoneyTreeTM China TMT Report Q1/Q2 2016
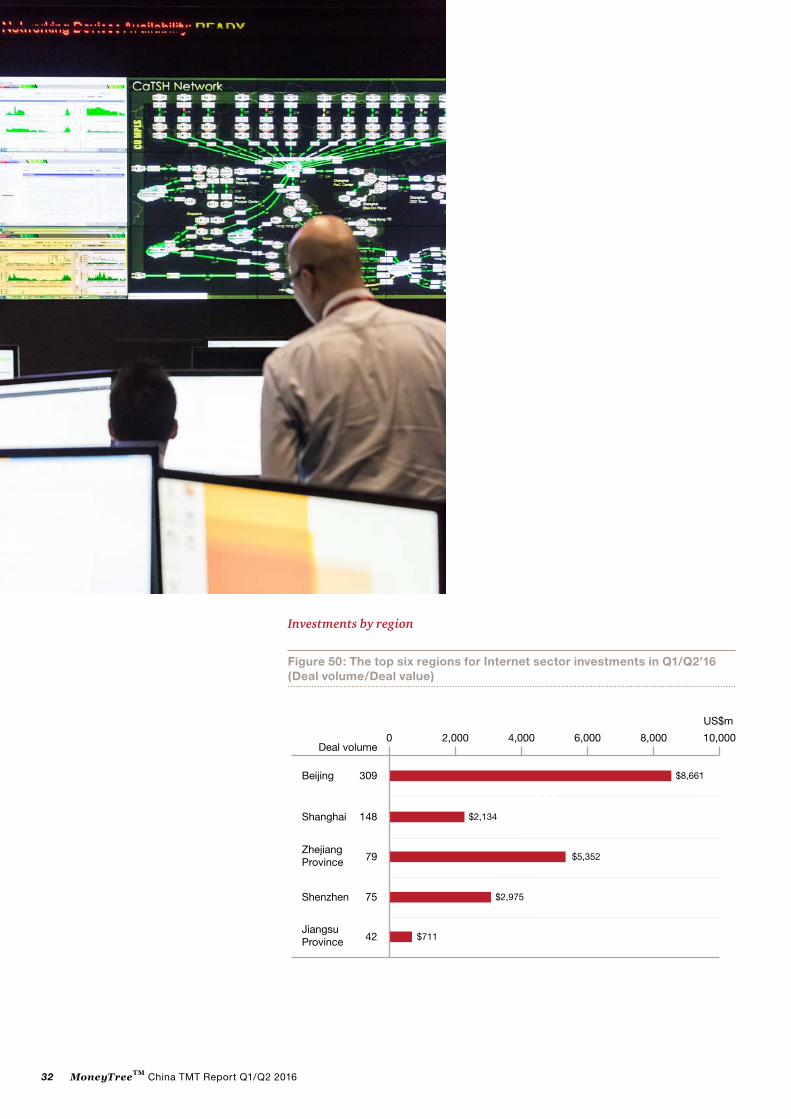
Investments by region
Figure 50: The top six regions for Internet sector investments in Q1/Q2’16 (Deal volume/Deal value)
309 $8,661
79 $5,352
75 $2,975
42 $711
148 $2,134
0 2,000 4,000 6,000 10,0008,000Deal volume
Beijing
Shanghai
Shenzhen
JiangsuProvince
ZhejiangProvince
US$m

33MoneyTreeTM China TMT Report Q1/Q2 2016
Investments in Telecommunications and MobileThe Telecommunications and Mobile sector includes Telecom Equipment and Terminals, Other Tele-communications Sectors and Mobile.
Deal volume and value
Q1 2016
There were 105 deals in the Telecommunications and Mobile sector, with a total investment value of US$794 million.
Mobile:96 deals, 91% of the total; deal value of US$697 million, 87.7% of the total
Telecom Equipment and Terminals:7 deals, 7% of the total; deal value of US$95 million, 12% of the total
Other Telecommunications Sectors:2 deals, 2% of the total; deal value of US$2 million, 0.3% of the total
Mobile: The largest single deal value was in Q2, which was the highest value recorded in the TMT industry since 2012
In Q1, the deal value increased by 77% QoQ compared to Q4 2015, and deal value in Q2 was nearly US$5 billion, almost six times that in Q1, a dramatic increase that represented the highest level recorded since 2012. The deal value in Mobile accounted for 98% of the total, mainly due to the US$4.5 billion invested in a well-known taxi hailing app enterprise in Q2. This deal value also reached the highest single-deal value in the TMT industry since 2012, equalling another large deal within Internet Finance.
Other Telecommunications Sectors and Telecom Equipment and Terminals: Investments remained stable in H1 2016
Other Telecommunications Sectors and Telecom Equipment and Terminals took a relatively small share compared to the Mobile sector, and both the deal value and volume in H1 2016 were at a relatively low level, without large fluctuations when compared with prior years.
Figure 51: Deal volume by subsegment in the Telecommunications and Mobile sector Q1’16
Figure 52: Deal value by subsegment in the Telecommunications and Mobile sector Q1’16 (US$m)
9691%
22%77%
MobileTelecom Equipment and TerminalsOther Telecommunications Sectors
$69788%
$20.3%
$9512%
MobileTelecom Equipment and TerminalsOther Telecommunications Sectors

34 MoneyTreeTM China TMT Report Q1/Q2 2016
Q2 2016
There were 64 deals in the Telecommunications and Mobile sector, with a total investment value of US$4.95 billion.
Mobile:56 deals, 87% of the total; deal value of US$4.84 billion, 97% of the total
Other Telecommunications Sectors:5 deals, 8% of the total; deal value of US$0.07 billion, 2% of the total
Telecom Equipment and Terminals:3 deals, 5% of the total; deal value of US$0.05 billion, 1% of the total
Figure 53: Deal volume by subsectors in the Telecommunications and Mobile sector Q2’16
Figure 54: Deal value by subsectors in the Telecommunications and Mobile sector Q2’16(US$m)
5687%
35%
58%
Mobile
Telecom Equipment and TerminalsOther Telecommunications Sectors
$4,83597%
$702%
$471%
Mobile
Telecom Equipment and TerminalsOther Telecommunications Sectors
QoQ comparison between Q1 2016
and Q4 2015
Deal volume
Dealvalue
Mobile 96% 77%
Telecom Equipment and Terminals
75% 417%
Other Telecommunications Subsectors 传传
75% 97%
QoQ comparison between Q2 2016
and Q1 2016
Deal volume
Dealvalue
Mobile 42% 594%
Telecom Equipment and Terminals
29% 27%
Other Telecommunications Subsectors 传传
50% 2,238%

35MoneyTreeTM China TMT Report Q1/Q2 2016
Investments by stage of development
Q1 2016
Early stage:79 deals, 75% of the total; deal value of US$450 million, 57% of the total
Expansion stage:21 deals, 20% of the total; deal value of US$261 million, 33% of the total
Late stage:4 deals, 4% of the total; deal value of US$7 million, 1% of the total
PIPE:1 deals, 1% of the total; deal value of US$77 million, 9% of the total
Q2 2016
Early stage:38 deals, 59% of the total; deal value of US$296 million, 6% of the total
Expansion stage:20 deals, 31% of the total; deal value of US$4.60 billion, 93% of the total
Late stage:6 deals, 10% of the total; deal value of US$52 million, 1% of the total
PIPE:No deals
Figure 55: Deal volume by stage of development in the Telecommunications and Mobile sector Q1’16
Figure 57: Deal volume by stage of development in the Telecommunications and Mobile sector Q2’16
Figure 56: Deal value by stage of development in the Telecommunications and Mobile sector Q1’16 (US$m)
Figure 58: Deal value by stage of development in the Telecommunications and Mobile sector Q2’16 (US$m)
7975%
2120%1
1%44%
PIPEEarly stage Expansion stageLate stage
$45057%
$26133%
$779%
$71%
PIPE Early stage Expansion stage
Late stage
3859%
2031%
610%
Early stage Expansion stageLate stage
QoQ comparison between Q1 2016
and Q4 2015
Deal volume
Deal value
Early stage 88% 127%
Expansion stage
62% 53%
Late stage 100% 40%
PIPE 75% 24%
QoQ comparison between Q2 2016
and Q1 2016
Deal volume
Deal value
Early stage 52% 34%
Expansion stage
5% 1,664%
Late stage 50% 691%
PIPE 100% 100%
$4,60393%
$521%$2966%
Early stage Expansion stageLate stage

36 MoneyTreeTM China TMT Report Q1/Q2 2016
Investments by region
Figure 59: The top six regions for investment in the Telecommunications and Mobile sector Q1/Q2'16 (Deal volume/Deal value)
73 $5,017
12
8
$7718
$136
6 $53
$42
35 $328
0 6,0005,0003,000 4,0002,0001,000
Beijing
Shanghai
Shenzhen
ZhejiangProvince
JiangsuProvince
Guangdong Province (except Shenzhen)
Deal volume
US$m
37MoneyTreeTM China TMT Report Q1/Q2 2016
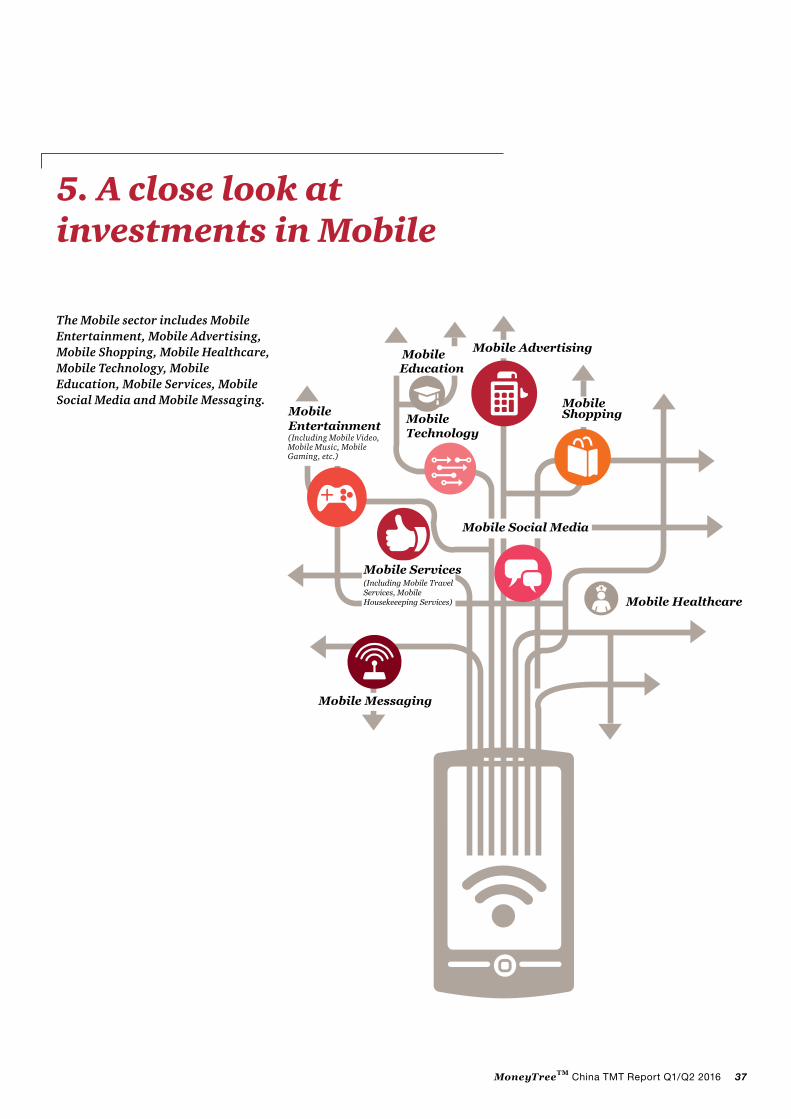
The Mobile sector includes Mobile Entertainment, Mobile Advertising, Mobile Shopping, Mobile Healthcare, Mobile Technology, Mobile Education, Mobile Services, Mobile Social Media and Mobile Messaging.
5. A close look at investments in Mobile
MobileShopping
Mobile
MobileEntertainment Mobile
Technology
Mobile Services(Including Mobile TravelServices, Mobile Housekeeeping Services)
Mobile Messaging
Education
Mobile Social Media
Mobile Advertising
Mobile Healthcare
(Including Mobile Video, Mobile Music, Mobile Gaming, etc.)
Figure 59: The top six regions for investment in the Telecommunications and Mobile sector Q1/Q2'16 (Deal volume/Deal value)
73 $5,017
12
8
$7718
$136
6 $53
$42
35 $328
0 6,0005,0003,000 4,0002,0001,000
Beijing
Shanghai
Shenzhen
ZhejiangProvince
JiangsuProvince
Guangdong Province (except Shenzhen)
Deal volume
US$m

38 MoneyTreeTM China TMT Report Q1/Q2 2016
Deal volume and value
Q1 2016
There were 96 deals in the Mobile sector in Q1 2016, with a total investment value of US$697 million.
Mobile Services:35 deals, 37% of the total; deal value of US$243 million, 35% of the total
Mobile Social Media:17 deals, 18% of the total; deal value of US$28 million, 4% of the total
Mobile Entertainment:14 deals, 15% of the total; deal value of US$35 million, 5% of the total
Mobile Healthcare:10 deals, 10% of the total; deal value of US$131 million, 19% of the total
Mobile Shopping:8 deals, 8% of the total; deal value of US$136 million, 19% of the total
Mobile Advertising:6 deals, 6% of the total; deal value of US$87 million, 12% of the total
Mobile Technology:3 deals, 3% of the total; deal value of US$34 million, 5% of the total
Mobile Education:3 deals, 3% of the total; deal value of US$3 million, 1% of the total
Mobile Messaging:No deals
Deal volume and value
Q2 2016
There were 56 deals in the Mobile sector in Q2 2016, with a total investment value of US$4.84 billion.
Mobile Services:19 deals, 34% of the total; deal value of US$4.58 billion, 95% of the total
Mobile Social Media:13 deals, 23% of the total; deal value of US$171 million, 3% of the total
Mobile Entertainment:12 deals, 21% of the total; deal value of US$47 million, 1% of the total
Mobile Technology:3 deals, 5% of the total; deal value of US$5 million, 0.1% of the total
Mobile Education:3 deals, 5% of the total; deal value of US$8 million, 0.2% of the total
Mobile Advertising:2 deals, 4% of the total; deal value of US$2 million, 0.1% of the total
Mobile Shopping:2 deals, 4% of the total; deal value of US$13 million, 0.3% of the total
Mobile Healthcare:2 deals, 4% of the total; deal value of US$12 million, 0.3% of the total
Mobile Messaging:No deals
Figure 60: Deal value by Mobile Internet subsegments – Q3 2013-Q2 2016
6,000
5,000
4,000
3,000
2,000
1,000
0
Q1’15
$215 $175 $448 $482$859 $853
$393$697
$1,386 $1,239
$4,247
$4,835
Q2’15 Q3’15 Q4’15 Q1’16 Q2’16Q3’13 Q4’13 Q1’14 Q2’14 Q3’14 Q4’14
US$m
Mobile Entertainment Mobile Advertising Mobile Shopping
Mobile Healthcare Mobile TechnologyMobile Education
Mobile Services Mobile Social MediaMobile Messaging

39MoneyTreeTM China TMT Report Q1/Q2 2016
In H1 2016, Mobile Services, Mobile Social Media and Mobile Healthcare were the three pillars of the Mobile sector
Mobile Services: The top ranking subsector had huge investments once again in taxi-hailing APPs
Taxi-hailing apps have been the major investment area for the Mobile Services subsector since 2014. In Q2 2016, a single deal valued at US$4.5 billion for a taxi-hailing app company was the biggest single-deal value in the TMT industry since 2012, creating a historical high for the total investments in Q2. Deal volume accounted for over 30%, and though it decreased slightly, there were no significant fluctuations.
Mobile is by now widely recognised as a sector located at the forefront of development, with broad appeal stemming from innovative developments such as Mobile Services and Mobile Social Media. Additionally, mobile service apps for the O2O platform remain red hot, while many traditional enterprises are striving to formulate strategies to adapt to "Internet +" in order to seek new breakthroughs and fresh opportunities. In the near future, fields such as social media and entertainment will mature, while more attention will be paid to areas such as healthcare and education.
PwC Viewpoints
Figure 61: Deal volume by Mobile subsegments – Q3 2013-Q2 2016
60
50
40
30
20
10
0
Q1’16 Q2’16Q3’13 Q4’13 Q1’14 Q2’14 Q3’14 Q4’14 Q1’15 Q2’15 Q3’15 Q4’15
1 1 1 11 1 1 1 11
1011 12
118 8 8 8 8 87 77 76 6 6 6 6 6 65 5 5 5
1512
14 14 1416
201819 19 19 19
15
24
20 2023 23
29 29 29
44
53
3235
2931
2 2 2 2 2223 3 3 33 333 4 4 443
9 9 9 9
2 2
10 10 1010
6
17
12 13
Mobile Entertainment Mobile Advertising Mobile Shopping
Mobile Healthcare Mobile TechnologyMobile Education
Mobile Services Mobile Social MediaMobile Messaging
Mobile Social Media: Ranking second, deal value in Q2 surpassed the previous peak since 2012
In H1 2016, the deal volume in Mobile Social Media decreased slightly compared to H2 2015. However, the deal value in Q2 surpassed that of Q3 2015, the highest level recorded since 2012. Additionally, there was a B round with a huge investment amounting to US$100 million in Mobile Social Media in Q2.
Mobile Healthcare: Ranking third, with both deal value and volume reaching new highs since 2012
In H1 2016, Mobile Healthcare surpassed Mobile Entertainment and jumped to the third spot, with a dramatic QoQ increase in both deal volume and deal value, both reflecting new record highs since 2012. The deal volume reached 10 for the first time, while deal value exceeded US$100 million.

40 MoneyTreeTM China TMT Report Q1/Q2 2016
6. Methodology and definitions
TMT is an acronym for Telecommunications, Media and Technology. The three words represent Telecommunications and Mobile, Media and Technology, respectively. In this report, we have carried out analysis of the three most active sectors within TMT. They are Technology, Internet and Telecommunications and Mobile.
This report covers Q1 and Q2 2016. However, in order to show trends and make comparisons in the industry, we have included data from the year H2 2013 to 2015. In this report, only deals disclosing specific investment data were included in relevant analysis. Deals that did not disclose the specific investment period, deal value or investment stage were excluded from the relevant analysis in order to maintain the accuracy of the report.
All data in this report was provided by Zero2IPO Research.
DefinitionsTechnology sector
Hardware: Computer hardware, computer peripherals, network equipment, etc.
Software: Basic software, software applications, etc.
IT Services: IT consultation, software outsourcing, hosting services, computer and network security, etc.
Electronics & Optoelectronics Devices: Optoelectronic components, optoelectronics, electronics, power supply, etc.
Semiconductor: IC design, IC testing and packaging, IC equipment manufacturing, etc.
Internet sector
E-commerce: B2C, B2B, C2C, etc.
Internet Marketing: Information portal, search engine, advertising agency and Internet marketing services
Internet Services: Online travel services, online recruitment services, online housekeeping services, etc.
Online Education: E-learning, online classroom, etc.
Online Entertainment: Online gaming, online video and online music
Social Media: BBS/Forum, online networking, etc.
Internet Finance: I-finance, E-payment, etc.
Telecommunications and Mobile sector
Telecom Equipment and Terminals: Telecommunications and mobile equipment, telecommunications and mobile terminals, telecommunications and mobile software, etc.
Other Telecommunications Subsectors: Mobile operators, Fixed-line operators, Virtual network operator (VNO) and others
Mobile: Mobile entertainment, Mobile advertising, Mobile shopping, Mobile healthcare, Mobile technology, Mobile education, Mobile services, Mobile social media, and Mobile messaging
Entertainment and Media sector
Traditional Media: Newspaper, magazines, publishing, etc.
Outdoor Media: Outdoor print ads, outdoor LED TV, mobile TV, building TV, etc.
Video Production and Distribution: Film and television production and distribution, film projection, etc.
Advertising Creation/Agency: Ad creation, media buying, ad agency, etc.
Cultural Transmission: Culture brokerage and agency, etc.
Entertainment & Leisure: Animation and other industries
41MoneyTreeTM China TMT Report Q1/Q2 2016
Stage of development
Early stage: This stage varies from one to five years while the product or concept is under development and not yet in mass and commercial production. During this stage, funds are mainly used for acquiring production equipment and developing products as well as marketing and setting up management systems.
Expansion stage: The investment period at this stage usually lasts about two or three years. The products or services have been recognised by the market. The company generally needs more funds to further develop the product, as well as to expand facilities and production. Inventory planning and marketing efforts are also ramped up.
Late stage: During this stage, the company has grown its operating revenue, and is more likely to be, but not necessarily, profitable. The company may have plans to go public. The main purpose of financing is to seek capital to grow capacity, and to introduce shareholders with industry experience and influence, thereby increasing corporate recognition and attracting shareholders. The company will aim to improve its financial structure and management system in preparation for listing. At this stage, the investment risk is the lowest, but the chance of high returns is also lower.
PIPE (private investment in public equity): PE investments in publicly listed companies via preferential allotments or private placements, and the acquisition of shares by PE firms via the secondary market.
Exits
IPO: IPO is short for initial public offering. IPO refers to listing on the stock markets in Shanghai, Shenzhen, Hong Kong, and overseas.
Strategic sale: This includes the sale of the PE or VC investors’ equity stakes (or the entire investee company itself) to a third-party company.
Management buy-out: The purchase of a company by its management through either debt-credit finance or stock transaction, which results in relevant changes in corporate ownership, control, residual claim and assets, in order to alter the structure of corporate proprietary rights. Through management buy-out, the company’s operators become its owners.
Secondary sale: Any purchase of the PE or VC investors’ equity stakes by another PE or VC investors constitutes secondary sale.

42 MoneyTreeTM China TMT Report Q1/Q2 2016
If you’d like to discuss what’s happening in your particular TMT market or how PwC might be able to help your company meet its challenges, please reach out to one of the TMT industry leaders listed here.
7. Contacts
Shenzhen Wilson Chow
PwC China/Hong Kong TMT Leader+86 (755) 8261 8886 [email protected]
Beijing
Qin Zhang+86 (10) 6533 2098 [email protected]
Shanghai
Jianbin GaoPwC China TMT Leader+86 (21) 2323 3362 [email protected]
Roland Xu+86 (21) 2323 2588 [email protected]
Frank Lin+86 (21) 2323 [email protected]
MoneyTreeTM China TMT Report Editorial Team
Frank LinPartner, TMT [email protected]
Stacy ZhangMarketing Manager, Private Equity & [email protected]
Catherine GuSenior Associate, [email protected]
GlobalRaman Chitkara+1 408 817 [email protected]
AustraliaRod Dring+61 2 8266 [email protected]
BrazilEstela Vieira+55 1 3674 [email protected]
CanadaChristopher Dulny+1 416 869 [email protected]
ChinaJianbin Gao+86 (21) 2323 [email protected]
FrancePierre Marty+33 1 5657 [email protected]
GermanyWerner Ballhaus+49 211 981 [email protected]
IndiaSandeep Ladda+91 22 6689 [email protected]
JapanMasahiro Ozaki+81 3 5326 9090 [email protected]
KoreaHoonsoo Yoon+82 2 709 [email protected]
NetherlandsIlja Linnemeijer+31 (0) 88 792 49 [email protected]
RussiaYury Pukha+7 495 223 [email protected]
SingaporeMark Jansen+65 6236 [email protected]
TaiwanAndy Chang+886 (2) 2729 6666 ext [email protected]
UAEPhilip Shepherd+97 1 4304 [email protected]
UKJass Sarai+44 (0) 1895 52 [email protected]
USPierre-Alain Sur+1 646 471 [email protected]

43MoneyTreeTM China TMT Report Q1/Q2 2016

www.pwc.com This content is for general information purposes only, and should not be used as a substitute for consultation with professional advisors.
© 2016 PwC. All rights reserved. PwC refers to the PwC network and/or one or more of its member firms, each of which is a separate legal entity. Please see www.pwc.com/structure for further details.
PwC – Gobal
PwC helps organizations and individuals create the value they’re looking for. We’re a network of firms in 157 countries with more than 208,000 people who are committed to delivering quality in assurance, tax and advisory services. Tell us what matters to you and find out more by visiting us at www.pwc.com.
PwC refers to the PwC network and/or one or more of its member firms, each of which is a separate legal entity. Please see www.pwc.com/structure (http://www.pwc.com/structure) for further details.
PwC – Mainland China, Hong Kong and Macau
PwC in Mainland China, Hong Kong and Macau work together on a collaborative basis, subject to local applicable laws. Collectively, we have around 700 partners and a strength of around 18,000 people.
Providing organizations with the advice they need, wherever they may be located. Our highly qualified, experienced professionals listen to different points of view to help organizations solve their business issues and identify and maximize the opportunities they seek. Our industry specialization allows us to help co-create solutions with our clients for their sector of interest.
We are located in these cities: Beijing, Shanghai, Shenyang, Tianjin, Chongqing, Dalian, Xi’an, Qingdao, Nanjing, Suzhou, Hangzhou, Ningbo, Changsha, Xiamen, Guangzhou, Shenzhen, Wuhan, HongKong and Macau.
About PwC’s Technology Institute
The Technology Institute is PwC’s global research network that studies the business of technology and the technology of business with the purpose of creating thought leadership that offers both fact-based analysis and experience-based perspectives. Technology Institute insights and viewpoints originate from active collaboration between our professionals across the globe and their first-hand experiences working in and with the technology industry.