pricing strategies for brands
TRANSCRIPT

Case Study
Pricing Strategy for Progresso Soup
Source: IRI Academic data 1900 supermarkets, 102 Chains across the
country + Census Demographics
D3M
Vishal Singh
NYU-Stern

Learning Objectives
Methodological Topics Developing Regression based Demand Models
Understand elasticity, Controls for Seasonality, Competition
How to use Regression Estimates Pricing Strategies, Forecasting
Market Segmentation Use Principle Component/Factor Analysis to understand demographic
characteristics
Use Cluster Analysis for Market Segmentation
Basics of Pricing Strategies Price based Segmentation & Profitability
o Institutional: Understand the scope of Scanner Data Primary source of data for the CPG industry

Current Situation
You are recently hired by General Mills as a brand manager for one
of their key brands “Progresso”. This product category is dominated
by Campbell but Progresso has made strides gaining market share
in several markets.
Background: The soup category is highly seasonal with demand
peaking in Winter months. In the past, Progresso has employed a
strategy of significantly reducing prices in periods of high demand
(Winter months) and then raising the prices during off-peak months.

Objective
Pricing Strategy for Progresso
Using the data provided, evaluate the current pricing strategy
of Progresso. Does “countercyclical pricing” make sense?
Evaluate the performance of Progresso across geographies &
customer demographics
Develop a regression based demand model to analyze price
elasticity for Progresso How does your own & cross-price elasticity vary by Census region?
Across Consumer Segments?
Suggest an alternate pricing strategy using information on
elasticity estimates to maximize profits

Understand the Scope of Data
Data Source: IRI Sample: 2000+ supermarkets from 102 chains across the US
Six years (2001-2006)
Store demographics based on ZIP codes (from US Census)
Monthly Sales for each brand in each store, Price/Promotion
NOTE: This is pretty much the data that Campbell or Progresso would have

Approach
Always start by summarizing the data
Store Location & Demographics
Marketing Mix (Shares/Price/Promotion)
Seasonality
Strong Markets & Time Periods
There are two files:
“Transaction” data
Store demographics
What is the information contained in each? What is
the link? Why are they not merged to begin with?

Quick Examination of Store Demographics
Lets Keep a few variables (State, Income, & Income
Quintiles) from Store demographic file and merge
with Transaction data
– Note that a full merge will drastically increase the size of
our file
Always check your variables at a higher level
– Two important variables always are Time & Geography

Variables in Transaction Data Understand the variables. Why is “date” messed up?

Average Price & Volume

By Census Regions

Time Series of Sales
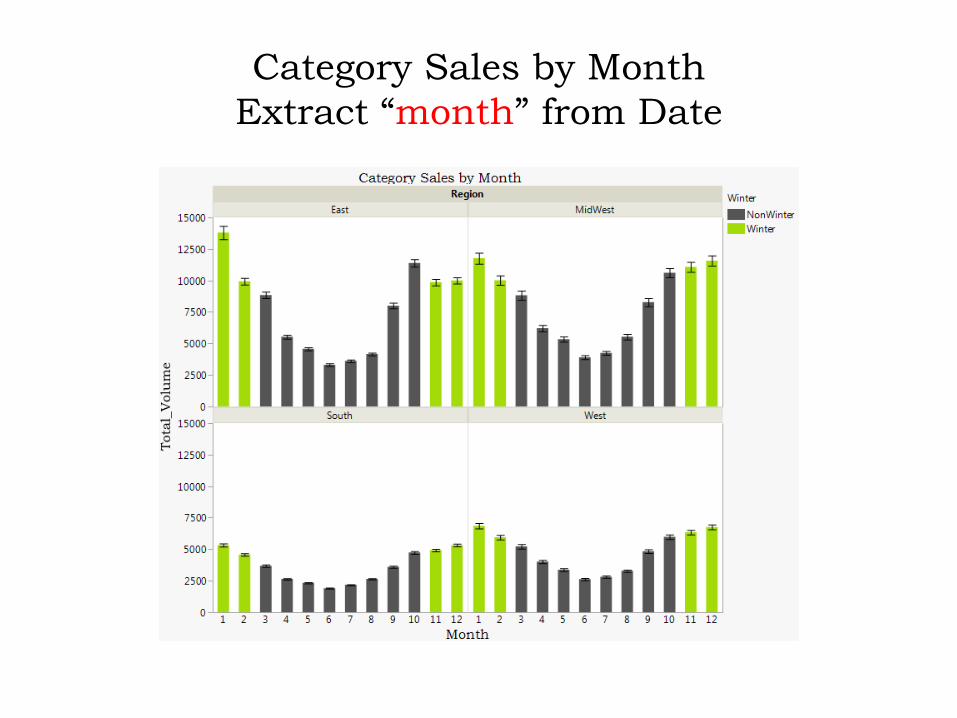
Category Sales by Month
Extract “month” from Date

Average Price by Month
What do we infer?

Market Shares by Month for Progresso
Relate this to Pricing Strategy

What about our competitor?


What have we learnt? Should we Change the definition of “Winter” dummy?
Using the data provided, evaluate the current pricing strategy of Progresso. Does “countercyclical pricing” make sense?
Evaluate the performance of Progresso across geographies & customer demographics
Develop a regression based demand model to analyze price elasticity for Progresso How does your own & cross-price elasticity vary by Census region?
Across Consumer Segments?
Suggest an alternate pricing strategy using information on elasticity estimates to maximize profits

Building a Regression Model
Price Elasticity & Segmentation for Progresso Soup
D3M

F1: Understand the Phenomenon
Examine your objectives at a broad/intuitive level
o Without thinking about data analysis
What factors might explain variation in monthly
sales of Progresso across stores in the US? o Our objective might be specific (e.g. estimate price elasticity to
guide pricing decisions) but we need to “control” for other
factors that impact the phenomenon
o Some things we just can’t control, e.g. we don’t have data or
maybe ability to measure

Regression Based Modeling Fundamental Modeling Tool
Why do we (teach) use regressions?
Determine whether the independent variables explain a significant
variation in the dependent variable: whether a relationship exists.
Determine how much of the variation in the dependent variable can be explained by the independent variables: strength of the relationship.
Control for other independent variables when evaluating the contributions of a specific variable or set of variables. Marginal effect
Forecast/Predict the values of the dependent variable.
Use regression results as inputs to additional computations: Optimal pricing, promotion, time to launch a product….

Log Models will Fit Data Better
Log-Log Model:
• The Price coefficient can be interpreted as :1
percent change in Price leads to an estimated b1
percentage change in the Sales. Therefore b1 is
the Price elasticity.
i1i10i ε Pln ββ Sln

Intuition for Log Models: Click on the link below. It takes you to GAPMINDER,
where you can see relationship between different Country attributes over time.
Change the scale in the corner from “Log” to “Linear” and imagine how a
regression line would fit.

Semi-log specification
For the semi-log model:
• Now Price is measured in regular units
and Sales in log.
– The coefficient of Price can be interpreted as :
a 1 unit change in Price leads to an
estimated b1 percentage change in the Sales.
i1i10i ε P ββ S log

Elasticities from Regression
Linear Model
SALES
PRICEae
PRICEaaSALES
1
10
PRICEae
PRICEaaSALES
1
10
ln
1
10
lnln
ae
PRICEaaSALES
ii
itit
Semi-Log Model
Log-Log Model

Why do we care about price elasticity?
How do you price a product?
o What factors must we consider in determining what price to
charge?
A key input into our pricing decision is consumer price
sensitivity to our product
Our exercise will involve
Estimating price elasticity for Progresso, after controlling for
other factors impacting sales
Examine how price elasticity varies by various segments (e.g.
East coast vs. South, High vs. low income, Output from
clustering of IRI stores)

Why Care About Elasticity? Cross Price Elasticity is one of the best measure to understand Competition
Log-log regression model:
log 𝑞𝐴 = 𝛽0𝐴 + 𝛽𝐴𝐴 log 𝑃𝐴 + 𝛽𝐴𝐵 log 𝑃𝐵 + 𝛽𝐴𝐶 log 𝑃𝐶 + 𝛽𝐴𝐷 log 𝑃𝐷 + 𝜀𝐴
Own price elasticity Cross price elasticities
Understand this intuitively

Lets go to data for some intuition
Price Elasticity & Segmentation for Progresso Soup
D3M

Lets start with the simplest model Sales only depend on my price
Linear Semi-log Log-log
What are the price elastitcities from the 3 models?

Log-log Model With Competitive Prices
Dependent variable: Log(Volume_Prog)
What brand competes most closely with Progresso?
How much would Sales of Progresso drop if Campbell runs a 10% promotion?

Question
What would happen to Progresso sales if
Progresso cuts its price by 10%?
Campbell/Other/PL cut price by 10%
Closest competitor to Progresso?
Anything unintuitive?
Keep in mind that what we can potentially understand from numbers depends on what inputs we feed in
GiGo stands for ‘Garbage in Garbage out’
Always question the broader context
Notice the implications when we build a better regression model and how price elasticity estimates change

Create a New Variable “Season”
Months of Oct to March as “High Season”
New Definition Old Definition

Control for Seasonality of Sales
Dependent variable: Log(Volume_Prog)
We continue to get incorrect sign for “Other” brand cross price elasticity
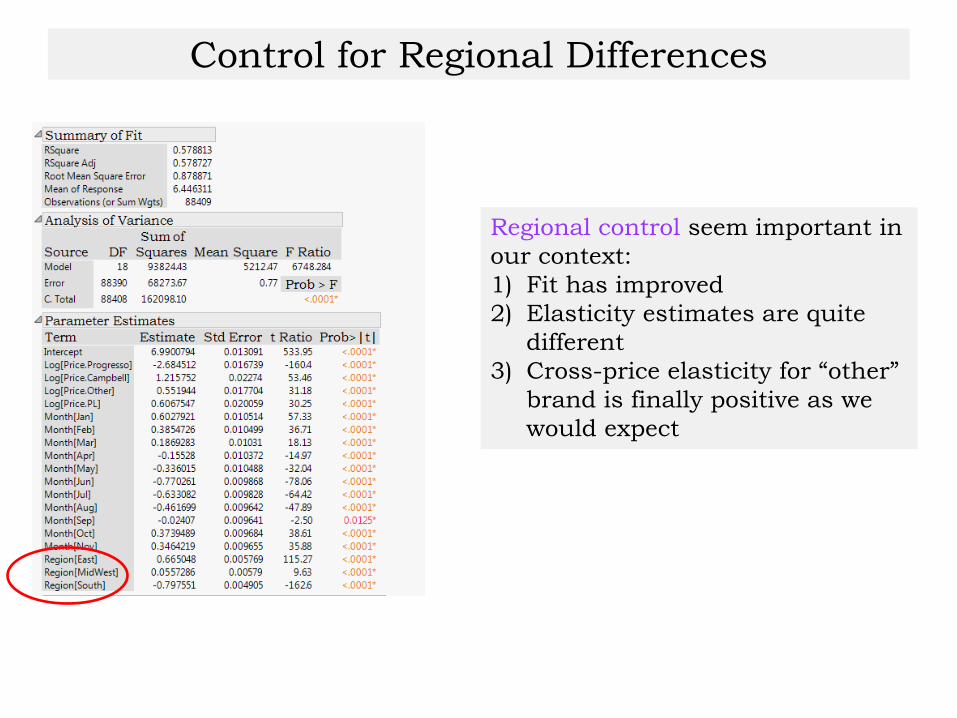
Control for Regional Differences
Regional control seem important in
our context:
1) Fit has improved
2) Elasticity estimates are quite
different
3) Cross-price elasticity for “other”
brand is finally positive as we
would expect

Regressions by Census Region Note: Seasonality controls not shown
East Coast Midwest
South West Coast
What can we say about competitive strength of Progresso across US Census Regions?
If we were manager of Progresso, these numbers provide a number of useful insights.

Discussion
Analyze the competitive position of Progresso across Census
Regions based on own & cross-price elasticity
What are the implications in terms of pricing & positioning
strategies for Progresso?
Next: Market Segmentation of Stores

Multivariate Analysis Segmenting Stores in Soup Case Study
D3M
This is the store demo file

Variables in Store Demo File

Objective
Segment the 2000 IRI stores into smaller groups Interpret the segments you created
Compute the price elasticity for each segment and discuss the pricing strategy that Progresso should pursue to maximize profits State the assumptions used in deriving optimal prices for
profit maximization
Discuss the practicality of your recommended pricing strategy

Approach
Questions you should ask
Segmentation based on what??
How many segments??
Always start by summarizing variables in your
data and understanding the basic relationships
Understand the correlation b/w variables –store
demographics & market shares
These are what we will use for segmentation

As usual, start by summarizing the data

Several of the
Demographic
variables are Highly
Correlated

Correlations of Market Shares Across 2000 Stores What can we learn about Progresso’s Competitors from just correlations?

Campbell does well in Midwest
& South
Progresso is strong in East,
followed by West

Segmentation of IRI Stores
D3M

Factor & Cluster Analysis
Learning Objectives
Unsupervised Learning Methods
Principle component, Factor Analysis, & Clustering
Objective is Dimension Reduction Reduce the number of collinear variables (PCA/Factor)
Group your rows (e.g. customers, markets, counties): Cluster Analysis
Additional Learning Resources
MIT Open Courses Lecture 11 & 14
Data Mining Class at U of Chicago (Lecture notes 7 & 8)
Stanford course on Machine Learning: Watch Lecture 10 on
“Unsupervised Learning”

Note the Difference between Cluster and PCA/Factor analysis
V1 V2 V3 V4 V5 V20 …..
Cluster Analysis
(Group Subjects)
Factor Analysis
(Group Variables)
Data

Variable Reduction Techniques You are working with columns here
We will look at 3 Techniques
Principle Component Analysis
Factor Analysis
Cluster of Variables

PCA/Factor Analysis
Our demographic variables are highly correlated If we were to use these in a Regression model for example, we will high
multicollinearity
A useful technique for reducing the number of variables is Principle Component Analysis (PCA) & Factor Analysis
PCA/Factor analysis is able to summarize the information contained in a larger number of variables into a smaller number of ‘factors’ without significant loss of information
Widely used technique in Psychometrics (less so in econometrics)

If we use 3 components, we capture approximately 84% of information
contained in the 10 demographics
Eigenvalues of a matrix are also
called characteristic roots and
represents the variance accounted
for by a linear combination of the
variables. Usually # of components
to use is Eigenvalue greater than 1.
In our case its 3
Principle Component Analysis

Cluster of Variable Algorithm
We can use Median Income, % Kids 18, and % Black. These 3 variables will be representative of other demographics in its cluster

Look for large positive or negative numbers for each factor. See the corresponding variable names to interpret the underlying ‘factor’
These are called factor “loadings”. Measures the correlation between each demographic
and the underlying “factor”. Our Job to Interpret and put a label to these.
Factor Analysis
Using 3 “factors” instead of 10
demographics, we capture approx.
84% of the information.

What do these techniques do?
Take a large number of variables
that are highly correlated & create
new variables
New variables (components or
factors) are linear combinations of
our current variables
Goal is to retain most of the
variability (information) in the data
Reduce the dimension of the
problem with little loss of
information
Newly created variables are
orthogonal (no correlation)
Note: Our current application of 10 demographic variables is quite trivial. We will see larger problems where these methods are more useful
These are the
new variables
in our data.
Our job is to
interpret
them. The
new variables
(factors) are
standardized
and
uncorrelated.
We can use
them further
for other
analysis, for
example
Segmentation
of stores in
our data.

Examine the Factor Scores
The new variables (Factors) have a mean of 0 and Std of 1. They are orthogonal to each other (zero correlation)

Cluster Analysis Segmentation of IRI Stores
D3M

Now we are interested in grouping rows (Stores in our case)
V1 V2 V3 V4 V5 V20 …..
Cluster Analysis
(Group Subjects)
Factor Analysis
(Group Variables)
Data

57
Cluster Analysis
Cluster analysis is a technique used
to identify groups of ‘similar’
customers in a market (i.e., market
segmentation).
Cluster analysis encompasses a
number of different algorithms and
methods for grouping objects of
similar kind into categories.

58
General question: how to organize observed data into meaningful structures
• Examples: o In food stores items of similar nature, such as
different types of meat or vegetables are displayed in the same or nearby locations.
o Biologists have to organize the different species of animals-- man belongs to the primates, the mammals, the amniotes, the vertebrates, and the animals.
o In medicine, clustering diseases, cures for diseases, or symptoms of diseases can lead to very useful taxonomies.
o In the field of psychiatry, the correct diagnosis of clusters of symptoms such as paranoia, schizophrenia, etc. is essential for successful therapy.
o Collaborative filtering & Recommendation systems

59
Cluster Analysis
Cluster analysis works on the principle of maximizing the between-cluster variance while minimizing the within cluster variance
Methods: Hierarchical & K-mean Clustering

Clustering Methods
Hierarchical clustering is an iterative process that starts with
each observation in its own cluster. At each stage, the
algorithm combines two clusters that are closest together. At
the final stage, all observations are in one cluster.
Useful for small data sets, takes a long time for large tables.
60
K-means clustering starts with a known number of clusters, k. The
algorithm picks k cluster seed points, then assigns each observation
to a cluster. It then replaces the cluster seeds with the cluster
means and repeats until the clusters stabilize.
Works well with large data sets

Hierarchical Clustering of Stores Questions to Ask: Clustering based on what? How Many Segments?


Exercise
Conduct a Hierarchical cluster analysis based on Saved Factor Scores & Market Shares of Brands
To keep things manageable, lets use a 5-segment solution
Interpret the clusters based on Median Income, % Kids Under 18, % White, & Market Shares
What segment has the highest appeal for Progresso?
Save the cluster membership and merge file with Transaction data Redo the regression analysis and analyze the own & cross-price elasticity in
each segment
Suggest an optimal pricing strategy for Progresso for each segment
Discuss practical considerations in using such segmentation/pricing scheme

Appendix
Quick Review of Pricing Strategies
Quick Review of Pricing Strategies
Market Segmentation
Optimal Pricing

Cost-Plus Pricing
𝑃𝑟𝑖𝑐𝑒 = 𝐴𝐶 × 1 + markup
AC = Average cost of meeting a certain sales target
markup = Mark-up percentage

Competition-Based Pricing
𝑃𝑟𝑖𝑐𝑒𝑢𝑠 = 𝑃𝑟𝑖𝑐𝑒𝑡ℎ𝑒𝑚 ± 𝜀
“Example: Follow the leader ”

Competition Manufacturer Distributor Retailer
Channel Pricing
Psychology and Pricing
Demand Measurement
Π(p) = p*q(p) – [FC + c*q(p)]

Market Segmentation & Pricing

What is the Difference between the two?
Airline Pricing
How do airlines
segment customers?


Amazon.com price histories

McDonald’s - WiFi charge:$0
The Plaza Hotel, NYC. WiFi charge in $1000/night suite: $14.95
Price of WiFi

Versioning: Product Line Sort
Menu of products at different price points with different attributes:

Price Customization: Legality
B2C: No pricing law Price discrimination is legal but you can get in trouble if
customers who pay a higher price are a protected class under civil rights law
In addition, some states have laws that hold private businesses liable for certain types of discrimination

Price Customization: Legality
B2B: Robinson-Patman Act of
1936: “It shall be unlawful for any person engaged in commerce, in the course of such commerce, either directly or indirectly, to discriminate in price between different purchasers of commodities of like grade and quality, where either or any of the purchases involved in such discrimination are in commerce….”

Demand Measurement

Approaches: Regression Based Models
Surveys
Field Experiments
Historical Data
Conjoint Analysis

Psychology & Pricing
Pay-What-You-Want
Free
Psychology and Pricing
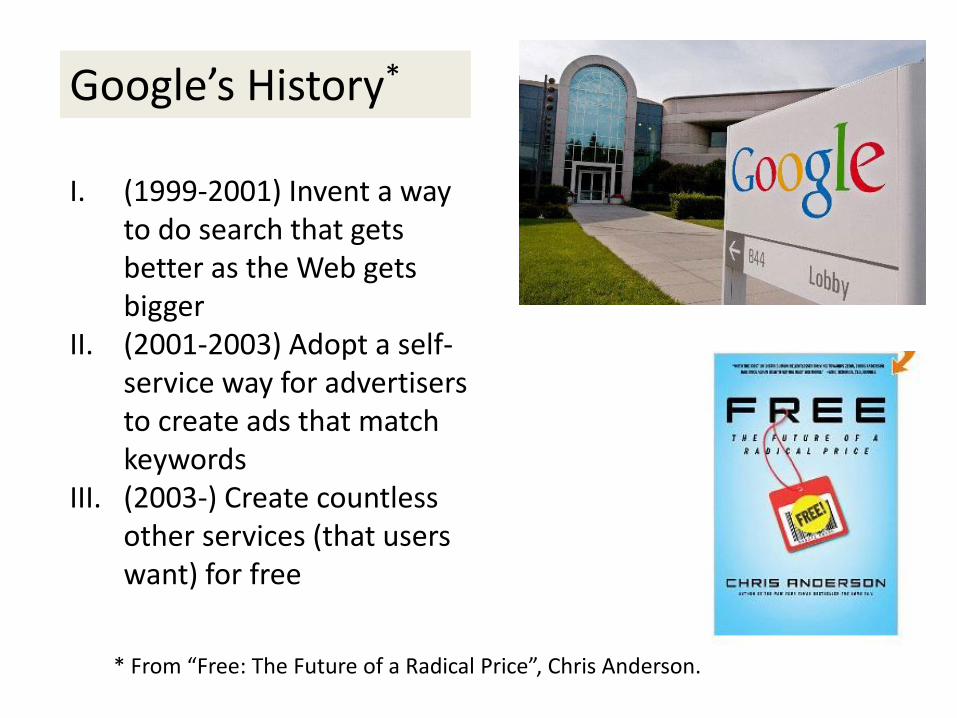
Google’s History*
I. (1999-2001) Invent a way to do search that gets better as the Web gets bigger
II. (2001-2003) Adopt a self-service way for advertisers to create ads that match keywords
III. (2003-) Create countless other services (that users want) for free
* From “Free: The Future of a Radical Price”, Chris Anderson.

Google’s Max Strategy
Free is the fastest way to maximize market share and enable mass adoption.
“Take whatever it is you are doing and do it to the max in terms of distribution. The other way of saying this is that since marginal cost of distribution is free, you might as well put things everywhere”

Why does Free work so well?
$0.15 $0.01
73% choose Lindt 27% choose Hershey
A
Lindt Truffle Hershey Kiss
$0.14 Free!
31% choose Lindt 69% choose Hershey
B
Source: “Predictably Irrational”, Dan Ariely

Dropbox: An Example of “Freemium”

Psychology: Price Framing
$2.80/gallon, $0.10 discount if pay with cash
$2.70/gallon, $0.10 surcharge if pay with credit card

Price?: “It’s up to you. It’s
really up to you.”
Success? Probably
Estimate: 1M downloads with 40% paying something.
Pricing: You Decide!
Success? Probably
Estimate: 1M downloads with 40% paying something.

Price Optimization
p
Π
Π(p)
p
0)(
p
p

Simple case
• Given knowledge of my sales’ sensitivity to price and cost structure, how should I price?
• Let q(p) be my sales at price p. Total profit at p is then
• To make things easy assume that you are the market leader (ignore competition)
Π(p) = p*q(p) – [FC + c*q(p)]
Total cost at the price p

p
Π
Π(p)
p
Analytical solution: 0)(
p
p
Deriving the optimal price

• Analytical solution:
11
c
p
β is the own
price elasticity
We can obtain β from the log-log sales response model!
Optimal price depends
on marginal cost and
own price elasticity